

The genomic ecosystem of transposable elements in maize
- PMID: 34648488
- PMCID: PMC8547701
- DOI: 10.1371/journal.pgen.1009768
The genomic ecosystem of transposable elements in maize
Abstract
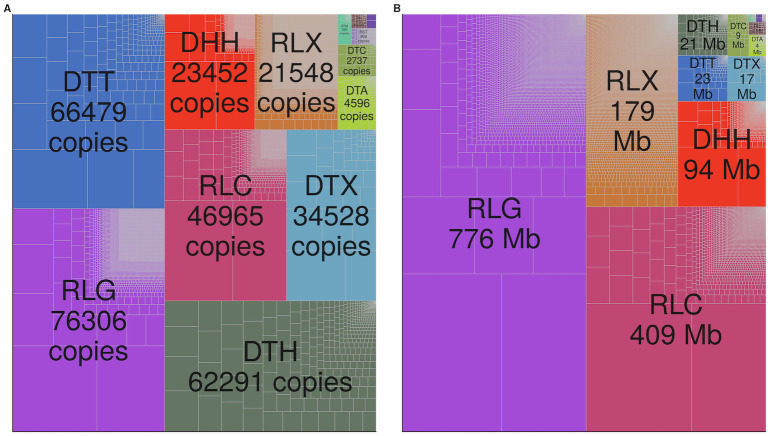
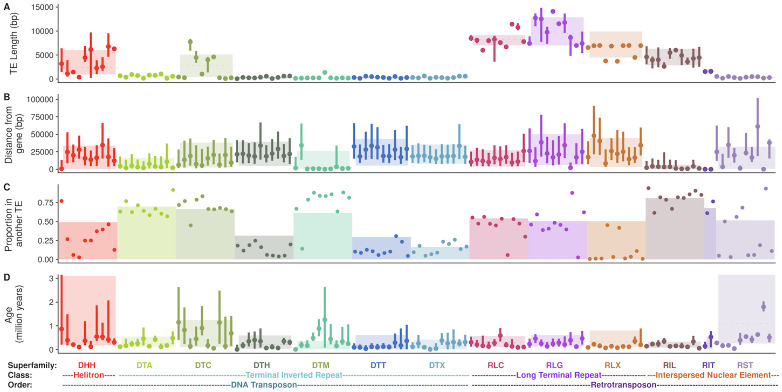
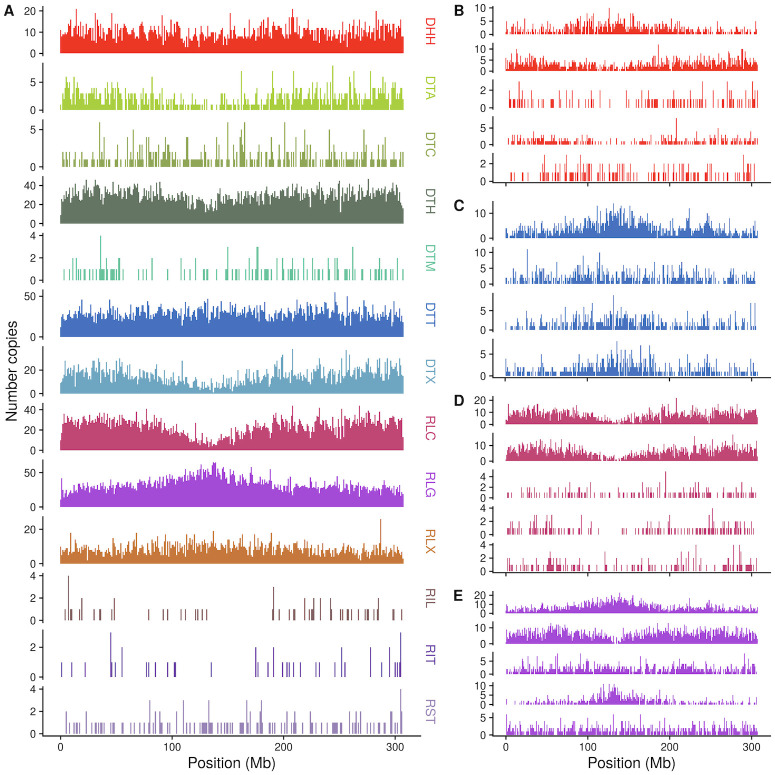
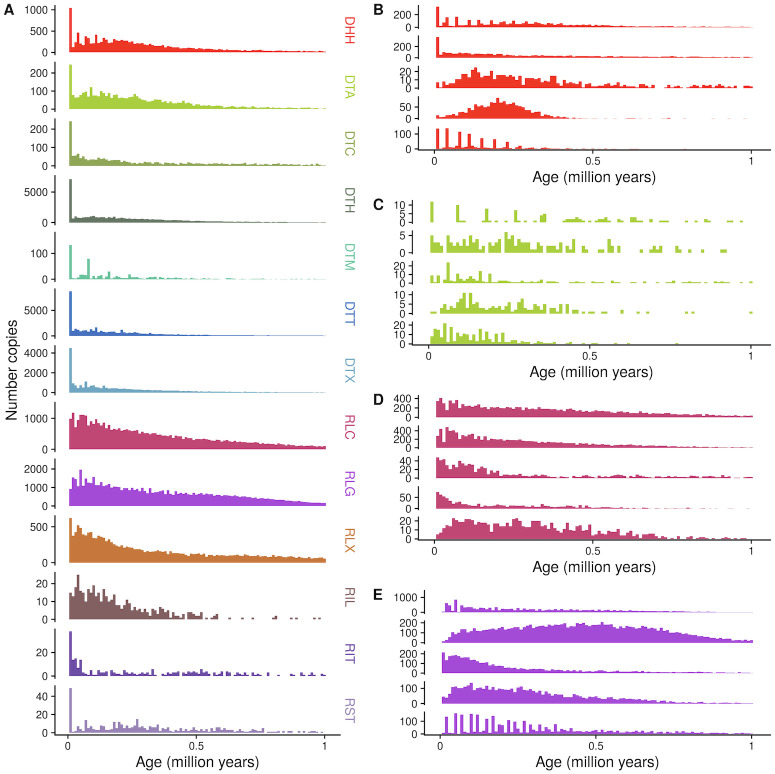
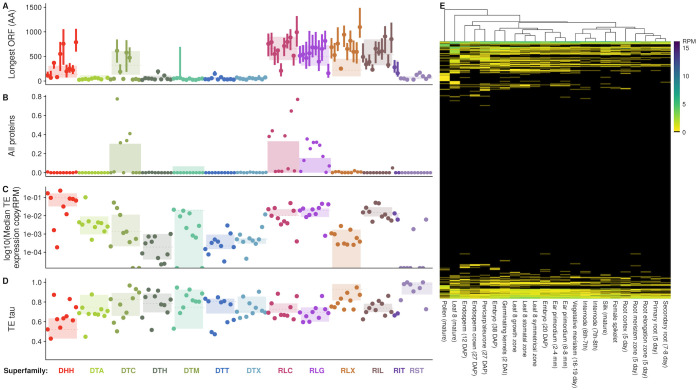
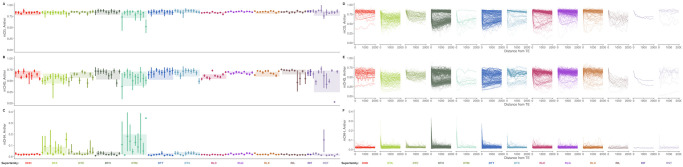
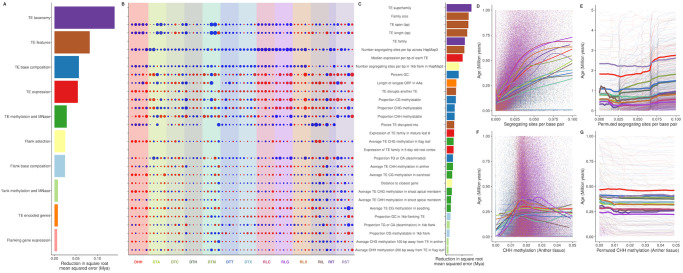
Transposable elements (TEs) constitute the majority of flowering plant DNA, reflecting their tremendous success in subverting, avoiding, and surviving the defenses of their host genomes to ensure their selfish replication. More than 85% of the sequence of the maize genome can be ascribed to past transposition, providing a major contribution to the structure of the genome. Evidence from individual loci has informed our understanding of how transposition has shaped the genome, and a number of individual TE insertions have been causally linked to dramatic phenotypic changes. Genome-wide analyses in maize and other taxa have frequently represented TEs as a relatively homogeneous class of fragmentary relics of past transposition, obscuring their evolutionary history and interaction with their host genome. Using an updated annotation of structurally intact TEs in the maize reference genome, we investigate the family-level dynamics of TEs in maize. Integrating a variety of data, from descriptors of individual TEs like coding capacity, expression, and methylation, as well as similar features of the sequence they inserted into, we model the relationship between attributes of the genomic environment and the survival of TE copies and families. In contrast to the wholesale relegation of all TEs to a single category of junk DNA, these differences reveal a diversity of survival strategies of TE families. Together these generate a rich ecology of the genome, with each TE family representing the evolution of a distinct ecological niche. We conclude that while the impact of transposition is highly family- and context-dependent, a family-level understanding of the ecology of TEs in the genome can refine our ability to predict the role of TEs in generating genetic and phenotypic diversity.
Conflict of interest statement
The authors have declared that no competing interests exist.
Figures
Similar articles
-
Monitoring the interplay between transposable element families and DNA methylation in maize.PLoS Genet. 2019 Sep 9;15(9):e1008291. doi: 10.1371/journal.pgen.1008291. eCollection 2019 Sep. PLoS Genet. 2019. PMID: 31498837 Free PMC article.
-
Transposable elements contribute to dynamic genome content in maize.Plant J. 2019 Dec;100(5):1052-1065. doi: 10.1111/tpj.14489. Epub 2019 Sep 18. Plant J. 2019. PMID: 31381222
-
Three groups of transposable elements with contrasting copy number dynamics and host responses in the maize (Zea mays ssp. mays) genome.PLoS Genet. 2014 Apr 17;10(4):e1004298. doi: 10.1371/journal.pgen.1004298. eCollection 2014 Apr. PLoS Genet. 2014. PMID: 24743518 Free PMC article.
-
Transposable element evolution in plant genome ecosystems.Curr Opin Plant Biol. 2023 Oct;75:102418. doi: 10.1016/j.pbi.2023.102418. Epub 2023 Jul 15. Curr Opin Plant Biol. 2023. PMID: 37459733 Review.
-
The evolution and function of transposons in epigenetic regulation in response to the environment.Curr Opin Plant Biol. 2022 Oct;69:102277. doi: 10.1016/j.pbi.2022.102277. Epub 2022 Aug 10. Curr Opin Plant Biol. 2022. PMID: 35961279 Review.
Cited by
-
The ecology of palm genomes: repeat-associated genome size expansion is constrained by aridity.New Phytol. 2022 Oct;236(2):433-446. doi: 10.1111/nph.18323. Epub 2022 Jul 7. New Phytol. 2022. PMID: 35717562 Free PMC article.
-
Analyses of 600+ insect genomes reveal repetitive element dynamics and highlight biodiversity-scale repeat annotation challenges.Genome Res. 2023 Oct;33(10):1708-1717. doi: 10.1101/gr.277387.122. Epub 2023 Sep 22. Genome Res. 2023. PMID: 37739812 Free PMC article.
-
RepeatModeler2 for automated genomic discovery of transposable element families.Proc Natl Acad Sci U S A. 2020 Apr 28;117(17):9451-9457. doi: 10.1073/pnas.1921046117. Epub 2020 Apr 16. Proc Natl Acad Sci U S A. 2020. PMID: 32300014 Free PMC article.
-
Evolution of genome structure in the Drosophila simulans species complex.Genome Res. 2021 Mar;31(3):380-396. doi: 10.1101/gr.263442.120. Epub 2021 Feb 9. Genome Res. 2021. PMID: 33563718 Free PMC article.
-
Integrase-associated niche differentiation of endogenous large DNA viruses in crustaceans.Microbiol Spectr. 2024 Jan 11;12(1):e0055923. doi: 10.1128/spectrum.00559-23. Epub 2023 Dec 8. Microbiol Spectr. 2024. PMID: 38063384 Free PMC article.
References
-
- Lisch D. How important are transposons for plant evolution? Nature Reviews Genetics. 2013;14(1):49–61. - PubMed
-
- Charlesworth B, Charlesworth D. The population dynamics of transposable elements. Genetical Research. 1983;42(01):1–27.
Publication types
MeSH terms
Substances
LinkOut - more resources
Full Text Sources
Miscellaneous
