. 2021 Dec 6;31(23):5149-5162.e6.
doi: 10.1016/j.cub.2021.09.031. Epub 2021 Oct 13.

Hallstatt miners consumed blue cheese and beer during the Iron Age and retained a non-Westernized gut microbiome until the Baroque period

Affiliations

Hallstatt miners consumed blue cheese and beer during the Iron Age and retained a non-Westernized gut microbiome until the Baroque period

Frank Maixner et al. Curr Biol. .

Abstract

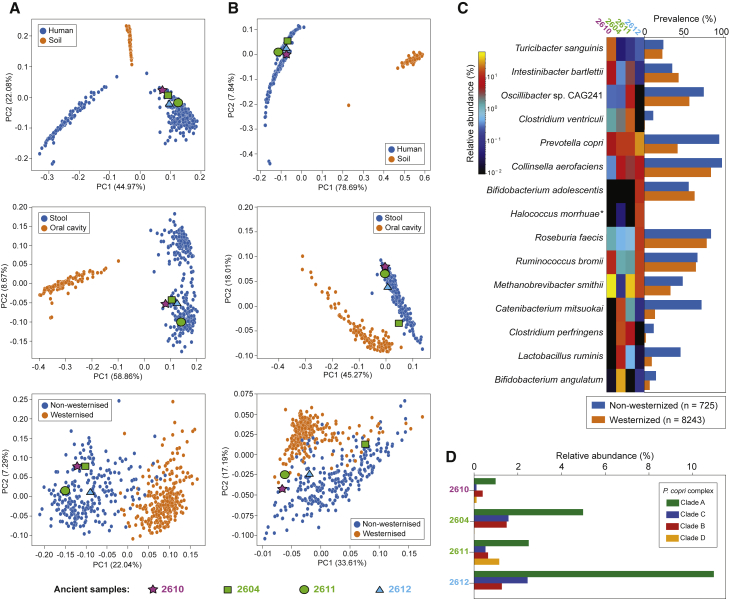
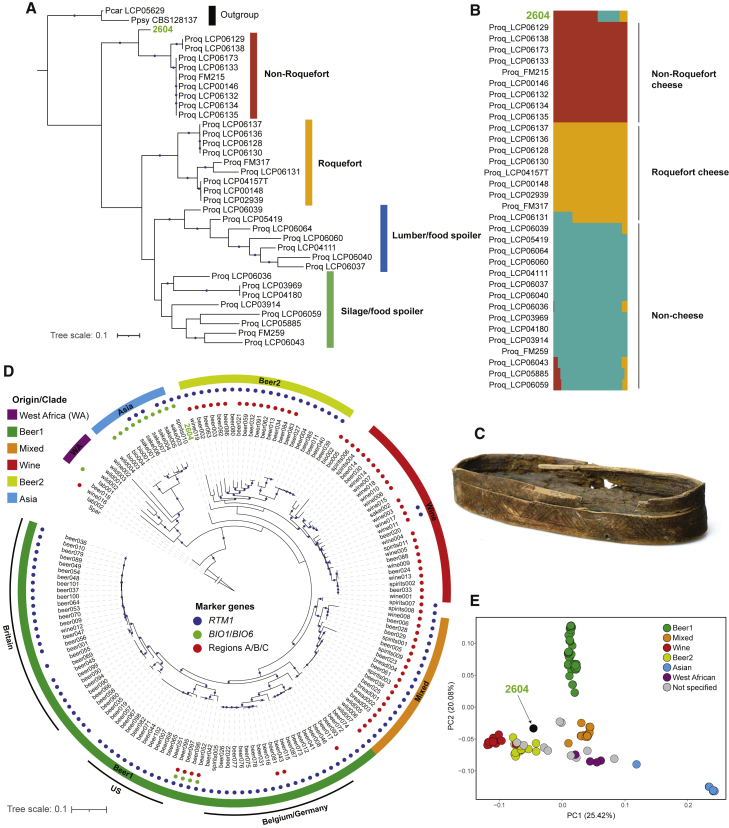
We subjected human paleofeces dating from the Bronze Age to the Baroque period (18th century AD) to in-depth microscopic, metagenomic, and proteomic analyses. The paleofeces were preserved in the underground salt mines of the UNESCO World Heritage site of Hallstatt in Austria. This allowed us to reconstruct the diet of the former population and gain insights into their ancient gut microbiome composition. Our dietary survey identified bran and glumes of different cereals as some of the most prevalent plant fragments. This highly fibrous, carbohydrate-rich diet was supplemented with proteins from broad beans and occasionally with fruits, nuts, or animal food products. Due to these traditional dietary habits, all ancient miners up to the Baroque period have gut microbiome structures akin to modern non-Westernized individuals whose diets are also mainly composed of unprocessed foods and fresh fruits and vegetables. This may indicate a shift in the gut community composition of modern Westernized populations due to quite recent dietary and lifestyle changes. When we extended our microbial survey to fungi present in the paleofeces, in one of the Iron Age samples, we observed a high abundance of Penicillium roqueforti and Saccharomyces cerevisiae DNA. Genome-wide analysis indicates that both fungi were involved in food fermentation and provides the first molecular evidence for blue cheese and beer consumption in Iron Age Europe.

Keywords: Hallstatt; beer; cheese; diet; fermented food; microbiome; paleofeces; protohistory; salt mine.


Conflict of interest statement

Declaration of interests The authors declare no competing interests.

Figures

None
Graphical abstract
Figure 1
Figure 1
The Hallstatt salt mine and radiocarbon-dated paleofeces samples used in this study (A) The salt mines are located in Upper Austria. (B) Finding sites of the four paleofeces samples in the Bronze Age, Iron Age, and Baroque mining area. The symbol color corresponds to the radiocarbon date of the paleofeces. (C) Macroscopic appearance of the four paleofeces samples. The scale bar corresponds to 1 cm of length. The sample description includes the sample ID, the mine workings name, and the radiocarbon date. The provided radiocarbon date range corresponds to the Cal 2-sigma values with the highest probability. (D) Temporal assignment of the radiocarbon-dated paleofeces to the major European time periods from the Bronze Age onward. See also Figure S1 for details of the salt crystals surrounding sample 2612. Data S1A and S1B provide additional information about the samples and the radiocarbon dating.
Figure 2
Figure 2
Overview of microbial composition and metabolic pathways of paleofeces samples in comparison to a large collection of contemporary metagenomes (A) Principal coordinate analysis (PCoA) based on microbial abundance profiled using MetaPhlAn 3.0 between four paleofeces samples and 823 contemporary samples characterized by sampling environment, body site, and non-Westernized lifestyle. (B) Principal coordinate analysis (PCoA) based on metabolic pathway abundance profiled using HUMAnN 3.0 between four paleofeces samples and the same contemporary samples used in (A). (C) Prevalence of the top 15 most enriched species of four paleofeces samples in non-Westernized and Westernized datasets comprising 8,968 stool samples from healthy adult individuals. Asterisk indicates species that is likely from external contamination. (D) Relative abundance of P. copri four clades estimated using MetaPhlAn 3.0 in each paleofecal sample. See also Figure S1 for additional microbial profiles in the DNA “wash-out” experiment. Data S1 contains additional information about the comparative datasets and the results obtained by the prevalence and abundance analysis.
Figure 3
Figure 3
Microscopic and molecular dietary analysis of the Hallstatt paleofeces (A) Plant macro-remains microscopically detected in the four paleofeces samples. The scale bar indicates 1 mm of length. The heatmap shows the log-scale macro-remain counts normalized to 3.7 g sample. The sample with asterisk was assessed in a semiquantitative manner. For further details, please refer to Data S1. (B) Most abundant taxa (plants, nematodes, animals, fungi) detected in the four paleofeces metagenomes and proteomes. The circle size and circle color correspond to log10 “normalized” number of reads per million at genus and species levels, respectively. The asterisks in the proteome heatmap mean the peptides were assigned only to genus level. (C) Phylogenetic assignment of two partial Triticum chloroplast genomes in the 2604 and 2610 metagenomes. The comparative dataset included complete chloroplast genomes of selected members of the Triticeae tribe (NCBI accession numbers are provided in the figure). The tree was calculated using the maximum-likelihood algorithm (PhyML) based on 136,160 informative positions. Black circles symbolize parsimony and neighbor joining bootstrap support (>90%) based on 100 and 1,000 iterations, respectively. The scale bar indicates 10% estimated sequence divergence. (D) Wheat subgenome (A, B, and D) representation in the 2604 and 2610 metagenomes (Data S1), aligned to the modern hexaploid bread wheat reference genome (accession number GCA_900519105). Both the wheat chloroplast and nuclear reads were highly fragmented and display aDNA-specific damage patterns (Figures S3H–S3K). See also Figure S3 for details about the comparative analysis, phylogenetic assignment, and damage pattern of selected plant, animal, and parasite DNA. Data S1 provides further details of the macro-remains, comparative datasets, dietary DNA, and mapping statistics. Data S2 provides additional information about the comparative datasets and proteomics results.
Figure 4
Figure 4
Genome-wide SNP analysis of ancient fungal “strains” versus modern industrial and wild/environmental strains (A) Maximum likelihood (ML) phylogenetic analysis of the Penicillium roqueforti genome assembled from the sample 2604 in addition to other previously published P. roqueforti genomes. A total number of 120,359 SNP positions were used for the analysis. P. roqueforti FM164 was used as a reference, while P. carneum and P. psychrosexualis were used as outgroups. The scale bar depicts 0.1 substitutions per residue. Colored strips indicate the P. roqueforti population as previously inferred. For further information on the comparison dataset, please refer to Data S1Q. (B) Population structure analysis of P. roqueforti 2604 with the same previous dataset, considering 3 ancestries (K = 3 with lowest cross-validation error), based on 120,337 SNPs. The order of labels corresponds to the clustering in panel (A). (C) Wooden containers that have been found among other archeological findings in the mines and assumed to be used as cheese strainers (D) ML phylogenetic analysis of Saccharomyces cerevisiae genome assembled from the sample 2604 compared with other published S. cerevisiae genomes. The dataset for the analysis included 375,629 SNPs. The Saccharomyces paradoxus CBS432 was used as an outgroup. The scale bar depicts 0.1 substitutions per residue. The colored strips indicate the clade/origin as reported previously. The colored dots at the tree edges refer to the presence/absence of functional marker genes. Blue dots in (A) and (C) indicate bootstrap support >80% based on 1,000 bootstrap replicates. (E) Principal component analysis based on 136,712 SNP, of the S. cerevisiae strains. For additional information on the coverage and SNP density, DNA damage, and ADMIXTURE, please refer to Figure S4. Data S1 provides further details about the comparative datasets, mapping results, and functional marker analysis.

References

    1. Fry G. In: Gilbert R.J., Mielke J., editors. Academic Press; 1985. Analysis of fecal material; pp. 127–154. (The Analysis of Prehistoric Diets).
    1. Shillito L.-M., Blong J.C., Green E.J., van Asperen E.N. The what, how and why of archaeological coprolite analysis. Earth Sci. Rev. 2020;207:103196.
    1. Gilbert M.T.P., Jenkins D.L., Götherstrom A., Naveran N., Sanchez J.J., Hofreiter M., Thomsen P.F., Binladen J., Higham T.F.G., Yohe R.M., 2nd, et al. DNA from pre-Clovis human coprolites in Oregon, North America. Science. 2008;320:786–789. - PubMed
    1. Maixner F., Turaev D., Cazenave-Gassiot A., Janko M., Krause-Kyora B., Hoopmann M.R., Kusebauch U., Sartain M., Guerriero G., O’Sullivan N., et al. The iceman’s last meal consisted of fat, wild meat, and cereals. Curr. Biol. 2018;28:2348–2355.e9. - PMC - PubMed
    1. Poinar H.N., Kuch M., Sobolik K.D., Barnes I., Stankiewicz A.B., Kuder T., Spaulding W.G., Bryant V.M., Cooper A., Pääbo S. A molecular analysis of dietary diversity for three archaic Native Americans. Proc. Natl. Acad. Sci. USA. 2001;98:4317–4322. - PMC - PubMed

Publication types