. 2021 Dec 15:479:70-90.
doi: 10.1016/j.neuroscience.2021.10.007. Epub 2021 Oct 11.

Estrogen-related Receptor Alpha (ERRα) is Required for PGC-1α-dependent Gene Expression in the Mouse Brain

Affiliations

Estrogen-related Receptor Alpha (ERRα) is Required for PGC-1α-dependent Gene Expression in the Mouse Brain

L J McMeekin et al. Neuroscience. .

Erratum in

Abstract

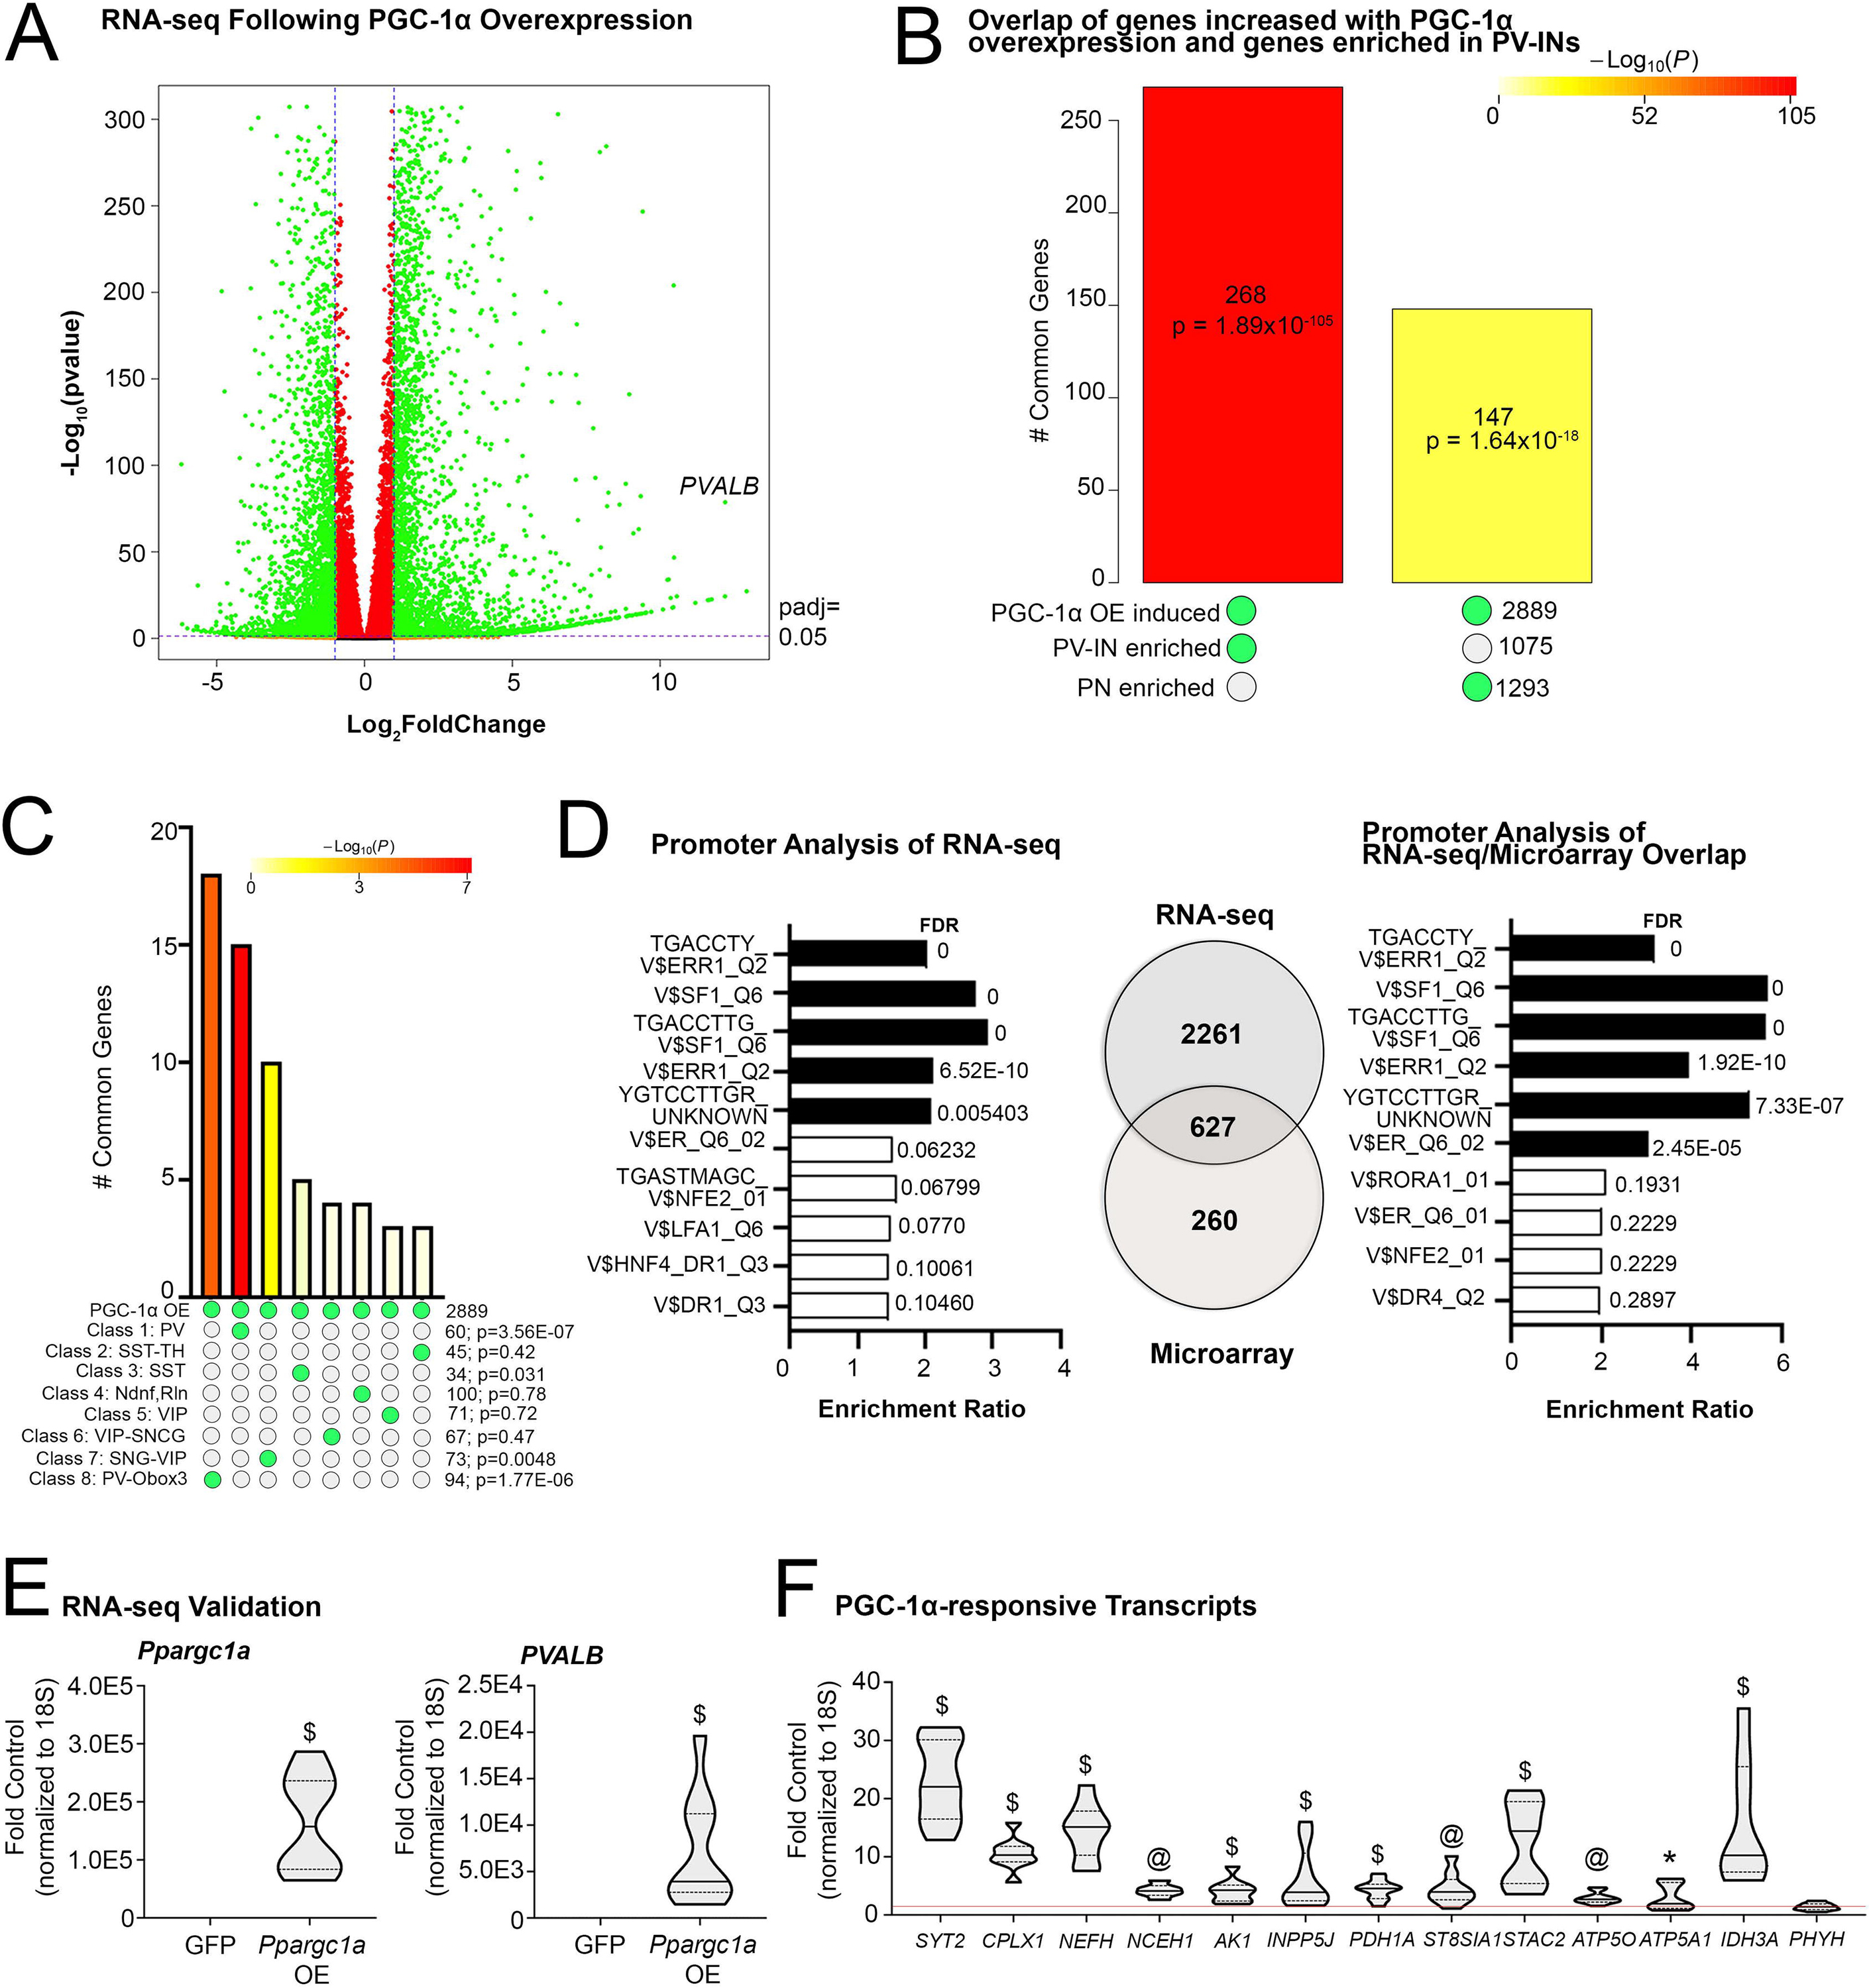
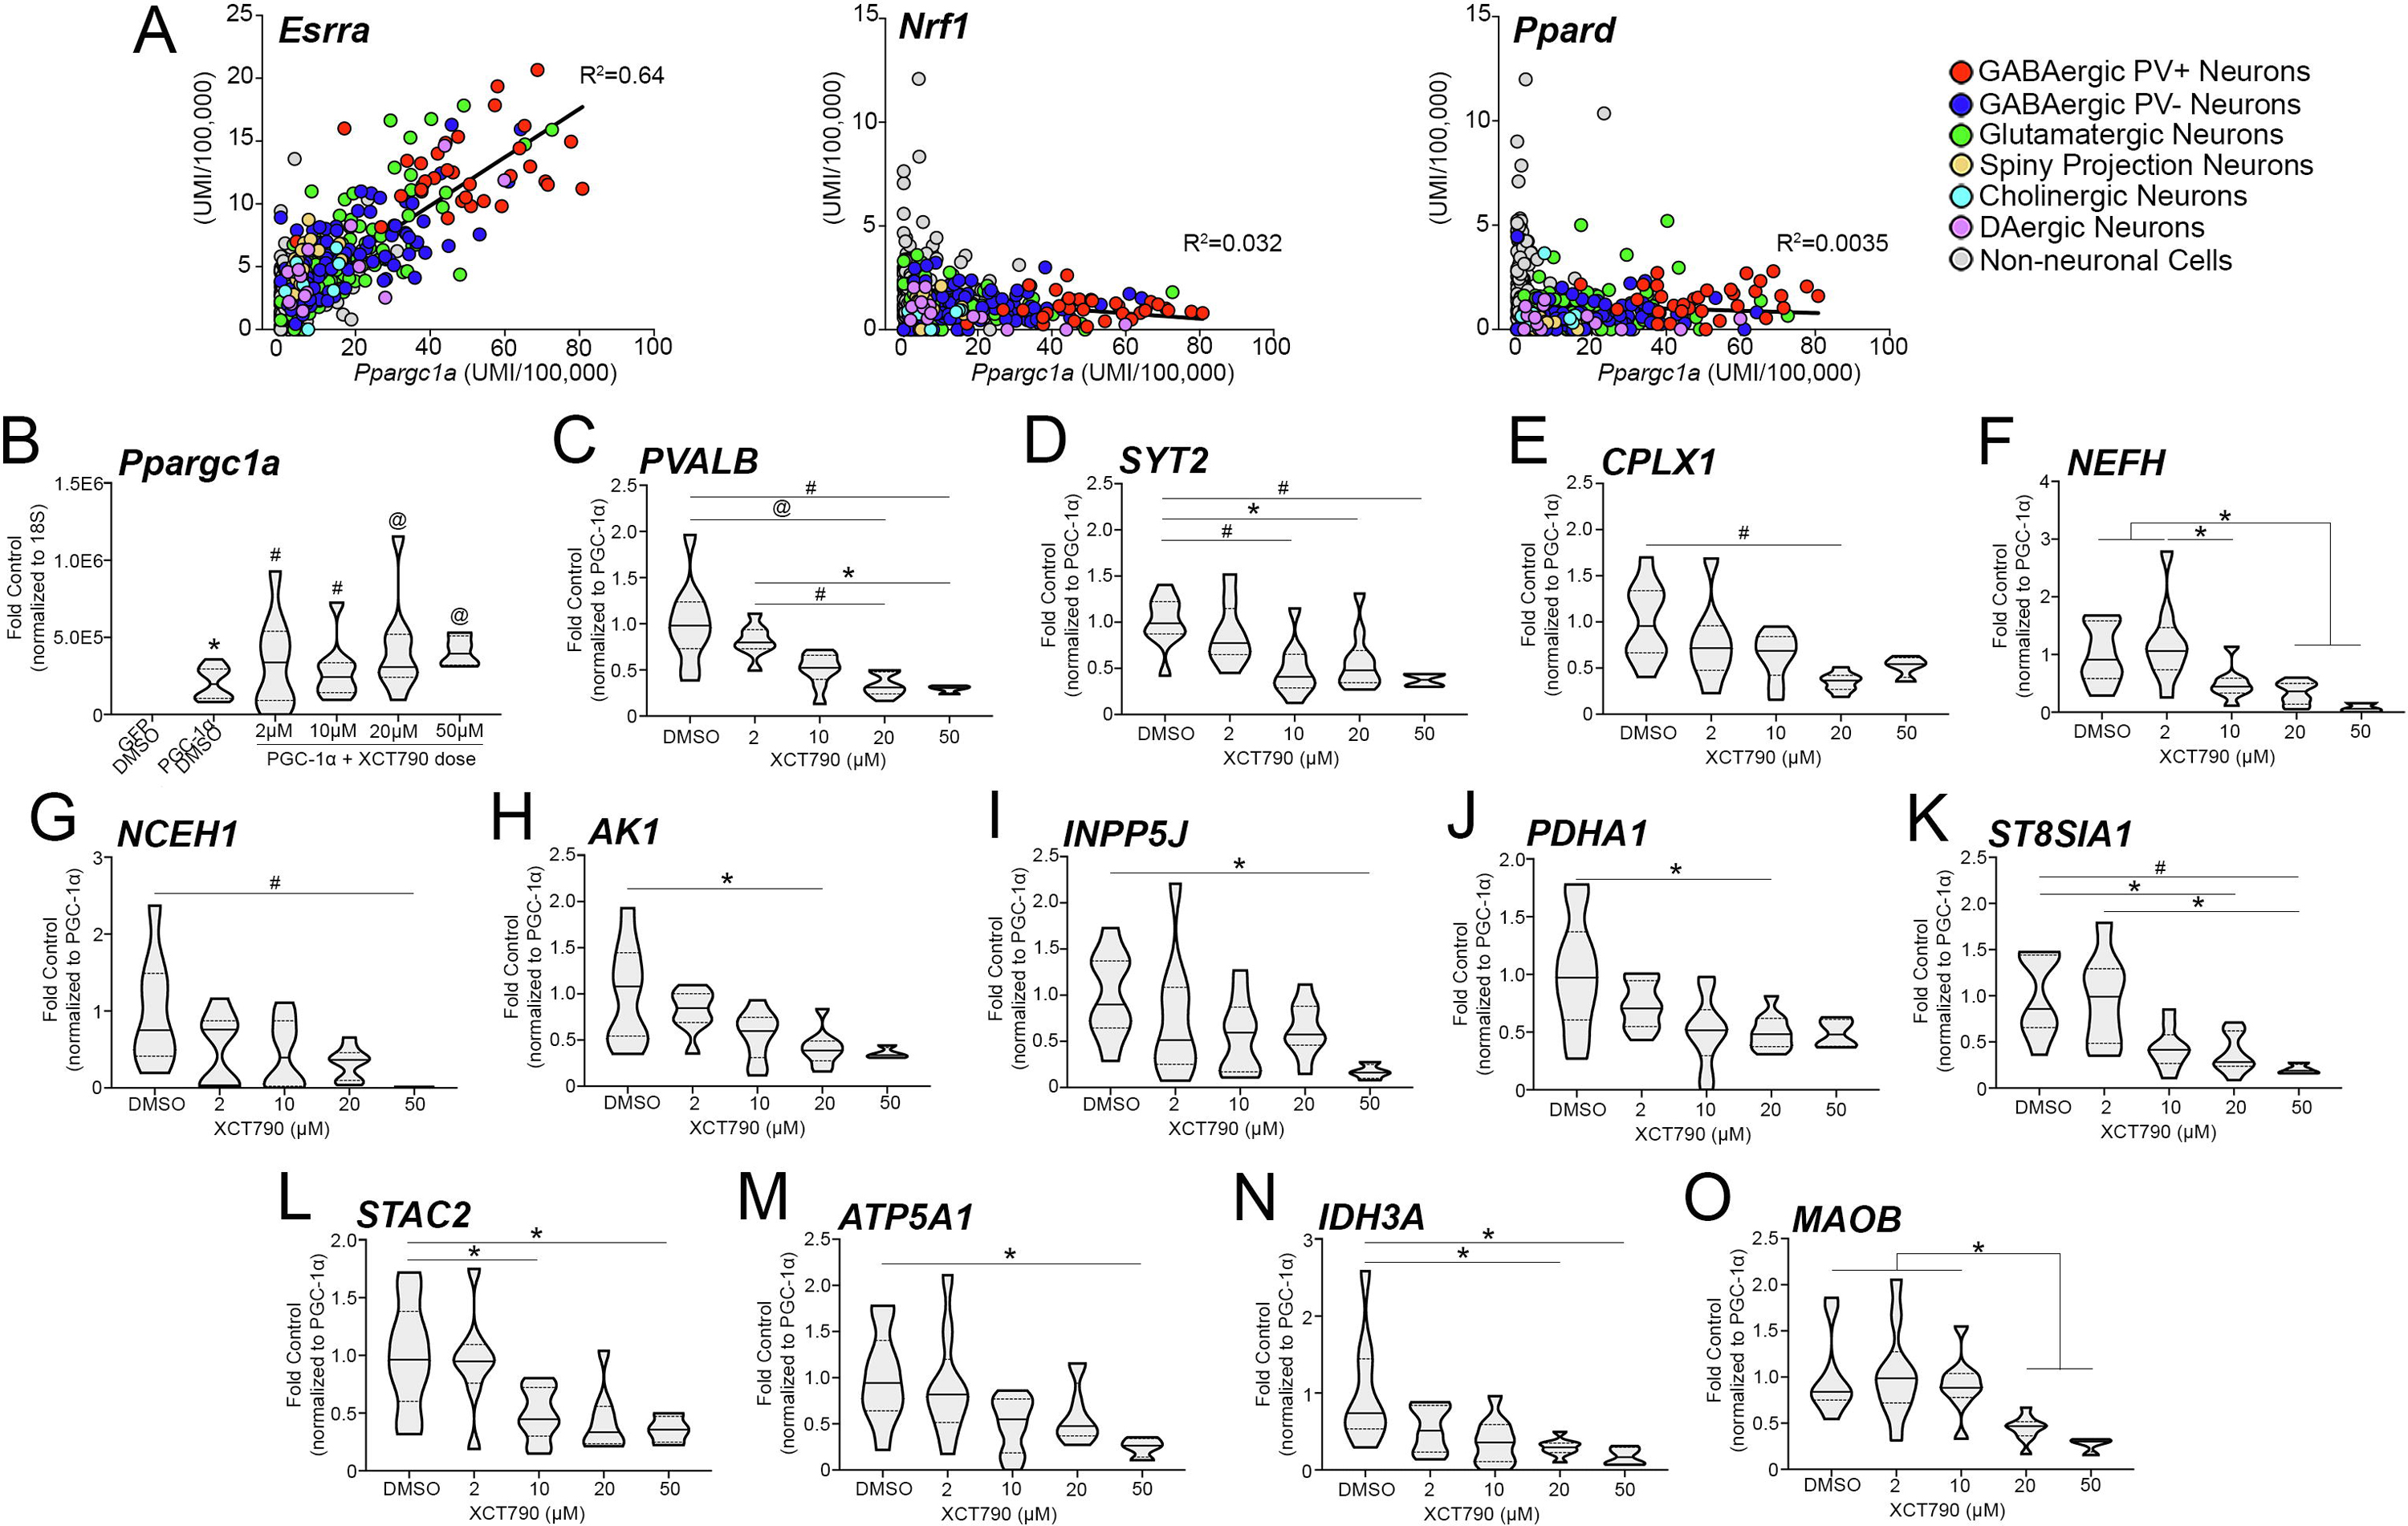
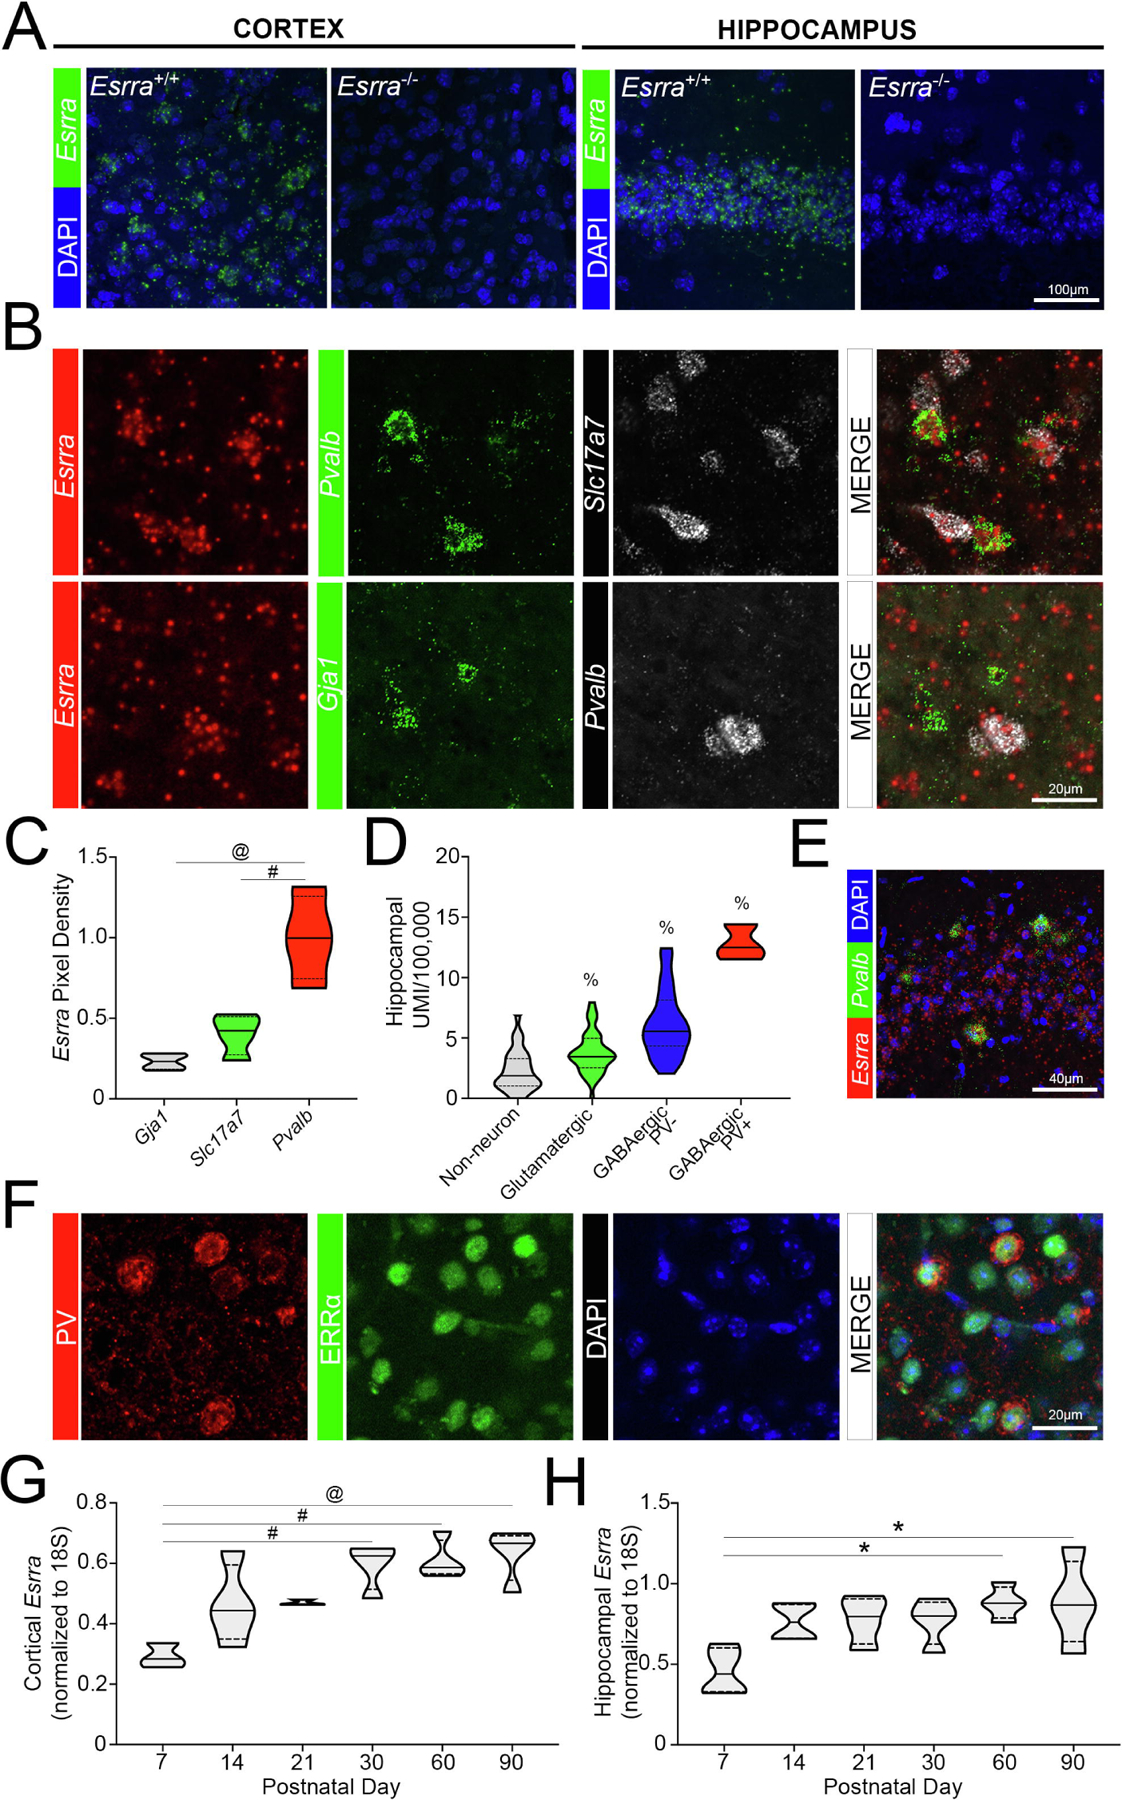
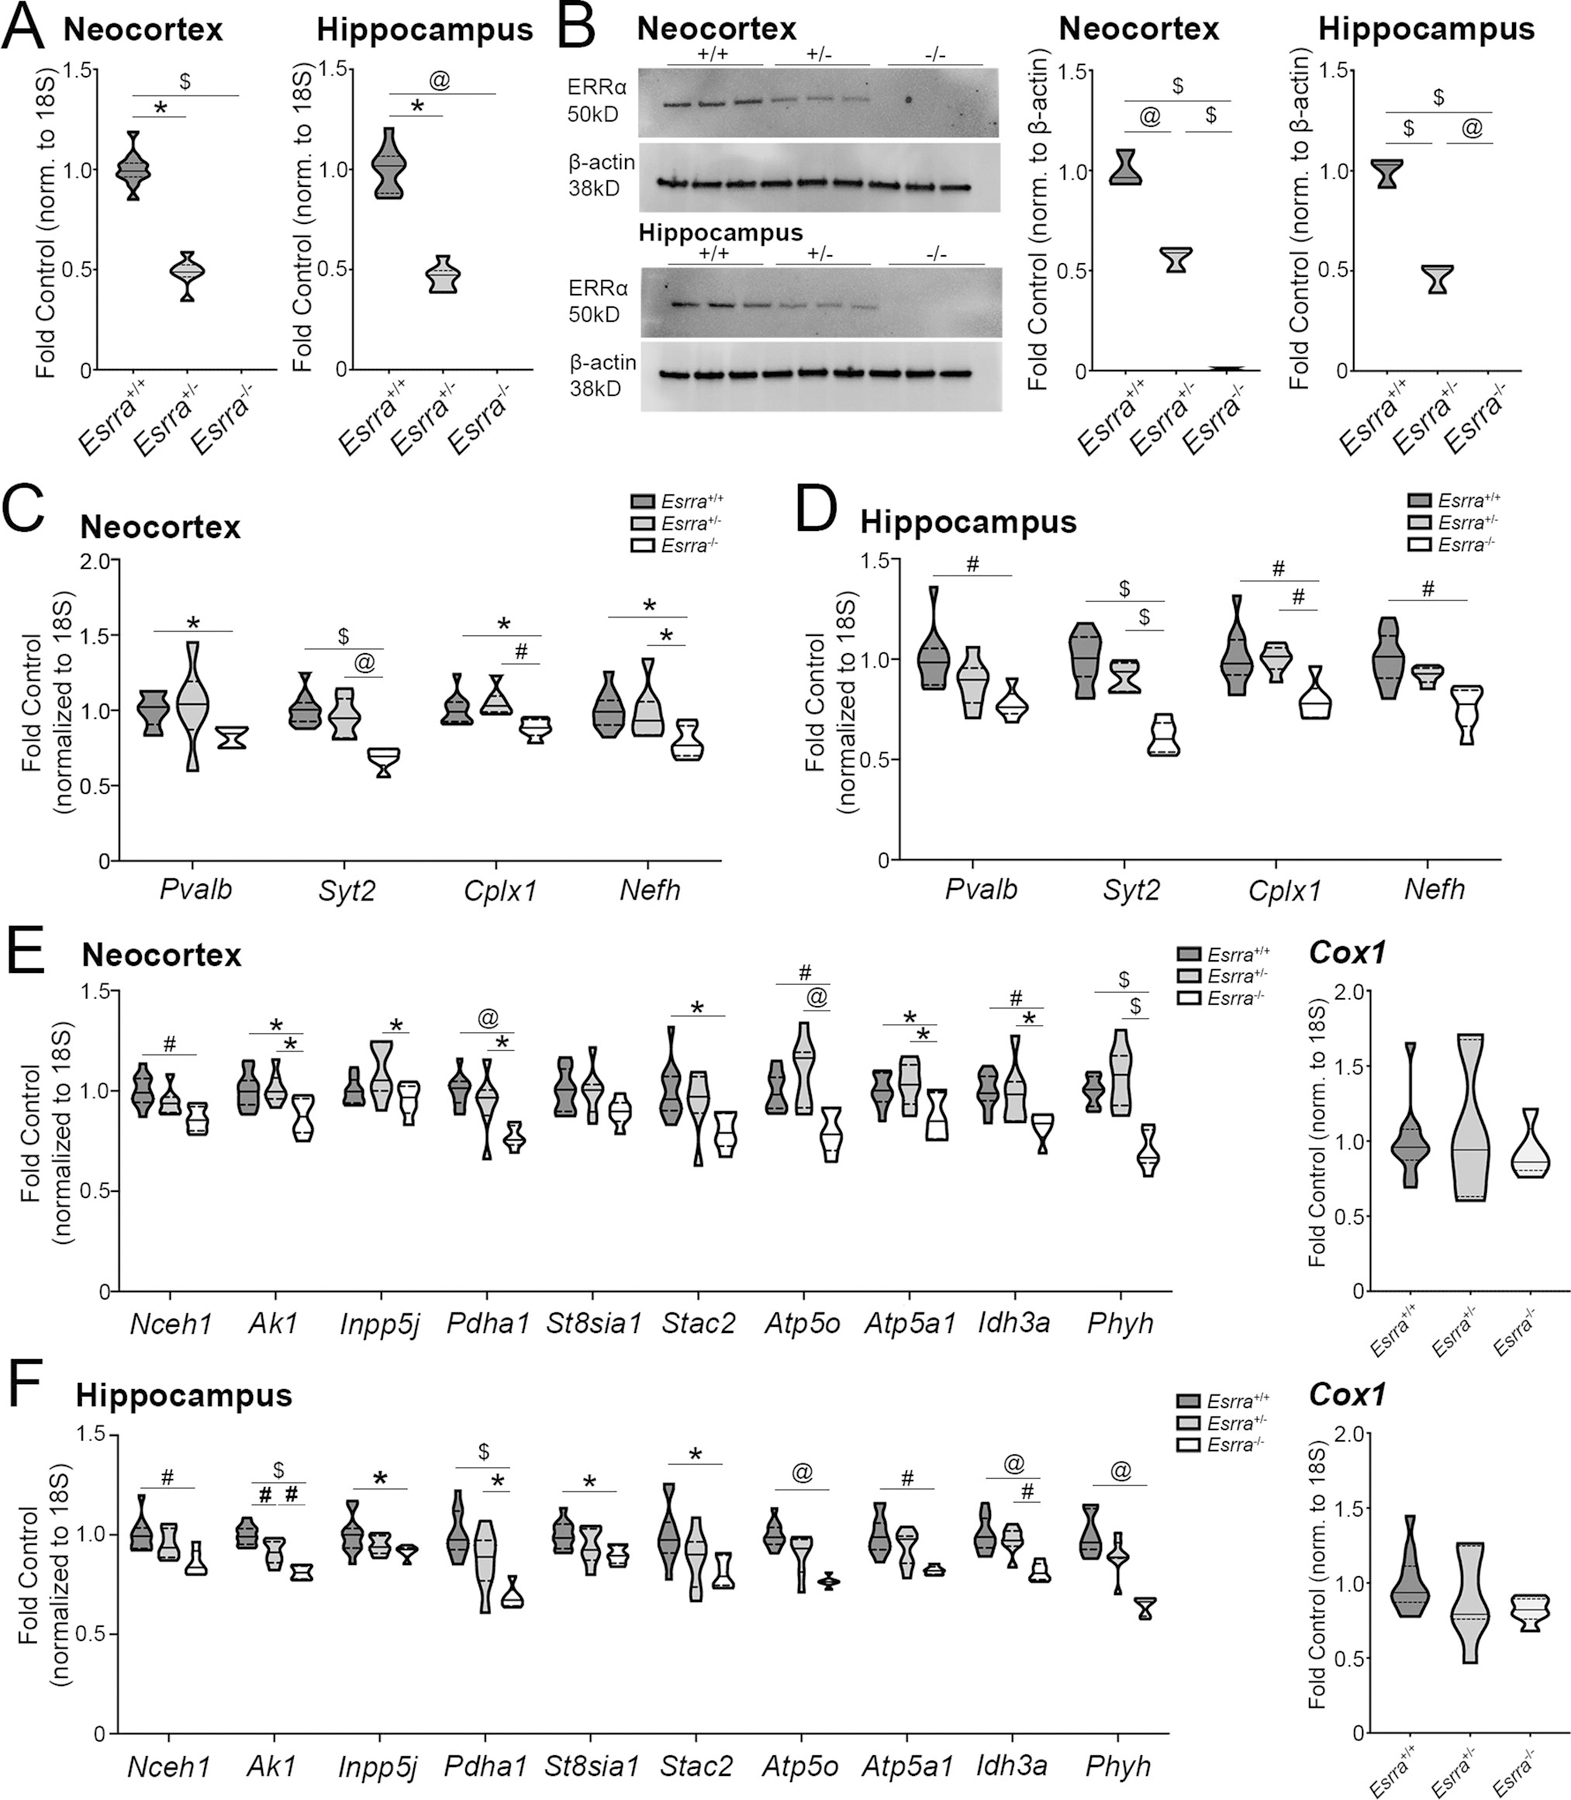
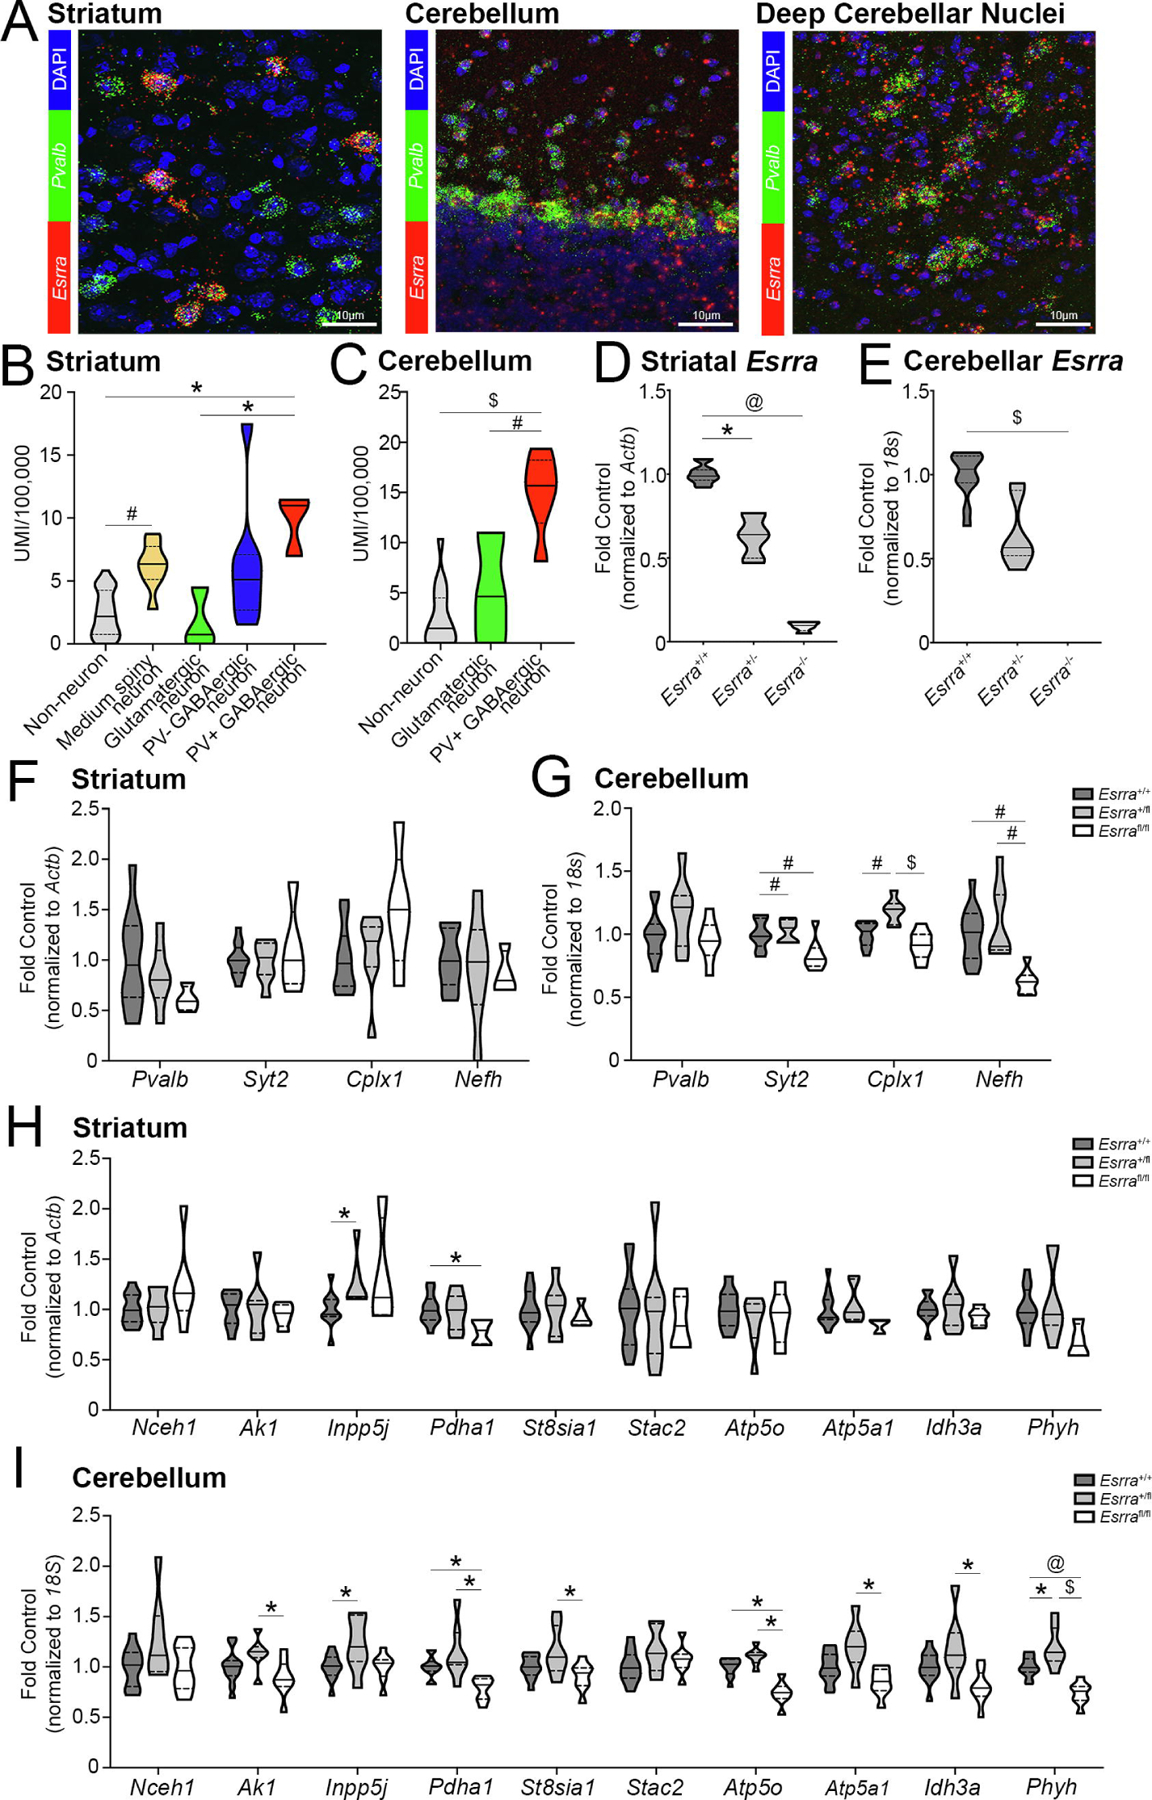
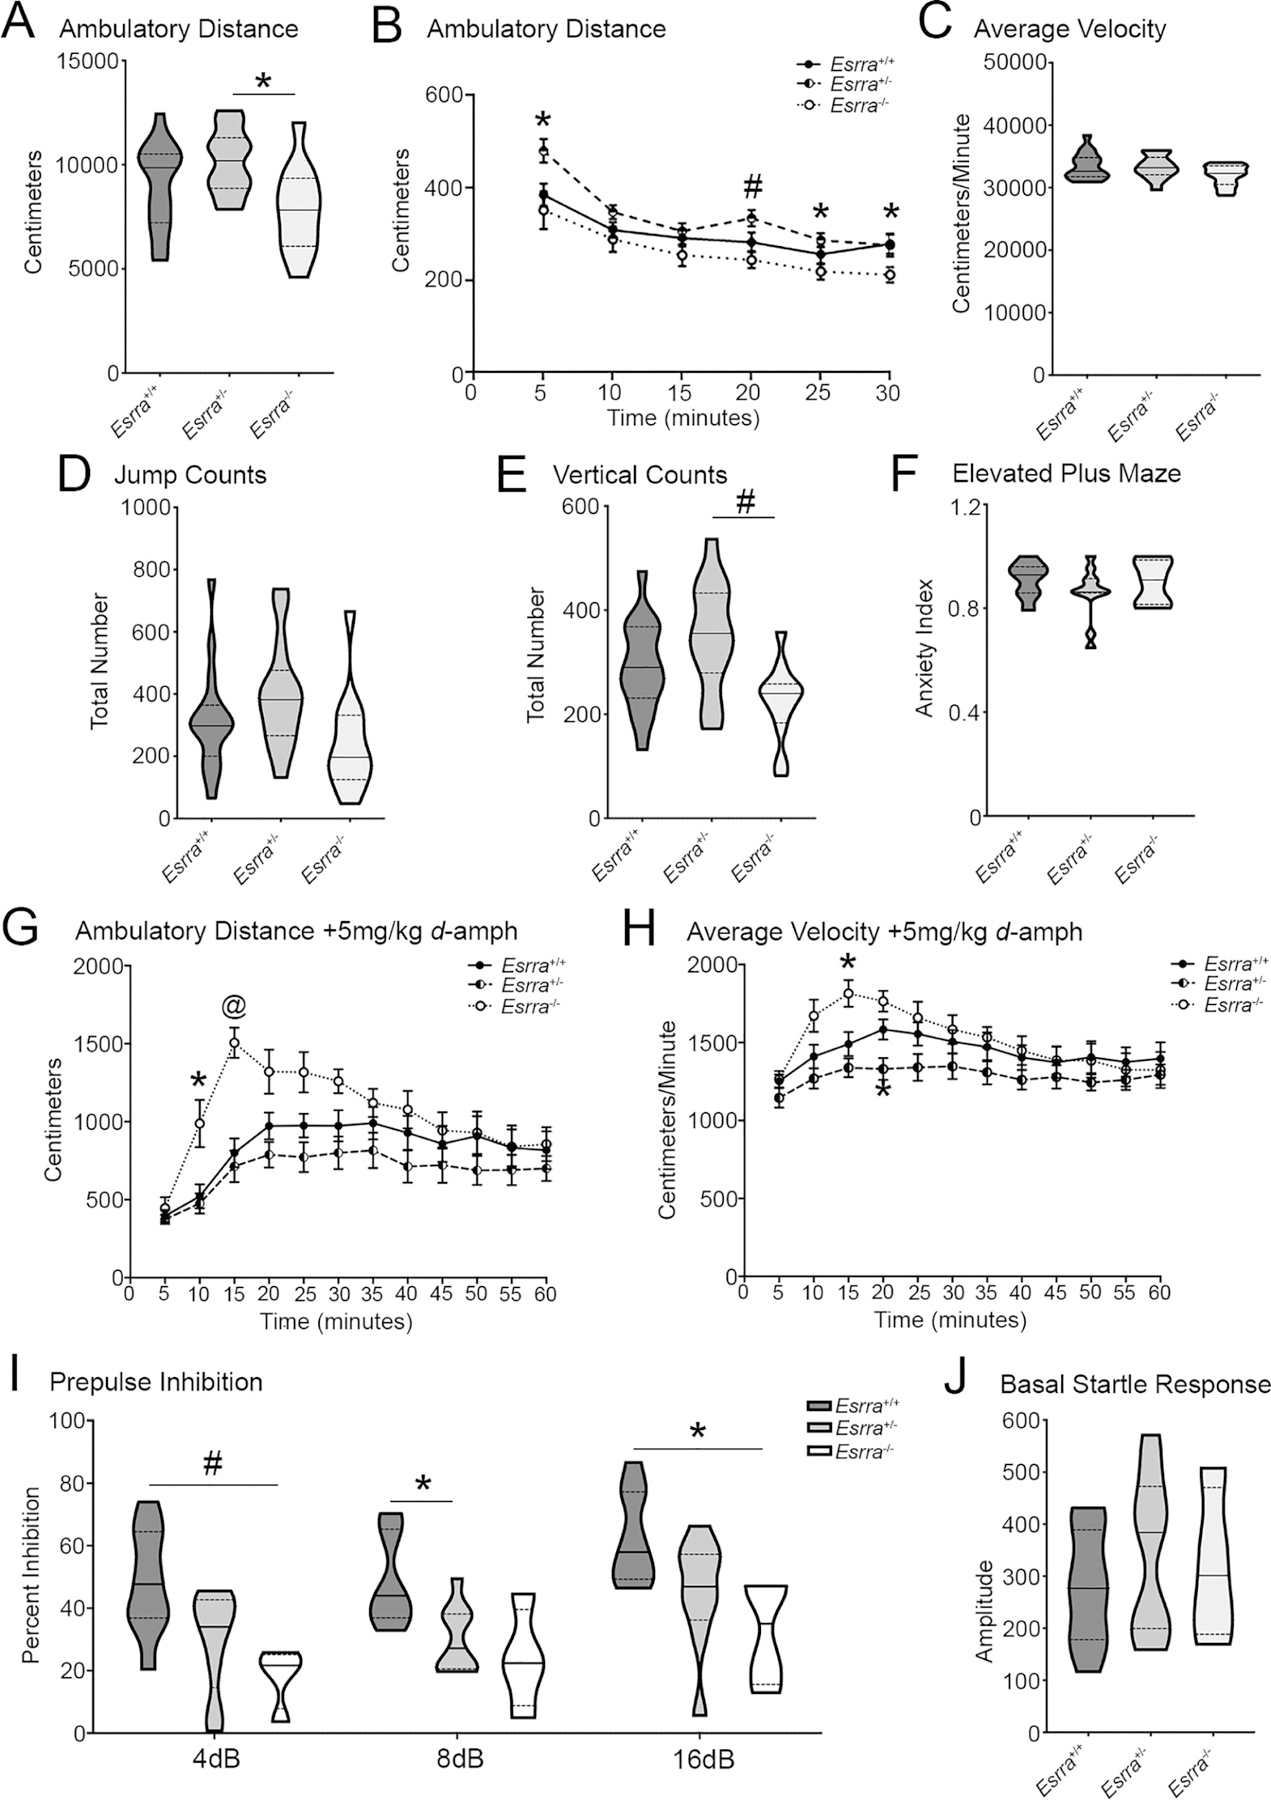
Deficiency in peroxisome proliferator-activated receptor gamma coactivator 1-alpha. (PGC-1α) expression or function is implicated in numerous neurological and psychiatric disorders. PGC-1α is required for the expression of genes involved in synchronous neurotransmitter release, axonal integrity, and metabolism, especially in parvalbumin-positive interneurons. As a transcriptional coactivator, PGC-1α requires transcription factors to specify cell-type-specific gene programs; while much is known about these factors in peripheral tissues, it is unclear if PGC-1α utilizes these same factors in neurons. Here, we identified putative transcription factors controlling PGC-1α-dependent gene expression in the brain using bioinformatics and then validated the role of the top candidate in a knockout mouse model. We transcriptionally profiled cells overexpressing PGC-1α and searched for over-represented binding motifs in the promoters of upregulated genes. Binding sites of the estrogen-related receptor (ERR) family of transcription factors were enriched, and blockade of ERRα attenuated PGC-1α-mediated induction of mitochondrial and synaptic genes in cell culture. Localization in the mouse brain revealed enrichment of ERRα expression in parvalbumin-expressing neurons with tight correlation of expression with PGC-1α across brain regions. In ERRα null mice, PGC-1α-dependent genes were reduced in multiple regions, including neocortex, hippocampus, and cerebellum, though not to the extent observed in PGC-1α null mice. Behavioral assessment revealed ambulatory hyperactivity in response to amphetamine and impairments in sensorimotor gating without the overt motor impairment characteristic of PGC-1α null mice. These data suggest that ERRα is required for normal levels of expression of PGC-1α-dependent genes in neurons but that additional factors may be involved in their regulation.

Keywords: ERRα; PGC-1α; interneurons; parvalbumin; transcription.


Conflict of interest statement

Conflicts of Interest: None

Figures

Fig. 1.
Fig. 1.
Transcriptional profiling of cells overexpressing PGC-1α reveals similarity to PV-IN profiles and identifies enriched transcription factor binding sequences in responsive genes. (A) RNA sequencing identified transcripts up- and down-regulated following AdV-CMV-Ppargc1a-ires-GFP (PGC-1αOE) or AdV-CMV-GFP (GFP) treatment of SH-SY5Y neuroblastoma cells. n = 3/group. (B) SuperExactTest of overlap between genes induced with PGC-1αOE in SH-SY5Y cells compared to genes enriched in either PV-INs or PNs (Mo et al., 2015). (C) SuperExactTest of overlap between genes induced with PGC-1αOE in SH-SY5Y cells with those enriched in eight distinct GABAergic subclusters. (D) WebGestalt enrichment analysis of consensus binding sites in the promoters of identified transcripts upregulated by PGC-1α overexpression. There was an overlap of 627 genes between these RNA sequencing data and previously published microarray data (Lucas et al., 2014). WebGestalt enrichment analysis for these overlapping genes are shown. (E) Ppargc1a and Pvalb transcript in samples treated with DMSO and either AdV-CMV-Ppargc1a-ires-GFP (PGC-1αOE) or AdV-CMV-GFP (GFP) to confirm overexpression. (F) Previously identified PGC-1α-responsive transcripts in the DMSO and PGC-1αOE as fold control. *p ≤ 0.05, @p ≤ 0.001, $p ≤ 0.0001.
Figure 2.
Figure 2.. Inverse agonist of ERRα attenuates the induction of PGC-1α-responsive transcripts.
(A) Correlation of Esrra, Nrf1, and Ppard transcript abundance across neuronal and non-neuronal populations throughout the brain with that of Ppargc1a (Dropviz.org; n=231 non-neuronal, n=152 glutamatergic, n=88 PV GABAergic, n=33 PV+ GABAergic, n=16 medium spiny neuron, n=7+ cholinergic, n=13 DAergic). (B) Significantly increased Ppargc1a transcript levels in DMSO and XCT790-treated SH-SY5Ys following PGC-1αOE compared with samples treated with DMSO and AdV-CMV-GFP. (C-F) Transcript for neuronally enriched genes PVALB, SYT2, CPLX1, and NEFH in the presence of both PGC-1αOE and increasing dose of XCT790. The expression of ubiquitous (G-M) and previously demonstrated direct targets of ERRα (N, O) was also measured. DMSO, n=8–10; 2 μM, n=8–10; 10 μM, n=8–10; 20 μM, n=8–10; 50 μM, n=3–4 XCT790. *p≤0.05, #p≤0.01, @p≤0.001, $p≤0.0001. Median is represented by the solid line, upper and lower quartiles are represented by dotted lines.
Figure 3.
Figure 3.. Enrichment of Esrra in parvalbumin-expressing neuronal populations.
(A) Validation of SM-FISH probe in Esrra+/+ and Esrra−/− cortex and hippocampus (n=2 sections/mouse; 2 mice/genotype). (B) Distribution of Esrra transcript using SM-FISH in Pvalb+, Slc17a7+, and Gja1+ populations in the cortex of wildtype mice (n=3 sections/mouse, 2 images/section, n=4 mice; n=1147–2006 Slc17a7+ cells/mouse, n=42–130 Pvalb+ cells/mouse, n=60–149 Gja1+ cells/mouse). These data are quantified in (C) using ImageJ. (D) Localization data of Esrra obtained from Dropviz.org for hippocampus (n=3 PV+ GABAergic neurons, n=23 PV GABAergic neurons, n=43 glutamatergic neurons, n=32 non-neuronal cells) and (E) represented by SM-FISH in wildtype (n=3 sections/mouse, 3 mice). (F) Confocal microscopy showing colocalization of ERRα protein and PV in murine cortex (n=3 mice). (G, H) Expression of Esrra in the wildtype cortex and hippocampus across age (n=3–4/group). *p≤0.05, #p≤0.01, @p≤0.001, $p≤0.0001, % indicates a significant difference from all other groups. Median is represented by the solid line, upper and lower quartiles are represented by dotted lines.
Figure 4.
Figure 4.. Mice lacking ERRα show a reduction in expression of PGC-1α-responsive transcripts in neocortex and hippocampus.
(A) Esrra transcript in Esrra+/+, Esrra+/−, and Esrra−/− cortex (n=11 Esrra+/+, 6–7 Esrra+/−, 6 Esrra−/−) and hippocampus (n=10–11 Esrra+/+, 7 Esrra+/−, 5–6 Esrra−/−). (B) Western blot and quantification of ERRα protein in cortex and hippocampus (n=3/genotype/region), with normalization to actin protein on the same membrane. (C, D) Expression of PGC-1α-responsive neuronal transcripts in the Esrra+/+, Esrra+/−, and Esrra−/− cortex and hippocampus. (E, F) Expression of remaining PGC-1α-responsive transcripts in cortex and hippocampus, including Cox1. *p≤0.05, #p≤0.01, @p≤0.001, $p≤0.0001. Median is represented by the solid line, upper and lower quartiles are represented by dotted lines.
Figure 5.
Figure 5.. ERRα is required for the expression of a subset of PGC-1α-responsive transcripts in the striatum and cerebellum.
(A) Localization of Esrra by SM-FISH in the striatum, cerebellum and deep cerebellar nuclei. N=3 sections/mouse, 3 mice total. UMI enrichment for Esrra in the (B) striatum (n=3 PV+ GABAergic neurons, n=8 PV GABAergic neurons, n=3 glutamatergic neurons, n=8 medium spiny neurons, n=27 non-neuronal populations) and (C) cerebellum (n=6 PV+, n=3 glutamatergic, and n=15 non-neuronal populations) obtained from dropviz.org. (D, E) Esrra transcript in Esrra+/+, Esrra+/−, and Esrra−/− striatum and cerebellum. Expression of PGC-1α-responsive transcripts in the Esrra+/+, Esrra+/−, and Esrra−/− (F, H) striatum and (G, I) cerebellum. Striatum: n=9–12 Esrra+/+, 6–7 Esrra+/−, 3–6 Esrra−/−. Cerebellum: n=12 Esrra+/+, 7 Esrra+/−, 7–8 Esrra−/−. *p≤0.05, #p≤0.01, @p≤0.001, $p≤0.0001. Median is represented by the solid line, upper and lower quartiles are represented by dotted lines.
Figure 6.
Figure 6.. ERRα null mice show hyperactivity in response to amphetamine and deficits in sensory motor gating.
(A) Overall ambulatory distance and (B) across time, (C) average velocity, (D) jump counts, (E) and vertical counts in open field for Esrra+/+, Esrra+/−, and Esrra−/− mice. (n=17 Esrra+/+, n=14 Esrra+/−, n=12 Esrra−/−). (F) Anxiety index in elevated plus maze. (n=8 Esrra+/+, n=11 Esrra+/−, n=5 Esrra−/−). (G) Ambulatory distance and (H) average velocity in open field following intraperitoneal injection of 5mg/kg d-amphetamine. (n=10 Esrra+/+, n=9 Esrra+/−, n=7 Esrra−/−). (I) Prepulse inhibition (N=4–9/genotype) and (J) baseline startle response (n=9 Esrra+/+, n=9 Esrra+/−, n=4 Esrra−/−). (K, L) Maoa and Maob transcript in cortex, hippocampus, striatum, midbrain and cerebellum. (see previous regional data for samples sizes). *p≤0.05, #p≤0.01, @p≤0.001. Violin plots show median represented by the solid line, upper and lower quartiles are represented by dotted lines. Line graphs show mean ± SEM.

References

    1. Zhang Y, Huypens P, Adamson AW, Chang JS, Henagan TM, Boudreau A, et al. Alternative mRNA splicing produces a novel biologically active short isoform of PGC-1alpha. J Biol Chem 2009. Nov 20;284(47):32813–32826. - PMC - PubMed
    1. Knutti D, Kralli A. PGC-1, a versatile coactivator. Trends Endocrinol Metab 2001. Oct;12(8):360–365. - PubMed
    1. Finck BN, Kelly DP. PGC-1 coactivators: inducible regulators of energy metabolism in health and disease. J Clin Invest 2006. Mar;116(3):615–622. - PMC - PubMed
    1. McMeekin LJ, Fox SN, Boas SM, Cowell RM. Dysregulation of PGC-1α-Dependent Transcriptional Programs in Neurological and Developmental Disorders: Therapeutic Challenges and Opportunities. Cells 2021. Feb 9;10(2). - PMC - PubMed
    1. Dougherty SE, Bartley AF, Lucas EK, Hablitz JJ, Dobrunz LE, Cowell RM. Mice lacking the transcriptional coactivator PGC-1α exhibit alterations in inhibitory synaptic transmission in the motor cortex. Neuroscience 2014. Jun 20;271:137–148. - PMC - PubMed

Publication types

MeSH terms

Substances