Observational Study
. 2021 Oct:72:103615.
doi: 10.1016/j.ebiom.2021.103615. Epub 2021 Oct 11.

A poor and delayed anti-SARS-CoV2 IgG response is associated to severe COVID-19 in children

Affiliations
Observational Study

A poor and delayed anti-SARS-CoV2 IgG response is associated to severe COVID-19 in children

Inés Sananez et al. EBioMedicine. 2021 Oct.

Abstract

Background: Most children and youth develop mild or asymptomatic disease during severe acute respiratory syndrome coronavirus 2 (SARS-CoV-2) infection. However, a very small number of patients suffer severe Coronavirus induced disease 2019 (COVID-19). The reasons underlying these different outcomes remain unknown.

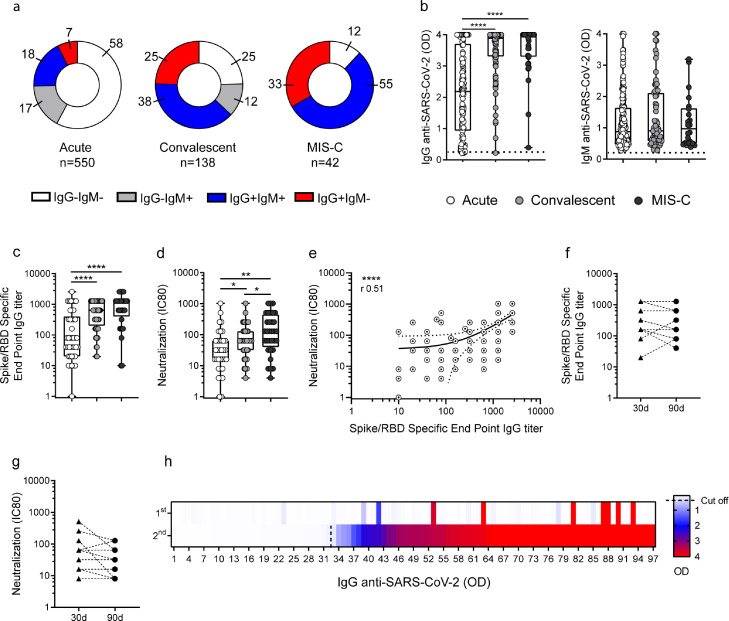
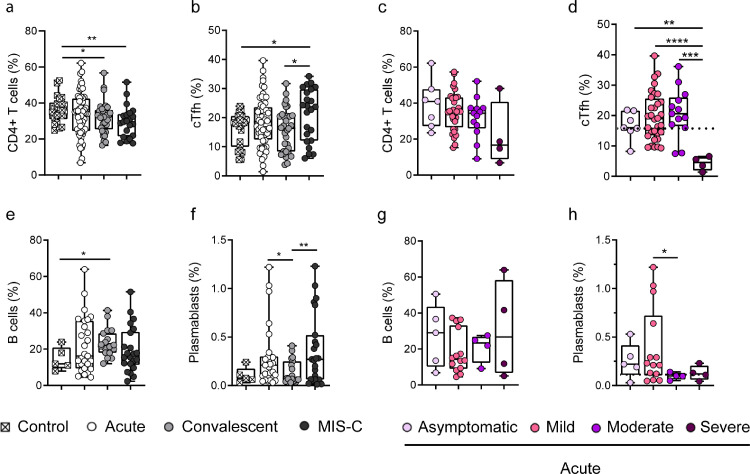
Methods: We analyzed three different cohorts: children with acute infection (n=550), convalescent children (n=138), and MIS-C (multisystem inflammatory syndrome in children, n=42). IgG and IgM antibodies to the spike protein of SARS-CoV-2, serum-neutralizing activity, plasma cytokine levels, and the frequency of circulating Follicular T helper cells (cTfh) and plasmablasts were analyzed by conventional methods.

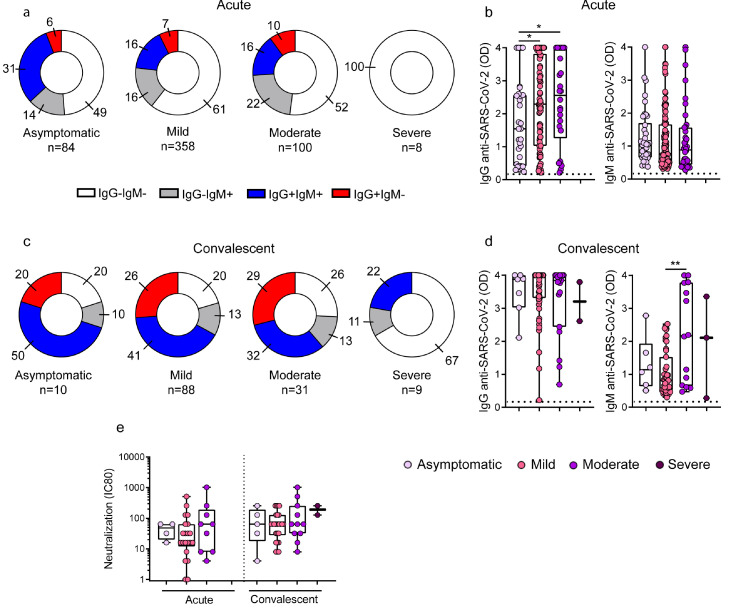
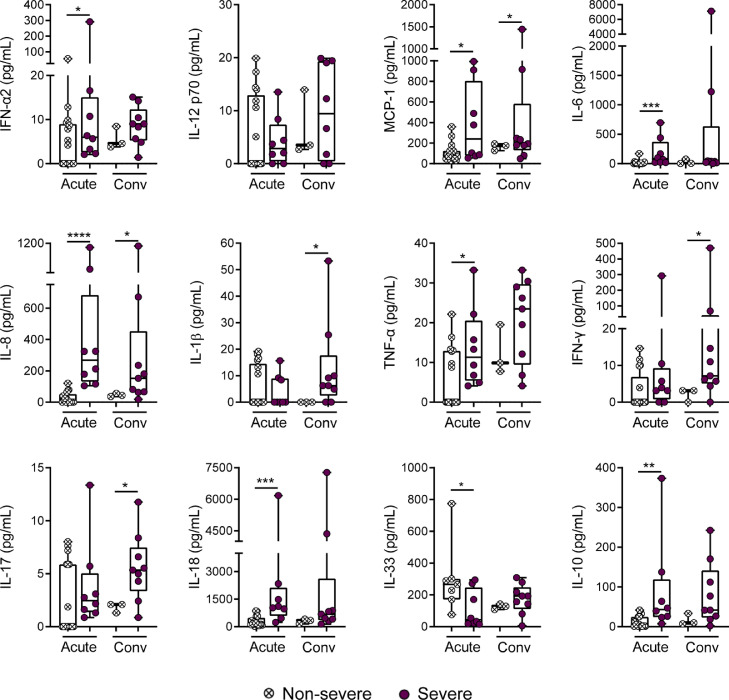
Findings: Fifty-eight percent of the children in the acute phase of infection had no detectable antibodies at the time of sampling while a seronegative status was found in 25% and 12% of convalescent and MIS-C children, respectively. When children in the acute phase of the infection were stratified according disease severity, we found that contrasting with the response of children with asymptomatic, mild and moderate disease, children with severe COVID-19 did not develop any detectable response. A defective antibody response was also observed in the convalescent cohort for children with severe disease at the time of admission. This poor antibody response was associated to both, a low frequency of cTfh and a high plasma concentration of inflammatory cytokines.

Interpretation: A weak and delayed kinetic of antibody response to SARS-CoV-2 together with a systemic pro-inflammatory profile characterize pediatric severe COVID-19. Because comorbidities are highly prevalent in children with severe COVID-19, further studies are needed to clarify their contribution in the weak antibody response observed in severe disease.

Funding: National Agency for Scientific and Technological Promotion from Argentina (IP-COVID-19-0277 and PMO-BID-PICT2018-2548).

Keywords: Disease severity, antibodies, T cells; Pediatric COVID-19.


Conflict of interest statement

Declaration of Competing Interest None.

Figures

Fig 1
Fig. 1
Antibody response against SARS-CoV-2 in children with COVID-19 and MIS-C. (a) Donuts graphs show the frequency of children in each cohort that produced IgG and/or IgM antibodies to the Spike/RBD protein of SARS-CoV-2. Pearson's Chi square test, p<0.0001. (b) Plasma levels of IgG and IgM antibodies directed to the Spike/RBD protein in SARS-CoV-2-seropositive children are shown (n=139 and n=191, n=87 and n=70, n=37 and n=23 for IgG and IgM levels in acute, convalescents and MIS-C, respectively). (c) IgG titers defined by end point dilution in SARS-CoV-2-seropositive children in the acute (n=43), convalescent (n=56) and MIS-C (n=32) cohorts. (d) Neutralization antibody titers determined by the reciprocal IC80 in SARS-CoV-2-seropositive children from the acute (n=34), convalescent (n=44) and MIS-C (n=32) cohorts. (e) Correlation between the titers of IgG antibodies to the Spike/RBD and the neutralizing titers of antibodies (n=110). (f-g) Titers of IgG antibodies to the Spike/RBD protein of SARS-CoV-2 and (f) neutralizing antibody titers (g) detected in 13 patients at 30 and 90 days post diagnostic. (h) Heat map of IgG antibodies directed to the Spike/RBD protein quantified in paired plasma samples from 97 children. Each cell represents an individual patient. The first sample was taken between 1-4 days after admission and the second was obtained between 4-6 weeks after admission. Red represents high and blue low antibody levels, as indicated on the right. Dotted line indicates the cut-off value in b. Median and min to max of n donors are shown in b-d. P values were determined by Pearson's Chi square test, Kruskal-Wallis test, Mann-Whitney U test and Spearman correlation test: * p<0.05, ** p<0.01, **** p<0.0001. Acute (white circle), Convalescent (light grey circle), MIS-C (dark grey circle).
Fig 2
Fig. 2
Antibody response against SARS-CoV-2 across the clinical spectrum of COVID-19 in the course of acute and convalescent phases of infection. (a-e) Children in the acute or convalescent phases of SARS-CoV-2 infection were grouped based on their diagnosis at hospital admission as asymptomatic, mild, moderate or severe. (a) Donuts graphs show the frequency of children that produced IgG and/or IgM antibodies to the Spike/RBD protein of SARS-CoV-2 in the course of acute infection. Pearson's Chi square test, p<0.05 (IgG+IgM+, asymptomatic vs mild; IgG-IgM-, asymptomatic vs severe). (b) Plasma levels of IgG and IgM antibodies directed to the Spike/RBD protein were measured in SARS-CoV-2-seropositive children during acute phase (n=31 and n=38, n=82 and n=115, n=26 and n=38 for IgG and IgM levels in asymptomatic, mild and moderates, respectively). (c) Donuts graphs show the frequency of children that produced IgG and/or IgM antibodies to the Spike/RBD protein of SARS-CoV-2 in the convalescent phase of the infection (IgG-IgM-, mild vs severe, p<0.05). (d) Plasma levels of IgG and IgM antibodies directed to the Spike/RBD protein were measured in SARS-CoV-2-seropositive children during the convalescent phase of the infection (n=7 and n=6, n=59 and n=47, n=19 and n=14, n=2 y n=3 for IgG and IgM levels in asymptomatic, mild, moderates and severe, respectively). (e) Neutralization antibody titers in the course of acute (asymptomatic, n=4; mild, n=21; and moderate, n=9) and convalescent phases (asymptomatic, n=5; mild, n=26; moderate, n=11 and severe, n=2) of the infection. Dotted line indicates the cut-off value in b and d. Median and min to max of n donors are shown in b, d, and e. P values were determined by Pearson's Chi square test or Fisher's exact test, Kruskal-Wallis test and Mann-Whitney U test: * p<0.05, ** p<0.01. Acute (white circle), Convalescent (light grey circle), MIS-C (dark grey circle). Asymptomatic (lilac circle), mild (pink circle), moderate (violet circle), severe (purple circle).
Fig 3
Fig. 3
Frequency of cTfh cells and plasmablasts in children with COVID-19 and MIS-C. (a-b) Frequency of CD4+ T cells (a) and cTfh (b) analyzed by flow cytometry in healthy children (n=22), children in the acute (n=56) and convalescent (n=33) phases of infection, and MIS-C (n=23). (c-d) Frequency of CD4+ T cells (c) and cTfh (d) in children with acute COVID-19 classified according to disease severity: asymptomatic, n=7; mild, n=32; moderate, n=13; severe, n=4. (e-f) Frequency of B cells (e) and plasmablasts (f) analyzed by flow cytometry in healthy children (n=5), children in the acute (n=27) and convalescent (n=19) phases of the infection, and MIS-C (n=23). (g-h) Frequency of B cells (g) and plasmablasts (h) during acute infection in children with COVID-19 classified according to disease severity: asymptomatic, n=5; mild, n=14; moderate, n=4; severe, n=4. Dotted line depicts the median values found in healthy controls. Median and min to max of n donors are shown. P values were determined by Mann-Whitney U test: * p<0.05, ** p<0.01, *** p<0.001, **** p<0.0001. Control (white square), Acute (white circle), Convalescent (light grey circle), MIS-C (dark grey circle). Asymptomatic (lilac circle), mild (pink circle), moderate (violet circle), severe (purple circle).
Fig 4
Fig. 4
Plasma levels of cytokines in children with non-severe and severe COVID-19. Plasma levels of IFN-α2, IL-12p70, MCP-1 (CCL2), IL-6, IL-8, IL-1β, TNF-α, IFN-γ, IL-17A, IL-18, IL-33, and IL-10 were quantified by multiplex flow cytometric bead array in the acute (non-severe, n=17; severe, n=8) and convalescent (non-severe, n=3; severe, n=9) phases of infection. Median and min to max of n donors are shown. P values were determined by Mann-Whitney U test: * p<0.05, ** p<0.01, *** p<0.001, **** p<0.0001. Non-severe (white circle), severe (purple circle).

References

    1. Liu W., Zhang Q., Chen J. Detection of Covid-19 in Children in Early January 2020 in Wuhan, China. New England J. Med. 2020;382(14):1370–1371. - PMC - PubMed
    1. Dong Y., Mo X., Hu Y. Epidemiology of COVID-19 among children in China. Pediatrics. 2020;145(6) - PubMed
    1. Lu X., Zhang L., Du H. SARS-CoV-2 infection in children. N Engl J Med. 2020;382(17):1663–1665. - PMC - PubMed
    1. Tagarro A., Garcia-Salido A., Martinez E.V., Vega-Piris L., Mellado M.J. Low COVID-19 mortality in Spanish children. Lancet Child Adolescent Health. 2021;5(6) e24-e5. - PMC - PubMed
    1. Consiglio C.R., Cotugno N., Sardh F. The immunology of multisystem inflammatory syndrome in children with COVID-19. Cell. 2020;183(4) 968-81 e7. - PMC - PubMed

Publication types

Supplementary concepts