

Multiday cycles of heart rate are associated with seizure likelihood: An observational cohort study
- PMID: 34649079
- PMCID: PMC8517288
- DOI: 10.1016/j.ebiom.2021.103619
Multiday cycles of heart rate are associated with seizure likelihood: An observational cohort study
Abstract
Background: Circadian and multiday rhythms are found across many biological systems, including cardiology, endocrinology, neurology, and immunology. In people with epilepsy, epileptic brain activity and seizure occurrence have been found to follow circadian, weekly, and monthly rhythms. Understanding the relationship between these cycles of brain excitability and other physiological systems can provide new insight into the causes of multiday cycles. The brain-heart link has previously been considered in epilepsy research, with potential implications for seizure forecasting, therapy, and mortality (i.e., sudden unexpected death in epilepsy).
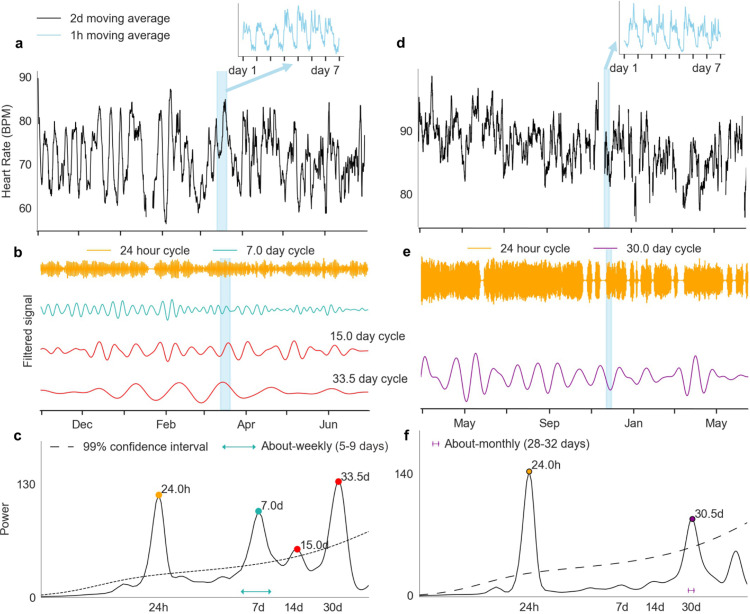
Methods: We report the results from a non-interventional, observational cohort study, Tracking Seizure Cycles. This study sought to examine multiday cycles of heart rate and seizures in adults with diagnosed uncontrolled epilepsy (N=31) and healthy adult controls (N=15) using wearable smartwatches and mobile seizure diaries over at least four months (M=12.0, SD=5.9; control M=10.6, SD=6.4). Cycles in heart rate were detected using a continuous wavelet transform. Relationships between heart rate cycles and seizure occurrence were measured from the distributions of seizure likelihood with respect to underlying cycle phase.
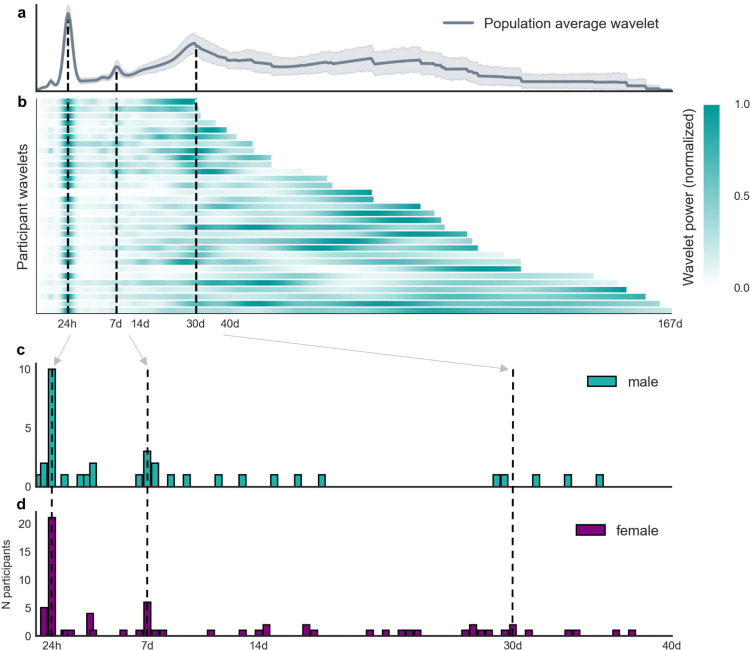
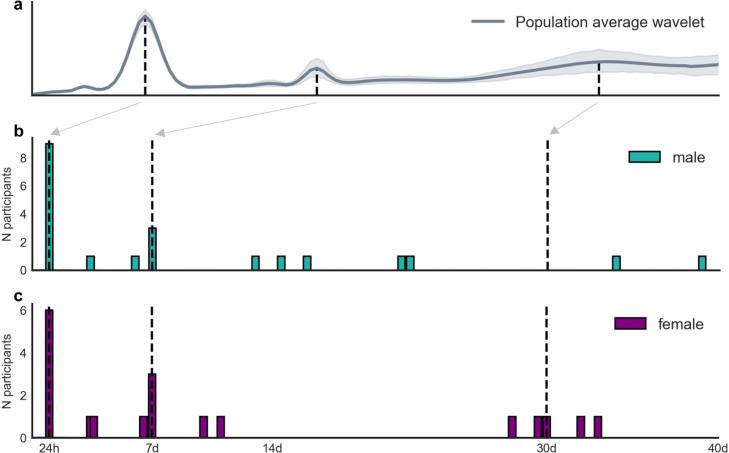
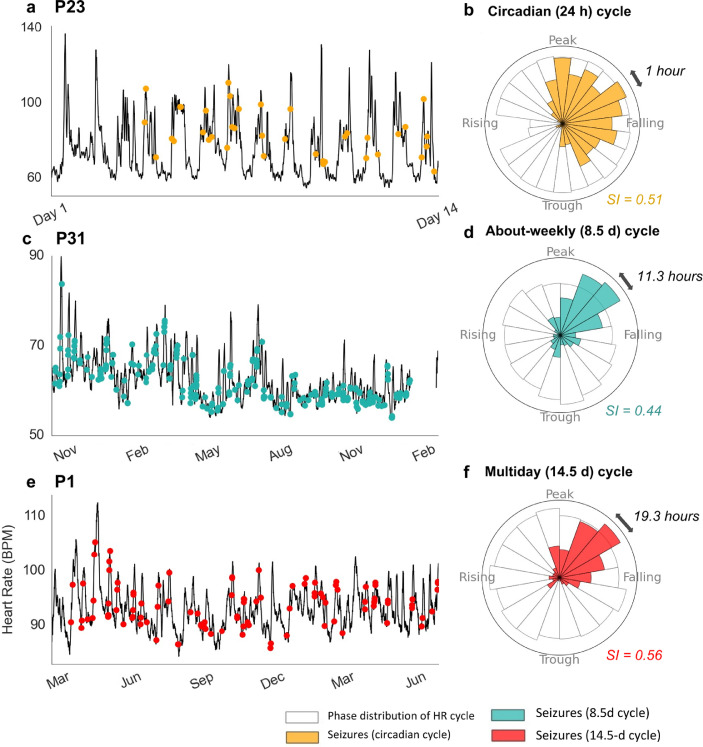
Findings: Heart rate cycles were found in all 46 participants (people with epilepsy and healthy controls), with circadian (N=46), about-weekly (N=25) and about-monthly (N=13) rhythms being the most prevalent. Of the participants with epilepsy, 19 people had at least 20 reported seizures, and 10 of these had seizures significantly phase locked to their multiday heart rate cycles.
Interpretation: Heart rate cycles showed similarities to multiday epileptic rhythms and may be comodulated with seizure likelihood. The relationship between heart rate and seizures is relevant for epilepsy therapy, including seizure forecasting, and may also have implications for cardiovascular disease. More broadly, understanding the link between multiday cycles in the heart and brain can shed new light on endogenous physiological rhythms in humans.
Funding: This research received funding from the Australian Government National Health and Medical Research Council (investigator grant 1178220), the Australian Government BioMedTech Horizons program, and the Epilepsy Foundation of America's 'My Seizure Gauge' grant.
Keywords: Epilepsy; heart rate; seizure cycles; seizure forecasting; wearables.
Copyright © 2021 The Authors. Published by Elsevier B.V. All rights reserved.
Conflict of interest statement
Declaration of competing interest Dr. Brinkmann reports grants from Epilepsy Foundation of America, My Seizure Gauge, during the conduct of the study; other from Cadence Neurosciences, outside the submitted work Dr. Stirling reports grants from Australian Government Research Training Program Scholarship, during the conduct of the study Dr. Gregg reports grants from American Epilepsy Society, during the conduct of the study Dr. Karoly reports grants from National Health and Medical Research Council (NHMRC), during the conduct of the study; other from Seer Medical, outside the submitted work; In addition, Dr. Karoly has a patent Methods and Systems of Seizure Forecasting issued. Dr. Cook reports personal fees and other from Seer Medical Australia, personal fees and other from Epi Minder, outside the submitted work; In addition, Dr. Cook has a patent Methods and Systems of Seizure Forecasting issued. Dr. Nurse reports grants from Epilepsy Foundation of America, grants from MTPConnect, during the conduct of the study; personal fees from Seer Medical, outside the submitted work Dr. Freestone reports grants from Epilepsy Foundation USA, personal fees and other from Seer Medical, during the conduct of the study; In addition, Dr. Freestone has a patent Methods and Systems of Seizure Forecasting issued. Dr. Richardson reports grants from Epilepsy Foundation of America, during the conduct of the study Dr. Maturana reports other from Seer Medical, outside the submitted work All other authors have no interests to disclose
Figures
References
-
- Reinberg AE, Dejardin L, Smolensky MH, Touitou Y. Seven-day human biological rhythms: An expedition in search of their origin, synchronization, functional advantage, adaptive value and clinical relevance. Chronobiol. Int. 2017 Feb 7;34(2):162–191. - PubMed
-
- Foster RG, Roenneberg T. Human responses to the geophysical daily, annual and lunar cycles. Curr. Biol. 2008 Sep;18(17):R784–R794. - PubMed
-
- Haus E, Touitou Y. Springer; Berlin, Heidelberg: 1992. Biologic Rhythms in Clinical and Laboratory Medicine.
-
- Karoly PJ, Goldenholz DM, Freestone DR, Moss RE, Grayden DB, Theodore WH. Circadian and circaseptan rhythms in human epilepsy: a retrospective cohort study. Lancet Neurol. 2018 Nov;17(11):977–985. - PubMed
Publication types
MeSH terms
LinkOut - more resources
Full Text Sources
Medical
