
Genomic reconstruction of the SARS-CoV-2 epidemic in England

Harald S Vöhringer et al. Nature. 2021 Dec.

Erratum in

  • Publisher Correction: Genomic reconstruction of the SARS CoV-2 epidemic in England.
    Vöhringer HS, Sanderson T, Sinnott M, De Maio N, Nguyen T, Goater R, Schwach F, Harrison I, Hellewell J, Ariani CV, Gonçalves S, Jackson DK, Johnston I, Jung AW, Saint C, Sillitoe J, Suciu M, Goldman N, Panovska-Griffiths J; Wellcome Sanger Institute COVID-19 Surveillance Team; COVID-19 Genomics UK (COG-UK) Consortium*; Birney E, Volz E, Funk S, Kwiatkowski D, Chand M, Martincorena I, Barrett JC, Gerstung M. Vöhringer HS, et al. Nature. 2022 Jun;606(7915):E18. doi: 10.1038/s41586-022-04887-8. Nature. 2022. PMID: 35701578 Free PMC article. No abstract available.

Abstract

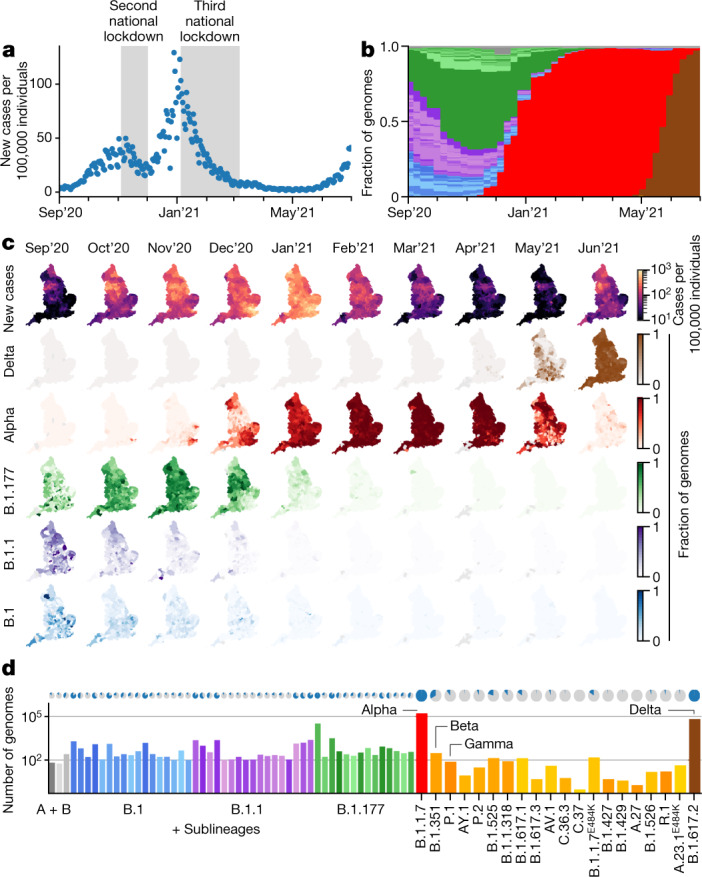
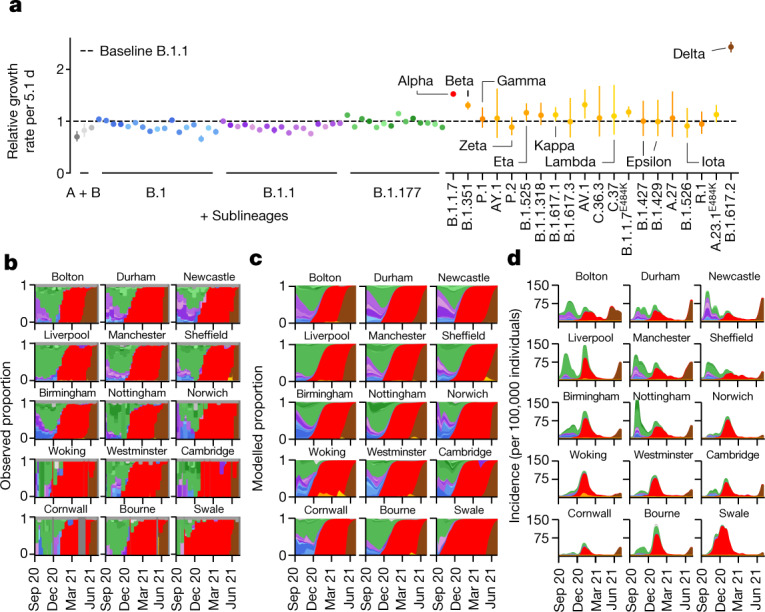
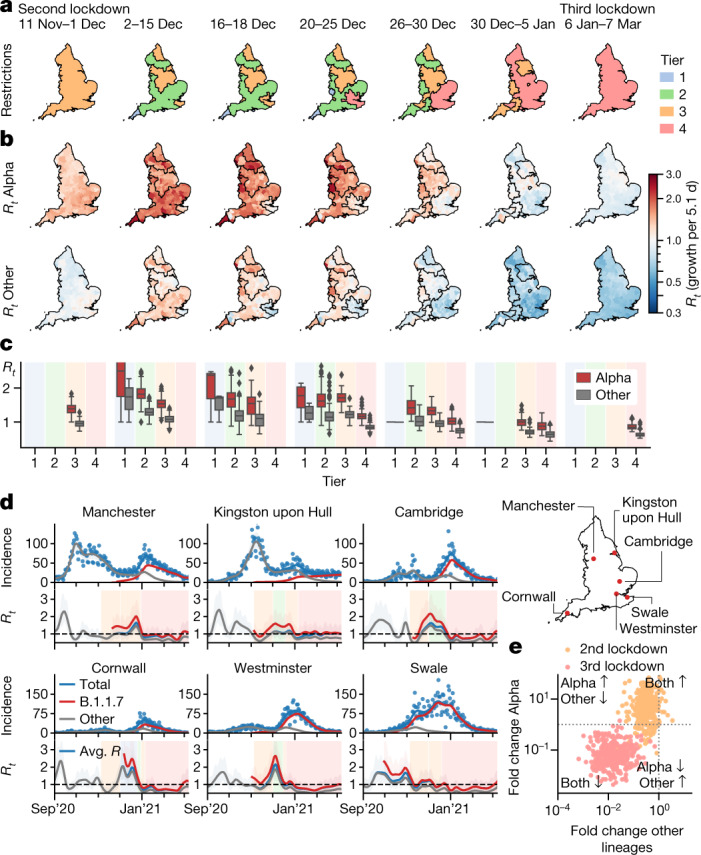
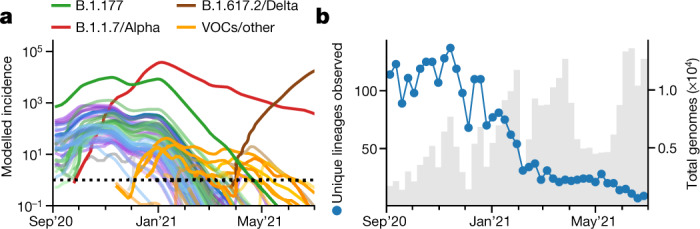
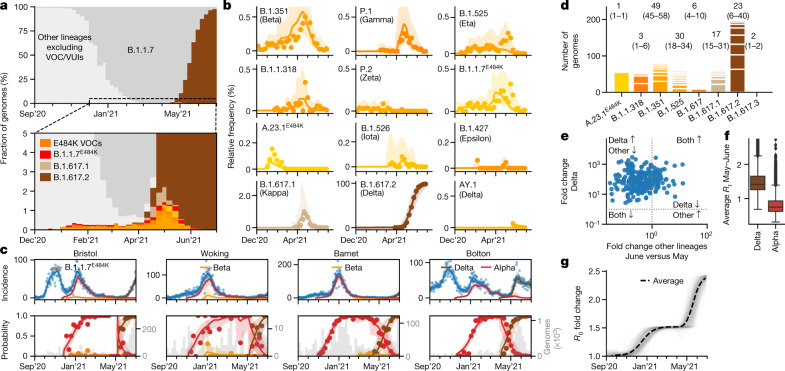
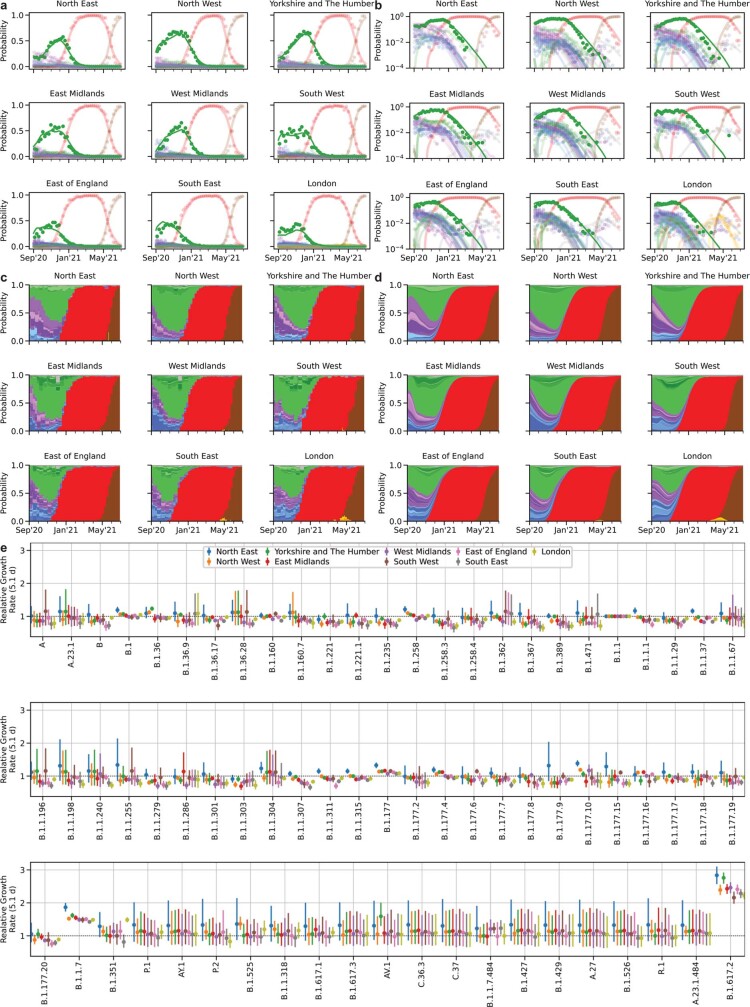
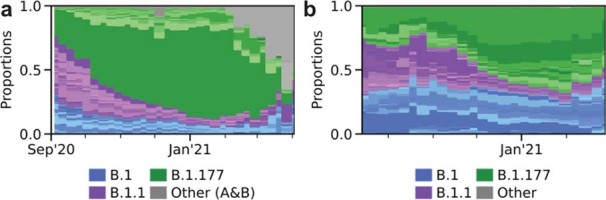
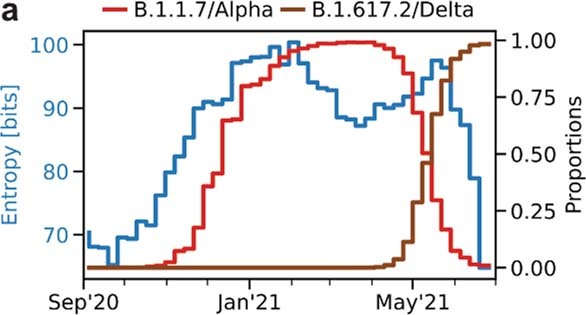
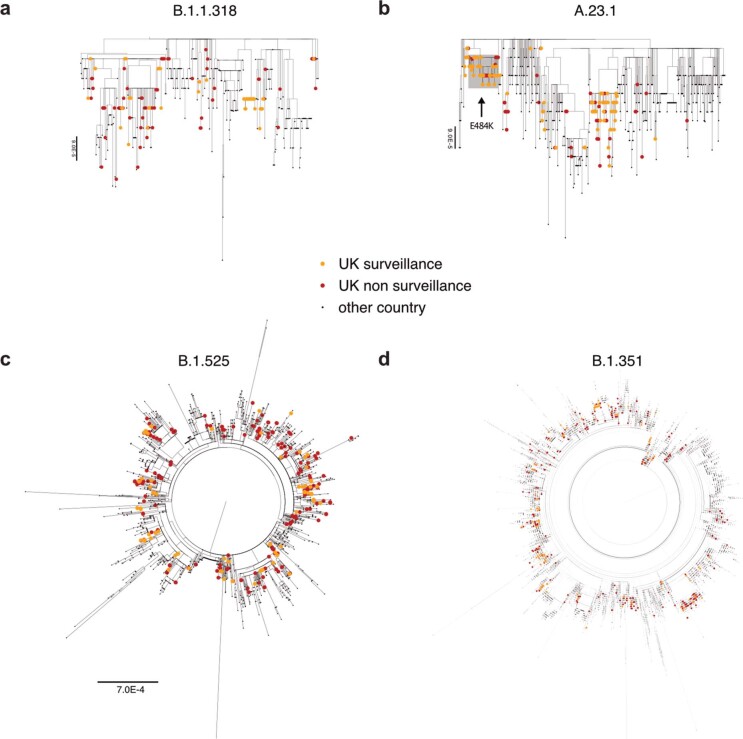
The evolution of the severe acute respiratory syndrome coronavirus 2 (SARS-CoV-2) virus leads to new variants that warrant timely epidemiological characterization. Here we use the dense genomic surveillance data generated by the COVID-19 Genomics UK Consortium to reconstruct the dynamics of 71 different lineages in each of 315 English local authorities between September 2020 and June 2021. This analysis reveals a series of subepidemics that peaked in early autumn 2020, followed by a jump in transmissibility of the B.1.1.7/Alpha lineage. The Alpha variant grew when other lineages declined during the second national lockdown and regionally tiered restrictions between November and December 2020. A third more stringent national lockdown suppressed the Alpha variant and eliminated nearly all other lineages in early 2021. Yet a series of variants (most of which contained the spike E484K mutation) defied these trends and persisted at moderately increasing proportions. However, by accounting for sustained introductions, we found that the transmissibility of these variants is unlikely to have exceeded the transmissibility of the Alpha variant. Finally, B.1.617.2/Delta was repeatedly introduced in England and grew rapidly in early summer 2021, constituting approximately 98% of sampled SARS-CoV-2 genomes on 26 June 2021.


Conflict of interest statement

E.B. is a paid consultant of Oxford Nanopore.

Figures

Fig. 1
Fig. 1. SARS-CoV-2 surveillance sequencing in England between September 2020 and June 2021.
a, Positive Pillar 2 SARS-CoV-2 tests in England. b, The relative frequency of 328 different PANGO lineages, representing approximately 7.2% of the tests shown in a. c, Positive tests (row 1) and the frequency of 4 major lineages (rows 2–5) across 315 English lower tier local authorities. d, The absolute frequency of sequenced genomes mapped to 71 PANGO lineages. The blue areas in the pie charts are proportional to the fraction of LTLAs in which a given lineage was observed. Source data
Fig. 2
Fig. 2. Spatiotemporal model of 71 SARS-CoV-2 lineages in 315 English LTLAs between September 2020 and June 2021.
a, The average growth rates for 71 lineages. Data are median ± 95% CI. b, Lineage-specific relative frequency for 35 selected LTLAs, arranged by longitude and latitude to geographically cover England. c, Fitted lineage-specific relative frequency for the same LTLAs as in b. d, Fitted lineage-specific incidence for the same LTLAs as in b. Source data
Fig. 3
Fig. 3. Growth of B.1.1.7/Alpha and other lineages in relation to lockdown restrictions between November 2020 and March 2021.
a, Maps and dates of national and regional restrictions in England. Second national lockdown: closed hospitality businesses; contacts ≤ 2, outdoors only; open schools; reasonable excuse needed for leaving home. Tier 1: private indoor gatherings of ≤6 persons. Tier 2: as tier 1 plus restricted hospitality services; gatherings of ≤6 in public outdoor places. Tier 3: as tier 2 plus most hospitality businesses closed. Tier 4: as tier 3 but single outdoor contact. Third national lockdown: closed schools with the exception of key workers. b, Local lineage-specific Rt values for Alpha and the average Rt value (growth per 5.1 d) of all of the other lineages in the same periods. c, Rt values from n = 315 LTLA shown in b. The box centre horizontal line indicates the median, box limits show the quartiles, the whiskers extend to 1.5× the interquartile range. d, Total and lineage-specific incidence (top) and Rt values (bottom) for six selected LTLAs during the period of restrictions. e, Crude lineage-specific fold changes (odds ratios) in Alpha and other lineages across the second (orange) and third national lockdown (red). Source data
Fig. 4
Fig. 4. Elimination of SARS-CoV-2 lineages during spring 2021.
a, Modelled lineage-specific incidence in England. The colours resemble major lineages as indicated and shades thereof indicate the respective sublineages. b, The observed number of PANGO lineages per week. Source data
Fig. 5
Fig. 5. Dynamics of E484K variants and Delta between January and June 2021.
a, The observed relative frequency of other lineages (light grey), Alpha/B.1.1.7 (dark grey), E484K variants (orange) and Delta/B.1.617.2 (brown). b, The observed and modelled relative frequency of variants in England. c, The total and relative lineage-specific incidence in four selected LTLAs. For b and c, the shaded areas indicate the 95% CIs. d, Estimated UK clade numbers (numbers in square parentheses represent minimum and maximum numbers) and sizes. e, Crude growth rates (odds ratios) of Delta and Alpha between April and June 2021, as in Fig. 3e. f, Lineage-specific Rt values of n = 315 LTLA in the same period, defined as in Fig. 3c. g, Changes in the average transmissibility across 315 LTLAs during the study period. Source data
Extended Data Fig. 1
Extended Data Fig. 1. SARS-CoV-2 surveillance sequencing in England between September 2020 and June 2021.
a. Local monthly coverage across 315 LTLAs. b. Weekly coverage of genomic surveillance sequencing. c. Hospitalization, case and infection fatality rates relative to ONS prevalence. Dots denote mean estimates and error bars 95% CIs.
Extended Data Fig. 2
Extended Data Fig. 2. Genomic surveillance model of total incidence and lineage-specific frequencies.
a. Cubic basis splines (top row) are convolved with the infection to test distribution (row 2 and 3) and used to fit the log incidence in a LTLA and its corresponding derivatives (growth rates; bottom row). b. Example incidence (top row), logarithmic incidence with individual convolved basis functions (dashed lines, row 2), growth rate with individual spline basis derivatives (dashed lines, row 3) and resulting (case) reproduction numbers (growth rate per 5.1d) from our approach (GenomicSurveillance) and estimates by EpiEstim, shifted by 10d to approximate a case reproduction number. c. The relative frequencies of 62 different lineages are modelled using piecewise multinomial logistic regression. The linear logits are modelled to jump stochastically within 21d prior to first observation to account for the effects of new introductions. Shown are the logits of 5 selected lineages in two different LTLAs.
Extended Data Fig. 3
Extended Data Fig. 3. Genomic surveillance model selection.
a. Model loss in terms of the ELBO objective function and the model hyperparameters alpha0 and alpha1 (see Methods). b. Model deviance (calculated as −2 x log pointwise predictive density) with respect to the model hyperparameters α0 and α1 (see Methods). c. Mean squared error (MSE) of modelled weekly proportions of highly prevalent lineages with respect to the model parameters  α0 and  α1 (see Methods). d. Same as in c, but for lineages exhibiting low frequencies (VOCs).
Extended Data Fig. 4
Extended Data Fig. 4. Spatiotemporal model of 71 SARS-CoV-2 lineages in 315 English LTLAs between September 2020 and June 2021.
a. Regional lineage specific relative frequency of lineages contributing more than 50 genomes during the time period shown. Dots denote observed data, lines the fits aggregated to each region. b. Same as a, but on a log scale. c. Same data as in a, shown as stacked bar charts. Colours resemble major lineages as indicated and shadings thereof indicate sublineages. d. Same fits as in a, shown as stacked segments. e. Average growth rates for 71 SARS-Cov2 lineages estimated in different regions in England. Dots denote median estimates and error bars 95% CIs.
Extended Data Fig. 5
Extended Data Fig. 5. Relative growth of B.1.177.
a. Lineage-specific relative frequency data in England, excluding B.1.1.7 and other VOCs/VUIs (Category Other includes: A, A.18, A.20, A.23, A.25, A.27, A.28, B, B.29, B.40, None). Colours resemble major lineages as indicated and shadings thereof indicate sublineages. b. Lineage-specific relative frequency data in Denmark, excluding B.1.1.7 and other VOCs/VUIs. Colours resemble major lineages as indicated and shadings thereof indicate sublineages.
Extended Data Fig. 6
Extended Data Fig. 6. Genomic diversity of the SARS-CoV-2 epidemic.
Shown is the entropy (blue), total number of observed Pango lineages (grey, divided by 4), as well as the proportion of B.1.1.7 (orange, right axis). The sweep of B.1.1.7 causes an intermittent decline of genomic diversity as measured by the entropy.
Extended Data Fig. 7
Extended Data Fig. 7. Global phylogenetic trees of selected VOCs/VUIs.
English surveillance and other (targeted and quarantine) samples are highlighted respectively orange and red.
Extended Data Fig. 8
Extended Data Fig. 8. Global phylogenetic trees of B.1.617 sublineages.
a, b and c. English surveillance and other (targeted and quarantine) samples are highlighted respectively orange and red. The trees of B.1.617.1 and B.1.617.2 are rooted. d. Number of UK introductions inferred by parsimony (minimum and maximum numbers) and by Thorney BEAST (95% posterior CI) for each VOC.

References

    1. Rambaut, A. Phylogenetic Analysis of nCoV-2019 Genomes (Virological, 2020); https://virological.org/t/phylodynamic-analysis-176-genomes-6-mar-2020/356
    1. Nextstrain Team Genomic Epidemiology of Novel Coronavirus—Global Subsampling (Nextstrain, 2020); https://nextstrain.org/ncov/global?l=clock
    1. Hadfield J, et al. Nextstrain: real-time tracking of pathogen evolution. Bioinformatics. 2018;34:4121–4123. doi: 10.1093/bioinformatics/bty407. - DOI - PMC - PubMed
    1. Volz E, et al. Evaluating the effects of SARS-CoV-2 spike mutation D614G on transmissibility and pathogenicity. Cell. 2021;184:64–75. doi: 10.1016/j.cell.2020.11.020. - DOI - PMC - PubMed
    1. Rambaut A, et al. A dynamic nomenclature proposal for SARS-CoV-2 lineages to assist genomic epidemiology. Nat. Microbiol. 2020;5:1403–1407. doi: 10.1038/s41564-020-0770-5. - DOI - PMC - PubMed

Publication types

Substances

Supplementary concepts