. 2021 Nov 9;97(19):e1886-e1897.
doi: 10.1212/WNL.0000000000012834. Epub 2021 Oct 14.

Mechanisms of Network Changes in Cognitive Impairment in Multiple Sclerosis

Affiliations

Mechanisms of Network Changes in Cognitive Impairment in Multiple Sclerosis

Danka Jandric et al. Neurology. .

Abstract

Background and objectives: Cognitive impairment in multiple sclerosis (MS) is associated with functional connectivity abnormalities. While there have been calls to use functional connectivity measures as biomarkers, there remains to be a full understanding of why they are affected in MS. In this cross-sectional study, we tested the hypothesis that functional network regions may be susceptible to disease-related "wear and tear" and that this can be observable on co-occurring abnormalities on other magnetic resonance metrics. We tested whether functional connectivity abnormalities in cognitively impaired patients with MS co-occur with (1) overlapping, (2) local, or (3) distal changes in anatomic connectivity and cerebral blood flow abnormalities.

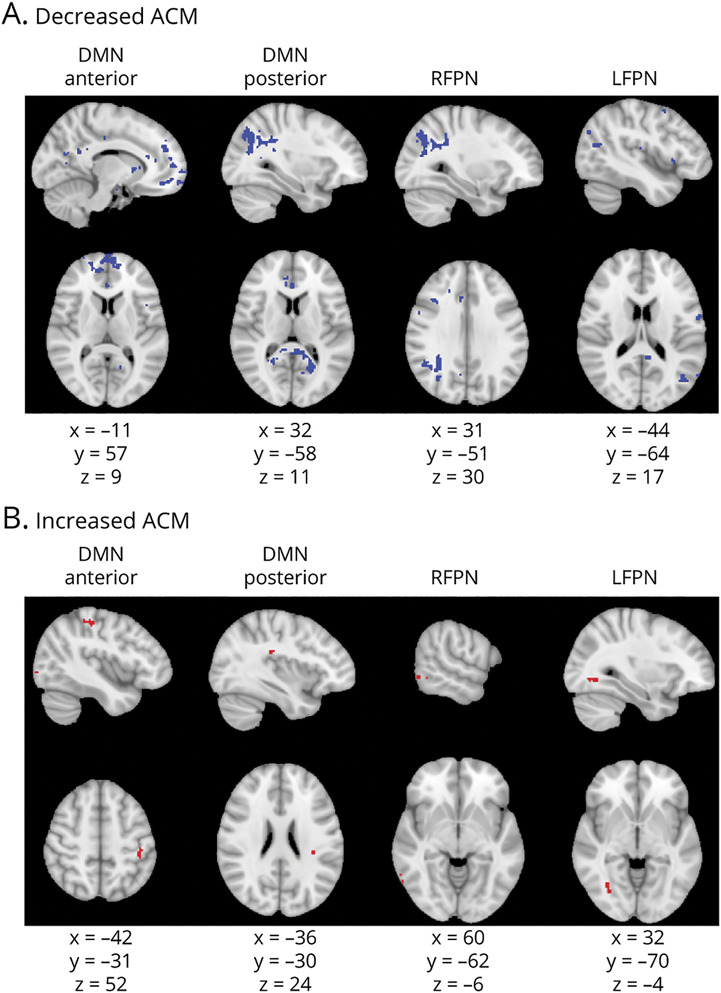
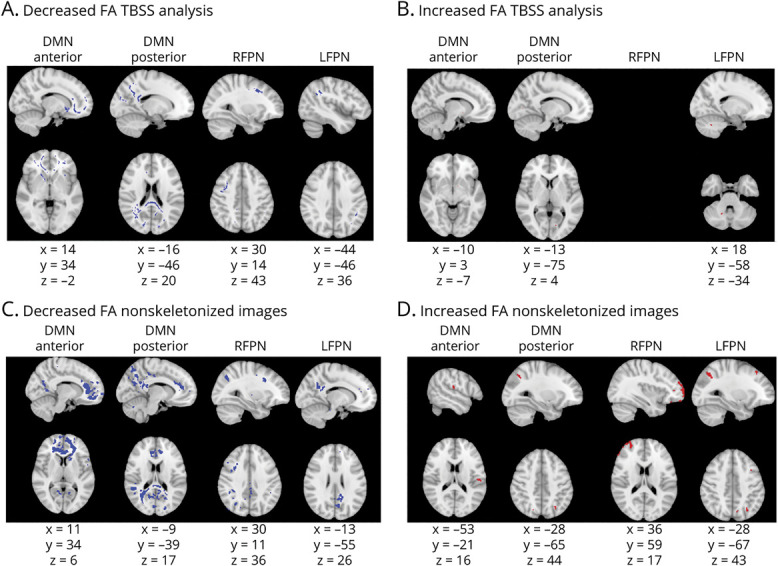
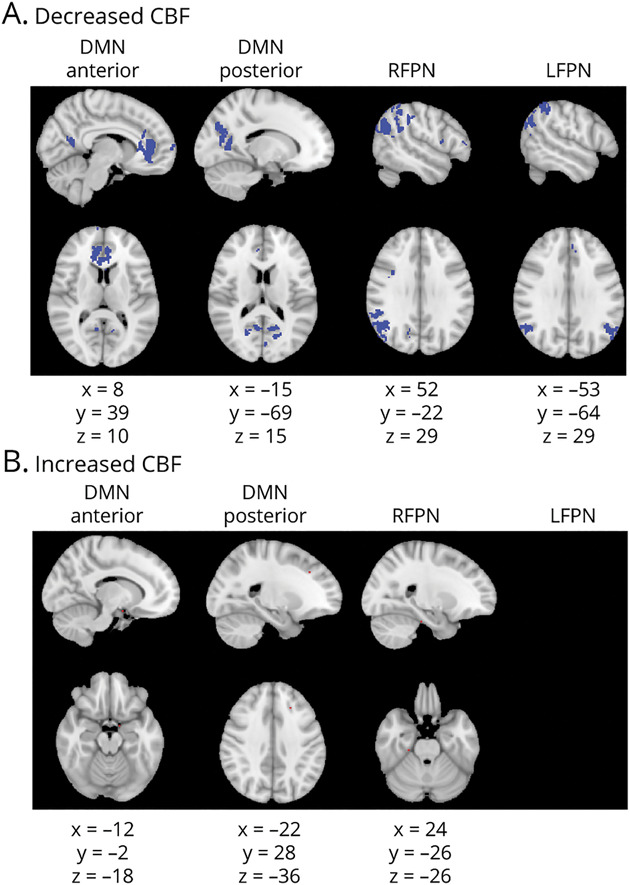
Methods: Multimodal 3T MRI and assessment with the Brief Repeatable Battery of Neuropsychological tests were performed in 102 patients with relapsing-remitting MS and 27 healthy controls. Patients with MS were classified as cognitively impaired if they scored ≥1.5 SDs below the control mean on ≥2 tests (n = 55) or as cognitively preserved (n = 47). Functional connectivity was assessed with Independent Component Analysis and dual regression of resting-state fMRI images. Cerebral blood flow maps were estimated, and anatomic connectivity was assessed with anatomic connectivity mapping and fractional anisotropy of diffusion-weighted MRI. Changes in cerebral blood flow and anatomic connectivity were assessed within resting-state networks that showed functional connectivity abnormalities in cognitively impaired patients with MS.

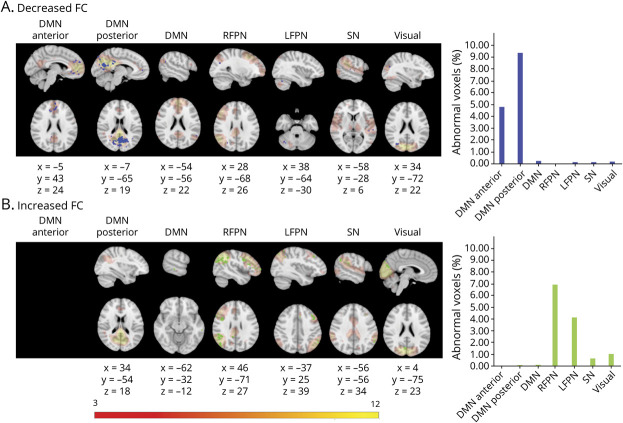
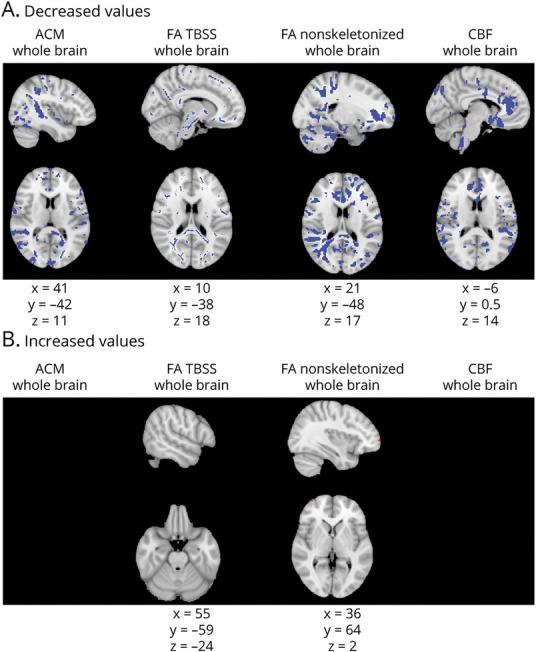
Results: Functional connectivity was significantly decreased in the anterior and posterior default mode networks and significantly increased in the right and left frontoparietal networks in cognitively impaired relative to cognitively preserved patients with MS (threshold-free cluster enhancement corrected at p ≤ 0.05, 2 sided). Networks showing functional abnormalities showed altered cerebral blood flow and anatomic connectivity locally and distally but not in overlapping locations.

Discussion: We provide the first evidence that functional connectivity abnormalities are accompanied by local cerebral blood flow and structural connectivity abnormalities but also demonstrate that these effects do not occur in exactly the same location. Our findings suggest a possibly shared pathologic mechanism for altered functional connectivity in brain networks in MS.


Figures

Figure 1
Figure 1. FC Abnormalities in CI Compared to CP Patients
Figure shows voxels showing functional connectivity (FC) abnormalities in cognitively impaired (CI) compared to cognitively preserved (CP) patients overlaid onto the group average spatial map of each resting-state network (RSN) analyzed in red-yellow. First 7 columns in each panel show each of the RSNs investigated: default mode network (DMN) anterior, DMN posterior, DMN, right frontoparietal network (RFPN), left frontoparietal network (LFPN), salience network (SN), and primary visual network. For networks not displayed, no significant group differences were found. The 8 columns show graphs indicating the percentage of voxels showing abnormalities of the total number of voxels in the network. Rows show areas of (A) decreased FC in the CI group vs CP (in blue) and (B) increased FC in CI group (in green). Results were threshold-free cluster enhancement corrected at p ≤ 0.05, 2 sided. Montreal Neurological Institute coordinates are given for results displayed. Color bar shows signal intensity of RSNs.
Figure 2
Figure 2. Anatomic Connectivity Changes in Cognitively Impaired Compared to Cognitively Preserved Patients Based on a Voxelwise Analysis of ACMs
Figure shows voxels showing anatomic connectivity map (ACM) value abnormalities. Columns show each of the resting-state networks compared. First row (A) shows areas of decreased ACM values (in blue); second row (B) shows areas of increased ACM values (in red). Montreal Neurological Institute coordinates are given for the biggest voxel clusters displayed. Results were threshold-free cluster enhancement corrected at p ≤ 0.05, 2-sided. DMN = default mode network; LFPN = left frontoparietal network; RFPN = right frontoparietal network.
Figure 3
Figure 3. FA Changes in Cognitively Impaired Compared to Cognitively Preserved Patients
Figure shows voxels showing fractional anisotropy (FA) abnormalities. (A and B) Results from the tract-based spatial statistics (TBSS) analysis. (C and D) Results from the voxelwise analysis of nonskeletonized FA maps. Columns show each of the resting-state networks compared. First row shows areas of decreased FA (in blue); second row shows areas of increased FA (in red). Montreal Neurological Institute coordinates are given for the biggest voxel clusters displayed. For networks not displayed, no significant results were found. Results were threshold-free cluster enhancement corrected at p ≤ 0.05, 2 sided. DMN = default mode network; LFPN = left frontoparietal network; RFPN = right frontoparietal network.
Figure 4
Figure 4. CBF Changes in Cognitively Impaired Compared to Cognitively Preserved Patients Based on a Voxelwise Analysis of CBF Maps
Figure shows voxels showing cerebral blood flow (CBF) abnormalities in red. Columns show each of the resting-state networks compared. First row (A) shows areas of decreased CBF (in blue). Second row (B) shows areas of increased CBF (in red). Montreal Neurological Institute coordinates are given for the biggest voxel clusters displayed. Results were threshold-free cluster enhancement corrected at p ≤ 0.05, 2 sided. DMN = default mode network; LFPN = left frontoparietal network; RFPN = right frontoparietal network.
Figure 5
Figure 5. Diffuse ACM, FA, and CBF Changes Across the Whole Brain in CI Compared to CP Patients
Figure shows anatomic connectivity map (ACM), fractional anisotropy (FA), and cerebral blood flow (CBF) abnormalities throughout the brain. Columns show each of the metrics assessed: ACM, FA from tract-based spatial statistics (TBSS), FA from analysis of nonskeletonized FA maps, and CBF, in that order. First row (A) shows areas of decreased values (in blue); second row (B) shows areas of increased values (in red). Montreal Neurological Institute coordinates are given for the biggest voxel clusters displayed. Results were threshold-free cluster enhancement corrected at p ≤ 0.05, 2 sided.

Comment in

References

    1. Sumowski JF, Benedict R, Enzinger C, et al. . Cognition in multiple sclerosis: state of the field and priorities for the future. Neurology. 2018;90(6):278-288. - PMC - PubMed
    1. Benedict RHB. Cognition in multiple sclerosis: Charcot was right. Lancet Neurol. 2020;19(10):810. - PubMed
    1. Buckner RL, Sepulcre J, Talukdar T, et al. . Cortical hubs revealed by intrinsic functional connectivity: mapping, assessment of stability, and relation to Alzheimer's disease. J Neurosci. 2009;29(6):1860-1873. - PMC - PubMed
    1. Zhou J, Gennatas ED, Kramer JH, Miller BL, Seeley WW. Predicting regional neurodegeneration from the healthy brain functional connectome. Neuron. 2012;73(6):1216-1227. - PMC - PubMed
    1. Lapointe E, Li DKB, Traboulsee AL, Rauscher A. What have we learned from perfusion MRI in multiple sclerosis? AJNR Am J Neuroradiol. 2018;39(6):994-1000. - PMC - PubMed

Publication types

MeSH terms