. 2021 Nov;31(11):2022-2034.
doi: 10.1101/gr.275245.121. Epub 2021 Oct 14.

RBFOX splicing factors contribute to a broad but selective recapitulation of peripheral tissue splicing patterns in the thymus

Affiliations

RBFOX splicing factors contribute to a broad but selective recapitulation of peripheral tissue splicing patterns in the thymus

Kathrin Jansen et al. Genome Res. 2021 Nov.

Abstract

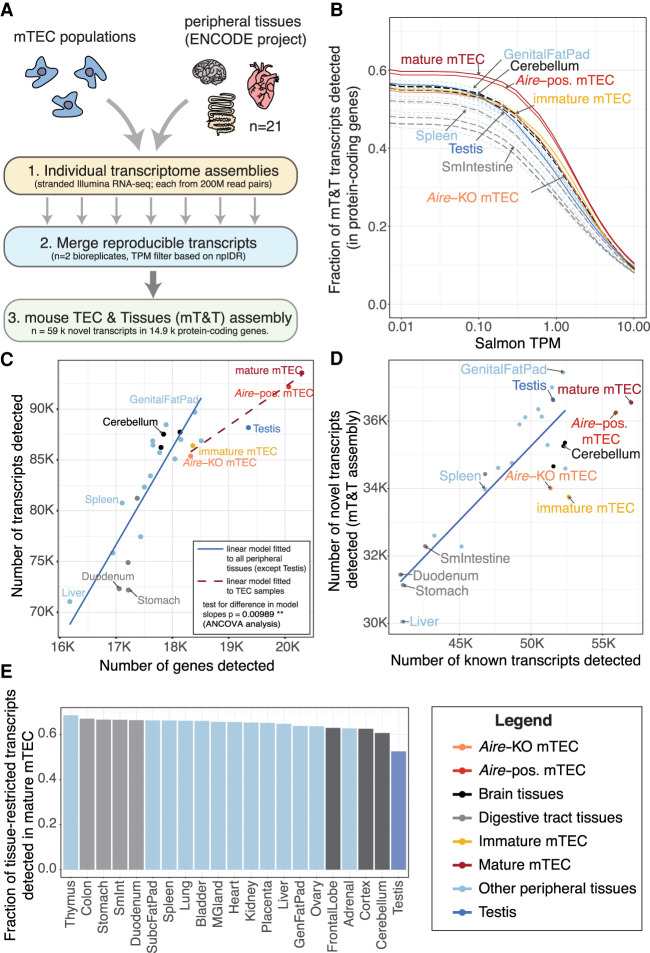
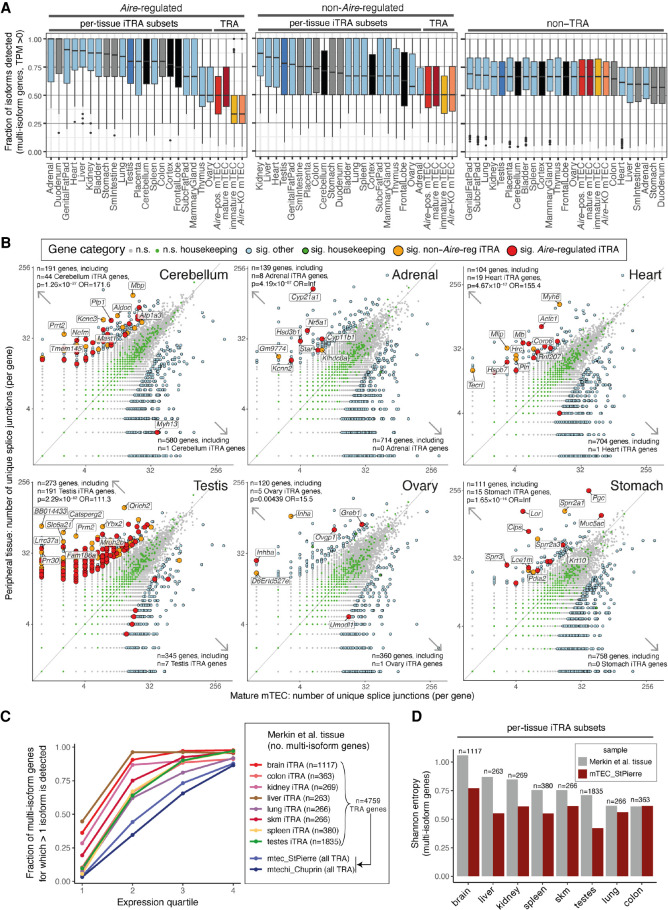
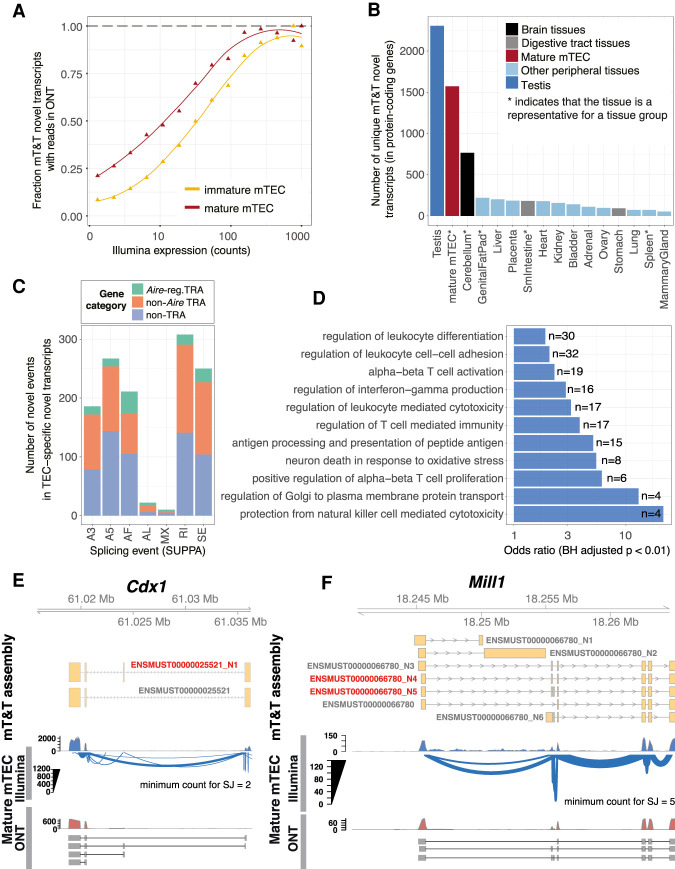
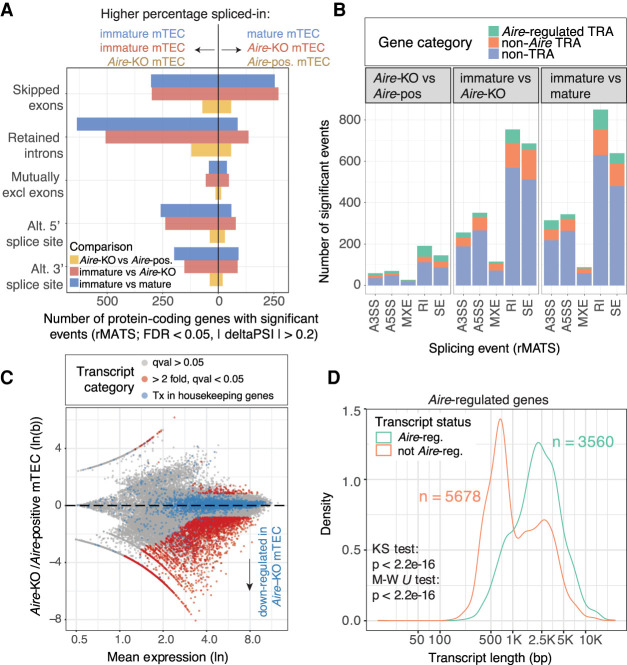
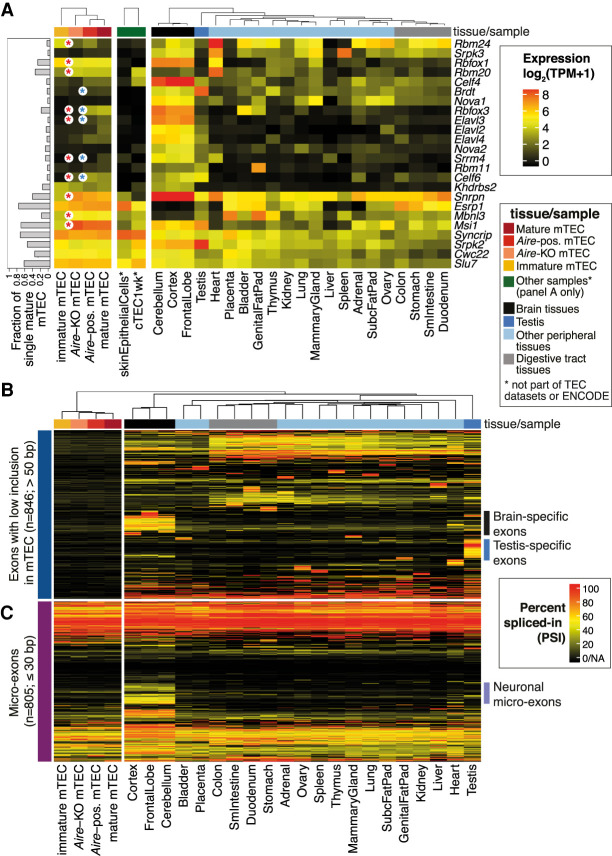
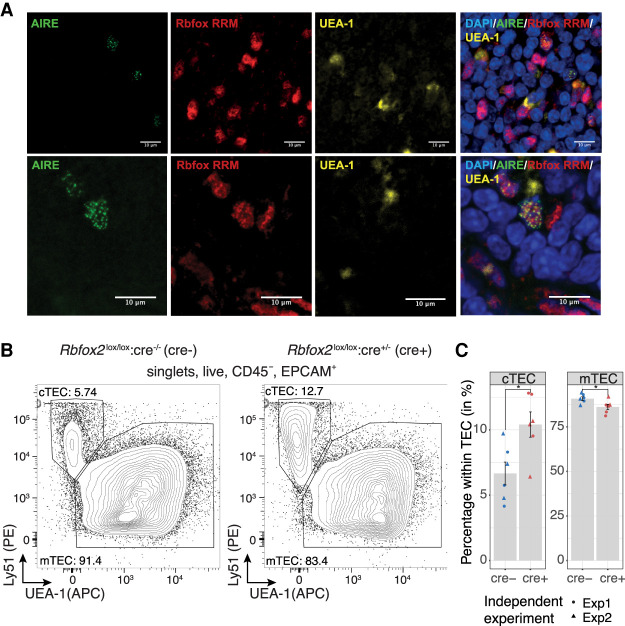
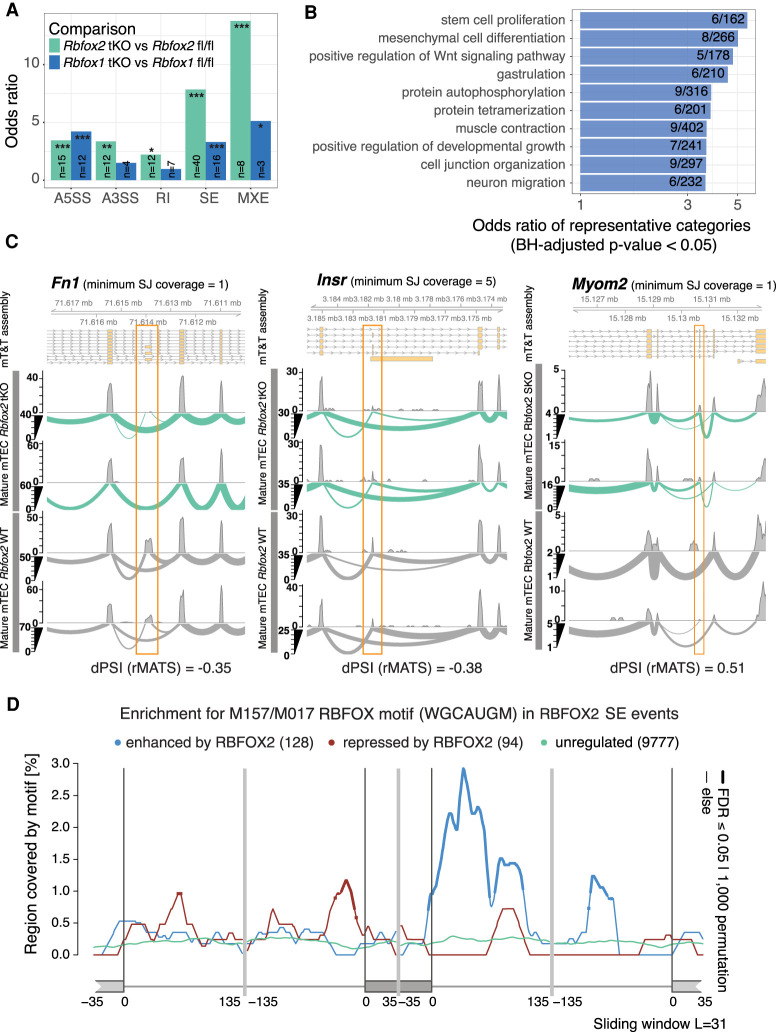
Thymic epithelial cells (TEC) control the selection of a T cell repertoire reactive to pathogens but tolerant of self. This process is known to involve the promiscuous expression of virtually the entire protein-coding gene repertoire, but the extent to which TEC recapitulate peripheral isoforms, and the mechanisms by which they do so, remain largely unknown. We performed the first assembly-based transcriptomic census of transcript structures and splicing factor (SF) expression in mouse medullary TEC (mTEC) and 21 peripheral tissues. Mature mTEC expressed 60.1% of all protein-coding transcripts, more than was detected in any of the peripheral tissues. However, for genes with tissue-restricted expression, mTEC produced fewer isoforms than did the relevant peripheral tissues. Analysis of exon inclusion revealed an absence of brain-specific microexons in mTEC. We did not find unusual numbers of novel transcripts in TEC, and we show that Aire, the facilitator of promiscuous gene expression, promotes the generation of long "classical" transcripts (with 5' and 3' UTRs) but has only a limited impact on alternative splicing in mTEC. Comprehensive assessment of SF expression in mTEC identified a small set of nonpromiscuously expressed SF genes, among which we confirmed RBFOX to be present with AIRE in mTEC nuclei. Using a conditional loss-of-function approach, we show that Rbfox2 promotes mTEC development and regulates the alternative splicing of promiscuously expressed genes. These data indicate that TEC recommission a small number of peripheral SFs, including members of the RBFOX family, to generate a broad but selective representation of the peripheral splice isoform repertoire.


Figures

Figure 1.
Figure 1.
Comparative analysis of transcript expression in mTEC and peripheral tissues. (A) Generation of a common mouse mTEC and peripheral Tissues (mT&T) transcriptome assembly. (B) Fractions of transcripts from protein-coding genes detected in peripheral tissues and mTEC populations across a range of TPM thresholds. The scatter plots (C,D) show the relationships between the number of genes and transcripts (C) and the number of known versus novel transcripts (D) detected in peripheral tissues and mTEC populations. The linear models shown in C and D were fitted to all samples except TEC and testis (solid trend lines) or to the TEC samples (C, dashed trend line). There was a significant difference in the trend line slopes in C (P = 0.00989, ANCOVA analysis). (E) Fractions of sets of tissue-restricted transcripts (tau ≥ 0.9) from peripheral tissues detected in mature mTEC (see also Supplemental Fig. 2I). Analyses shown were restricted to protein-coding genes and performed using a single high-depth sample per tissue. Similar results were obtained using lower-depth biologically replicate sample pools (n = 2) (Supplemental Fig. 2C–E,H).
Figure 2.
Figure 2.
mTEC express fewer isoforms of TRA genes than peripheral tissues. (A) The fraction of isoforms detected (TPM > 0) per multi-isoform protein-coding gene in mTEC and ENCODE peripheral tissues. The box plots show the fractions for Aire-regulated TRA genes (left), non-Aire TRA genes (middle), and non-TRA genes (right, colors as in Fig. 1) (Supplemental Fig. 3D). (B) The numbers of splice junctions found in protein-coding genes (points) in mature mTEC (this study; x-axes) versus peripheral tissues (ENCODE Project; y-axes). Six selected peripheral tissues are shown, with the remaining 14 displayed in Supplemental Figure 5A. Significant (sig.) differences in junction number were identified using edgeR (BH adjusted P < 0.05, |fc| > 2). P-values and odds ratios (OR) from Fisher's exact tests for enrichment of iTRA genes among the genes with significantly higher junction counts in the peripheral tissues are reported (top left). The top 10 of each tissue's iTRA genes with significant differences in junction counts are labeled (as ranked by edgeR P-value). (C,D) Validation with independent peripheral tissue (Merkin et al. 2012) and TEC data sets (St-Pierre et al. 2013; Chuprin et al. 2015). (C) The fraction (y-axis) of alternatively spliced multi-isoform genes (>1 splice isoform detected) is shown for individual sets of tissue iTRA genes by expression quartile (x-axis). (D) The bar plots show the mean Shannon entropy (y-axis) of splice isoform expression for sets of multi-isoform tissue iTRA genes (x-axis). Alternate versions of C and D made using all genes are shown in Supplemental Figure 5B and 5C. For A and C, the full sets of TRA genes were quantitated in the TEC populations.
Figure 3.
Figure 3.
Identification and characterization of TEC-specific novel transcripts. (A) Validation of novel mT&T transcripts using ONT RNA sequencing. The fraction of novel transcripts supported by ONT reads are shown for mature mTEC (red) and immature mTEC (yellow). (B) Number of novel transcripts “uniquely” detected in mature mTEC and representative peripheral tissue samples (Supplemental Methods; Supplemental Figs. 3A, 8). (C) TEC-specific novel splicing events by event type and promiscuous expression status. Individual events may be counted in multiple categories. (SE) skipped exon; (RI) retained intron; (MX) mutually exclusive exon; (A3/A5) alternative 3′/5′ splice site; (AF/AL) alternative first/last exon. (D) Selected GO biological processes significantly overrepresented in the set of genes (n = 1167) from which the mTEC-specific novel transcripts were derived (one-sided Fisher's exact tests; BH adjusted P < 0.01). (E,F) Cdx1 and Mill1 are displayed as examples to show novel TEC-specific transcripts (red). Existence of the novel transcripts in mature mTEC was supported by both Illumina (Sashimi plots) and long-read ONT (selected reads) data. Novel transcripts are indicated by the “_N” suffix.
Figure 4.
Figure 4.
Aire promotes the generation of long transcripts in TEC. (A) The numbers of protein-coding genes (x-axis) in which significant differential splicing events (y-axis) were detected; comparisons of immature versus mature mTEC (blue), immature mTEC versus Aire-knockout mTEC (red) and Aire-knockout versus Aire-positive mature mTEC (yellow) (n = 2 replicates per sample). (B) Breakdown of identified splicing events by event type and promiscuous expression status. (SE) skipped exon; (RI) retained intron; (MXE) mutually exclusive exon; (A3SS/A5SS) alternative 3′/5′ splice site. (C) MA plot of differential transcript expression in Aire-knockout compared to Aire-positive mTEC. Transcripts regulated by Aire are shown in red (sleuth, Wald test, Qval < 0.05, fc ≳ 2, n = 2 replicates per sample). Transcripts from housekeeping genes are shown in blue. (D) The length distributions of Aire-regulated and non-Aire-regulated transcripts in Aire-regulated genes (analysis limited to genes that contained at least one significantly Aire-regulated transcript as defined in C).
Figure 5.
Figure 5.
Selective expression of peripheral SFs and exons in mTEC. (A) Expression of a set of tissue-restricted (tau > 0.5) genes that encode for bona fide SFs (Supplemental Table 8) in mTEC populations, skin epithelia, cTEC, and peripheral tissues (mouse ENCODE Project). The bars (left) depict the fraction of a set of single mature mTEC that express each factor. Significant differences in expression between immature versus mature (Aire-KO) mTEC or Aire-KO versus Aire-positive mTEC are indicated by red and blue asterisks, respectively (BH adjusted P-value < 0.05, |fc| > 2, DESeq2 analysis of the population RNA sequencing data, n = 2 biological replicates/condition). (B) Patterns of protein-coding exon (>50 bp in length) inclusion for exons with a low inclusion rate in mTEC (mean PSI < 0.1; max PSI < 0.2) that were included in at least one of the peripheral tissues (PSI > 0.5). (C) Microexon (≤30 bp) inclusion in transcripts from protein-coding genes in the mTEC population and peripheral tissue samples (Supplemental Fig. 11B).
Figure 6.
Figure 6.
RBFOX is present with AIRE in mTEC nuclei and influences TEC development. (A) Confocal immunofluorescence analysis of the localization of AIRE (green) and RBFOX (red) in the thymic medulla. RBFOX was detected using an anti-RRM domain-specific antibody, mTEC were identified by reactivity with the lectin UEA-1 (yellow), and nuclei were labeled using DAPI (blue). Two representative sections are shown in the upper and lower panels. (B) Representative flow cytometric analysis of cTEC and mTEC frequencies among thymic epithelial cells extracted from Rbfox2 tKO animals. (C) Quantification of cTEC and mTEC frequency in Rbfox2 tKO animals. The mean ± SE from n = 2 independent experiments is shown in bar graphs; (*) P-value < 0.05 for two-sided Welch two sample t-test.
Figure 7.
Figure 7.
RBFOX regulates alternative splicing in TEC. (A) The bar plots show the enrichments (ORs) of previously predicted Rbfox target genes (Weyn-Vanhentenryck et al. 2014) in the sets of genes differentially spliced in the Rbfox1 tKO or Rbfox2 tKO mature mTEC (two-sided Fisher's exact tests, BH adjusted P-values): (*) P < 0.05, (**) P < 0.01, (***) P < 0.001; abbreviations as for Figure 4B. (B) Selected GO biological processes significantly overrepresented (one-sided Fisher's exact tests, BH adjusted P-values < 0.05) in genes that contained significantly RBFOX2-regulated SE events in mature mTEC. (C) Three examples of significantly (FDR < 0.05) RBFOX2-regulated splicing events in mature mTEC. Fn1 and Insr are known RBFOX target genes (Chen and Manley 2009; Weyn-Vanhentenryck et al. 2014). Myom2 is an example of a non-Aire TRA gene. (D) Enrichment of the RBFOX recognition motif (M159/M017) (Ray et al. 2013) in the sequences surrounding exons that were found to be significantly regulated by RBFOX2 in mature mTEC (Supplemental Fig. 18B). The lines show enrichments for sets of exons found to be enhanced (blue), repressed (red), or not significantly regulated (green) by RBFOX2. Thicker lines indicate regions of statistically significant enrichment (FDR ≤ 0.05, n = 1000 permutations).

References

    1. Abramson J, Anderson G. 2017. Thymic epithelial cells. Annu Rev Immunol 35: 85–118. 10.1146/annurev-immunol-051116-052320 - DOI - PubMed
    1. Abramson J, Goldfarb Y. 2016. AIRE: from promiscuous molecular partnerships to promiscuous gene expression. Eur J Immunol 46: 22–33. 10.1002/eji.201545792 - DOI - PubMed
    1. Abramson J, Giraud M, Benoist C, Mathis D. 2010. Aire's partners in the molecular control of immunological tolerance. Cell 140: 123–135. 10.1016/j.cell.2009.12.030 - DOI - PubMed
    1. Alamancos GP, Pagès A, Trincado JL, Bellora N, Eyras E. 2015. Leveraging transcript quantification for fast computation of alternative splicing profiles. RNA 21: 1521–1531. 10.1261/rna.051557.115 - DOI - PMC - PubMed
    1. Anderson AC, Nicholson LB, Legge KL, Turchin V, Zaghouani H, Kuchroo VK. 2000. High frequency of autoreactive myelin proteolipid protein-specific T cells in the periphery of naive mice: mechanisms of selection of the self-reactive repertoire. J Exp Med 191: 761–770. 10.1084/jem.191.5.761 - DOI - PMC - PubMed

Publication types