. 2021 Oct 14;12(1):6012.
doi: 10.1038/s41467-021-26271-2.

Spatial deconvolution of HER2-positive breast cancer delineates tumor-associated cell type interactions

Affiliations

Spatial deconvolution of HER2-positive breast cancer delineates tumor-associated cell type interactions

Alma Andersson et al. Nat Commun. .

Abstract

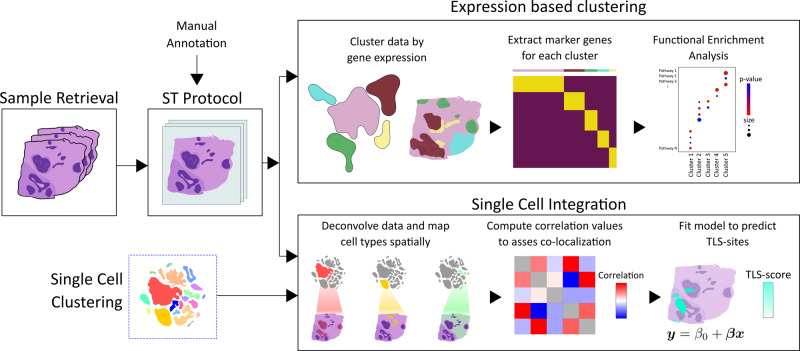
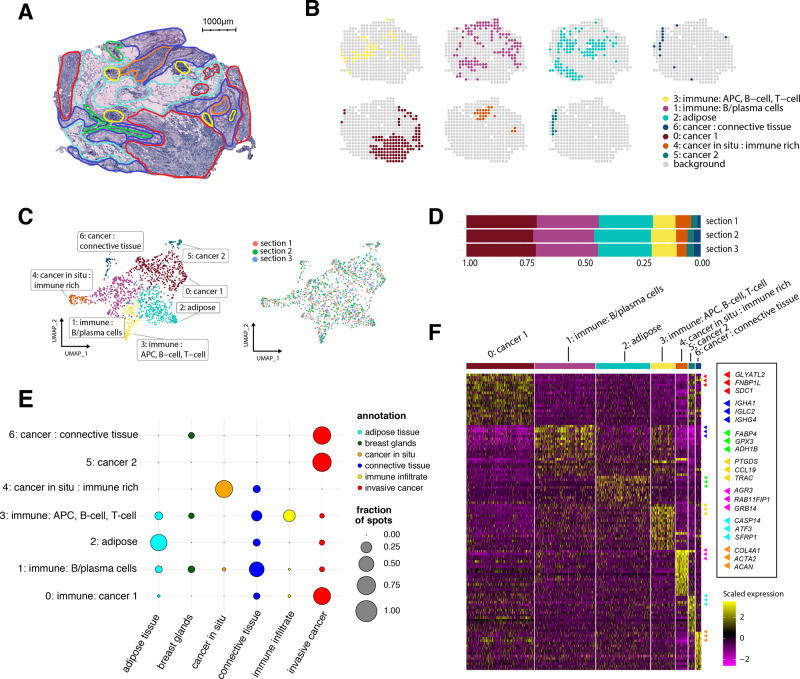
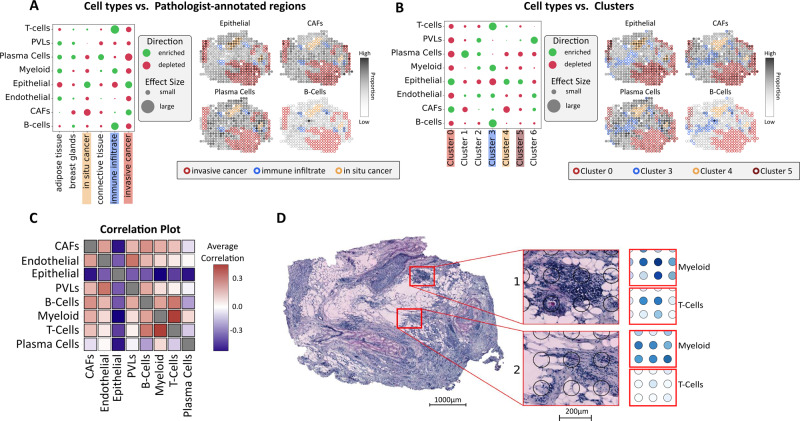
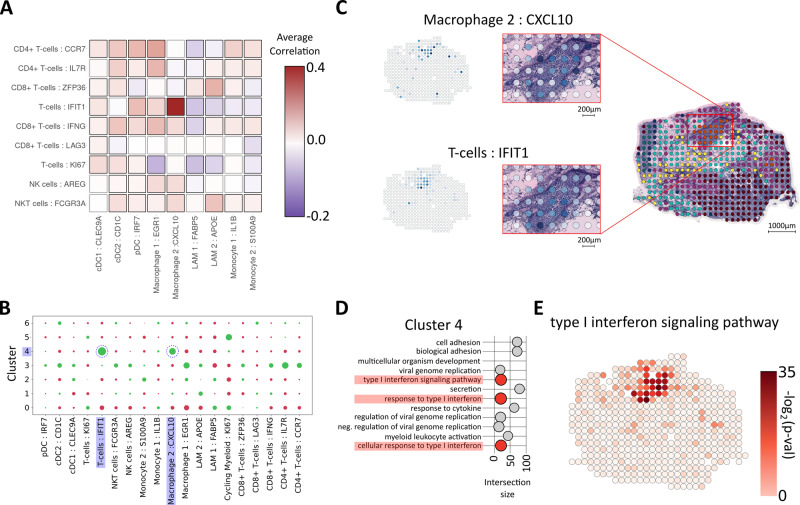
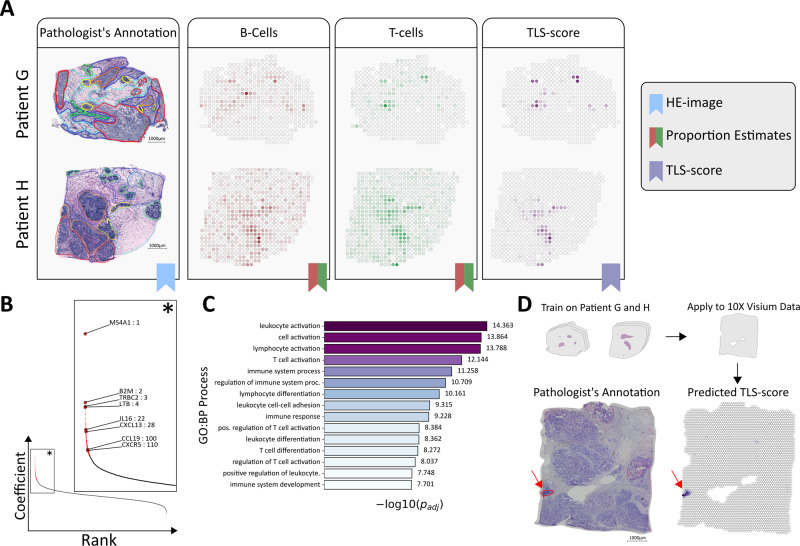
In the past decades, transcriptomic studies have revolutionized cancer treatment and diagnosis. However, tumor sequencing strategies typically result in loss of spatial information, critical to understand cell interactions and their functional relevance. To address this, we investigate spatial gene expression in HER2-positive breast tumors using Spatial Transcriptomics technology. We show that expression-based clustering enables data-driven tumor annotation and assessment of intra- and interpatient heterogeneity; from which we discover shared gene signatures for immune and tumor processes. By integration with single cell data, we spatially map tumor-associated cell types to find tertiary lymphoid-like structures, and a type I interferon response overlapping with regions of T-cell and macrophage subset colocalization. We construct a predictive model to infer presence of tertiary lymphoid-like structures, applicable across tissue types and technical platforms. Taken together, we combine different data modalities to define a high resolution map of cellular interactions in tumors and provide tools generalizing across tissues and diseases.


Conflict of interest statement

A.A., L.L., L.S., C.E, J.F., and J.L. are scientific consultants for 10x Genomics Inc., providing spatially barcoded slides. The remaining authors declare no competing interests.

Figures

Fig. 1
Fig. 1. Overview of study.
After sample retrieval, we performed ST (Spatial Transcriptomics) on 36 sections confirmed to be HER2-positive. A trained pathologist manually annotated one section from each sample. Expression-based clustering and single-cell data integration were applied to explore the spatial expression profiles and cell type interactions in our data. Marker genes were extracted for each of the clusters and subjected to functional enrichment analysis, which allowed us to biologically annotate them. By deconvolving the expression profiles in each spot with the single-cell data, we could infer patterns of cell state colocalization and design a model for the prediction of tertiary lymphoid-like (TL-like) structures. The single-cell data and its associated cell annotations originate from an external source also examining HER2-positive tumor samples.
Fig. 2
Fig. 2. Results from the expression-based analysis of patient G.
A Morphological regions were annotated by a pathologist into six distinct categories: adipose tissue (cyan), breast glands (green), in situ cancer (orange), connective tissue (blue), immune infiltrate (yellow), and invasive cancer (red). B Split view of each expression-based cluster’s distribution across one tissue section. C UMAP embedding of all spots (n = 446) from the three replicates, markers are colored based on cluster identity. D Proportions of spots assigned to each cluster across the three replicates. E Dot plot showing the overlap between clusters and annotated regions. The size of the dots represents the proportion of cluster spots belonging to an annotated region. The pathologist’s annotations are given on the x axis, cluster annotations on the y axis. F. Heatmap of the clusters and the most highly differentially expressed genes. Each cluster was annotated based on its association with morphological regions and marker genes. Heatmap colors represent normalized and scaled expression values. APC stands for antigen-presenting cell.
Fig. 3
Fig. 3. Spatial mapping of cell types from scRNA-seq data.
A Enrichment (green) and depletion (red) of major tier cell types in the regions defined by the pathologist (patient G), along with proportion estimates of different cell types (e.g., epithelial, CAFs, plasma cells, and B cells). Spot annotations are indicated by border colors, included regions are: in situ cancer (orange), invasive cancer (red) and immune infiltrate (blue). B Similar to A but with the regions defined by the expression-based clusters. C Correlation plot of all cell types within the major tier across all 36 sections and patients, a distinct correlation between myeloid cells and T cells can be observed. D Proportions of myeloid cells and T cells showing one area with higher (1), respectively, lower (2) degree of colocalization. All presented results are associated with patient G, except for subfigure C where correlation values are computed across all patients. CAFs cancer-associated fibroblasts, PVLs perivascular-like cells.
Fig. 4
Fig. 4. Colocalization of myeloid cells and T cells.
A Correlation plot of T- and myeloid cell subsets showing a distinct correlation between the T-cell:IFIT1 and Mø2:CXCL10 (macrophage 2:CXCL10) subsets across all patients. B Enrichment (green) and depletion (red) of subsets of T- and myeloid cells in each expression-based cluster, highlighting the presence of the correlated cell types T-cell:IFIT1 subset and Mø2 within cluster 4 of patient G (pGc4). C Proportion estimates for T-cell:IFIT1 subset and Mø2 in pGc4. D Pathways enriched by marker genes for pGc4, type I interferon signaling pathways are highlighted in red. Intersection size is equivalent to the number of overlapping terms between pGc4 marker genes and the given pathway. E Spot-wise enrichment of a type I interferon signaling pathway (GO:0060337) visualized on patient G, the p values which the enrichment scores are based on were computed using a two-sided Fisher’s exact test (Methods), no adjustment for multiple hypothesis testing was applied since a single hypothesis is tested in each spot (enriched or not enriched).
Fig. 5
Fig. 5. Inference and prediction of tertiary lymphoid-like Structures.
A Proportion estimate of B and T cells together with the computed TLS score (tertiary lymphoid structure) for patients G and H, annotated Hematoxylin and Eosin (HE) images are included for reference. B Rank-plot (coefficient value vs. rank) of the fitted model, genes included in the TLS signature are indicated by red; the zoom-in (*) shows the rank TLS-associated genes. C Top 15 pathways of which the TLS signature showed enrichment of, ranked according to the adjusted p value (as provided by g:Profiler). D Predicted TLS score for the 10x GenomicsTM Visium breast cancer data set, using the model trained on patient G and H. Pathologist’s annotation for likely TLS-sites (red) are included as a reference. Scale bars represent 1000 μm.

References

    1. Gonzalez Castro LN, Tirosh I, Suvà ML. Decoding cancer biology one cell at a time. Cancer Discov. 2021;11:960–970. doi: 10.1158/2159-8290.CD-20-1376. - DOI - PMC - PubMed
    1. Ren, X. et al. Insights gained from single-cell analysis of immune cells in the tumor microenvironment. Annu. Rev. Immunol. 39, 583–609 (2021). - PubMed
    1. Ding S, Chen X, Shen K. Single-cell RNA sequencing in breast cancer: Understanding tumor heterogeneity and paving roads to individualized therapy. Cancer Commun. 2020;40:329–344. doi: 10.1002/cac2.12078. - DOI - PMC - PubMed
    1. Puram SV, et al. Single-cell transcriptomic analysis of primary and metastatic tumor ecosystems in head and neck cancer. Cell. 2017;171:1611–1624. doi: 10.1016/j.cell.2017.10.044. - DOI - PMC - PubMed
    1. Karaayvaz M, et al. Unravelling subclonal heterogeneity and aggressive disease states in TNBC through single-cell RNA-seq. Nat. Commun. 2018;9:3588. doi: 10.1038/s41467-018-06052-0. - DOI - PMC - PubMed

Publication types