Spatio-temporal patterns of childhood pneumonia in Bhutan: a Bayesian analysis
- PMID: 34650108
- PMCID: PMC8516968
- DOI: 10.1038/s41598-021-99137-8
Spatio-temporal patterns of childhood pneumonia in Bhutan: a Bayesian analysis
Erratum in
-
Author Correction: Spatio-temporal patterns of childhood pneumonia in Bhutan: a Bayesian analysis.Sci Rep. 2021 Nov 15;11(1):22549. doi: 10.1038/s41598-021-01075-y. Sci Rep. 2021. PMID: 34782639 Free PMC article. No abstract available.
Abstract
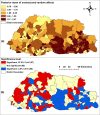
Pneumonia is one of the top 10 diseases by morbidity in Bhutan. This study aimed to investigate the spatial and temporal trends and risk factors of childhood pneumonia in Bhutan. A multivariable Zero-inflated Poisson regression model using a Bayesian Markov chain Monte Carlo simulation was undertaken to quantify associations of age, sex, altitude, rainfall, maximum temperature and relative humidity with monthly pneumonia incidence and to identify the underlying spatial structure of the data. Overall childhood pneumonia incidence was 143.57 and 10.01 per 1000 persons over 108 months of observation in children aged < 5 years and 5-14 years, respectively. Children < 5 years or male sex were more likely to develop pneumonia than those 5-14 years and females. Each 1 °C increase in maximum temperature was associated with a 1.3% (95% (credible interval [CrI] 1.27%, 1.4%) increase in pneumonia cases. Each 10% increase in relative humidity was associated with a 1.2% (95% CrI 1.1%, 1.4%) reduction in the incidence of pneumonia. Pneumonia decreased by 0.3% (CrI 0.26%, 0.34%) every month. There was no statistical spatial clustering after accounting for the covariates. Seasonality and spatial heterogeneity can partly be explained by the association of pneumonia risk to climatic factors including maximum temperature and relative humidity.
© 2021. The Author(s).
Conflict of interest statement
The authors declare no competing interests.
Figures


References
-
- WHO . Pneumonia, The Forgotten Killer of Children. UNICEF/WHO; 2006.
-
- WHO. Pneumonia. https://www.who.int/en/news-room/fact-sheets/detail/pneumonia (2019).
-
- Institute for Health Metrics and Evaluation (IHME) Findings from the Global Burden of Disease Study. Institute for Health Metrics and Evaluation (IHME); 2018.
-
- (IVAC), I. V. A. C. 1–42 (Johns Hopkins Bloomberg School of Public Health, 2015).
MeSH terms
LinkOut - more resources
Full Text Sources
Medical

