

The beta component of gamma-band auditory steady-state responses in patients with schizophrenia
- PMID: 34650135
- PMCID: PMC8516862
- DOI: 10.1038/s41598-021-99793-w
The beta component of gamma-band auditory steady-state responses in patients with schizophrenia
Abstract
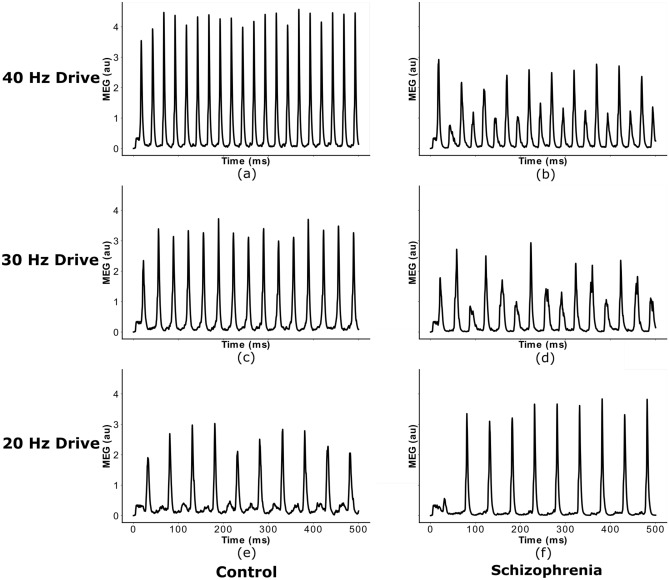
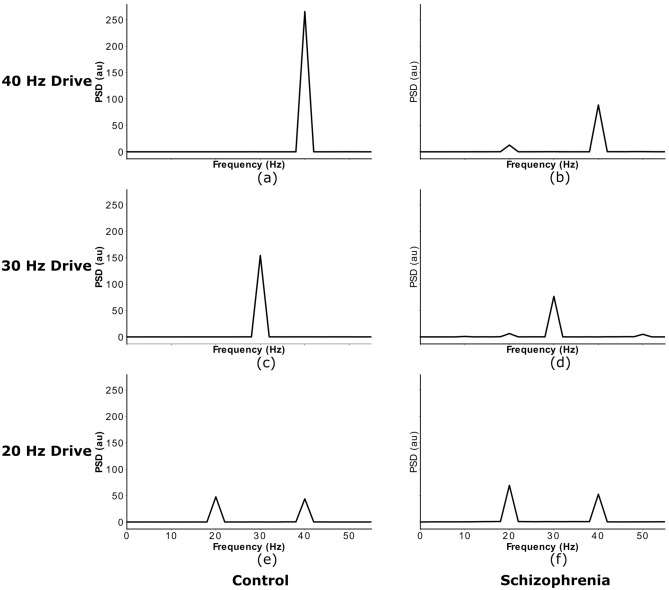
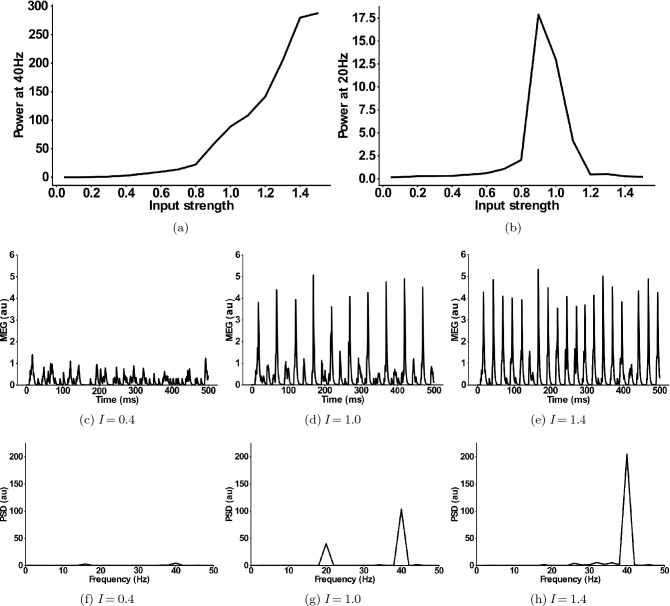
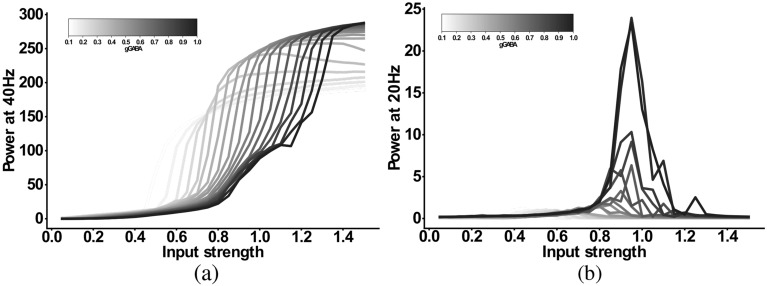
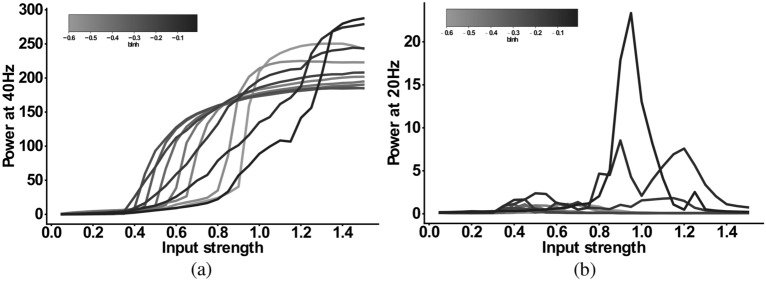
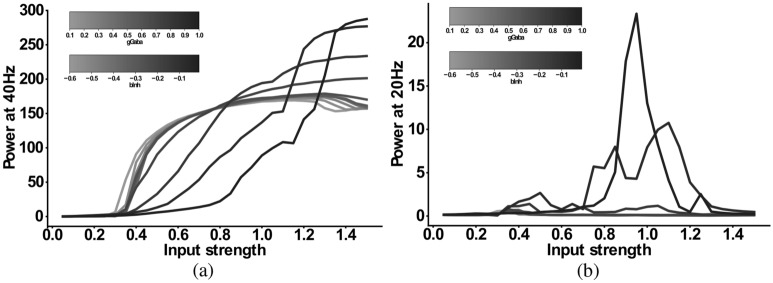
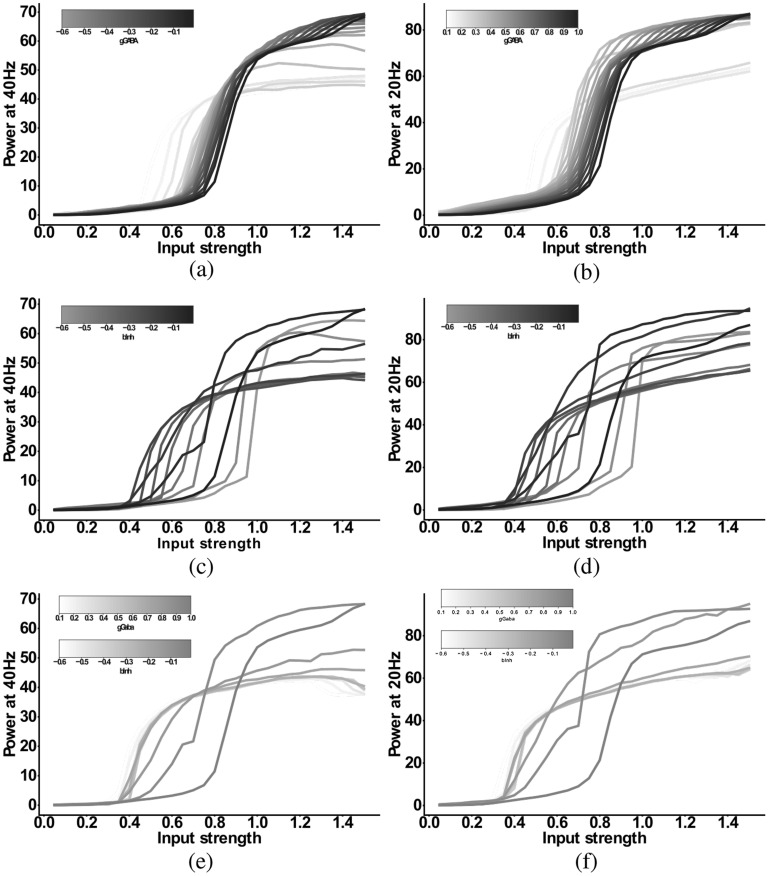
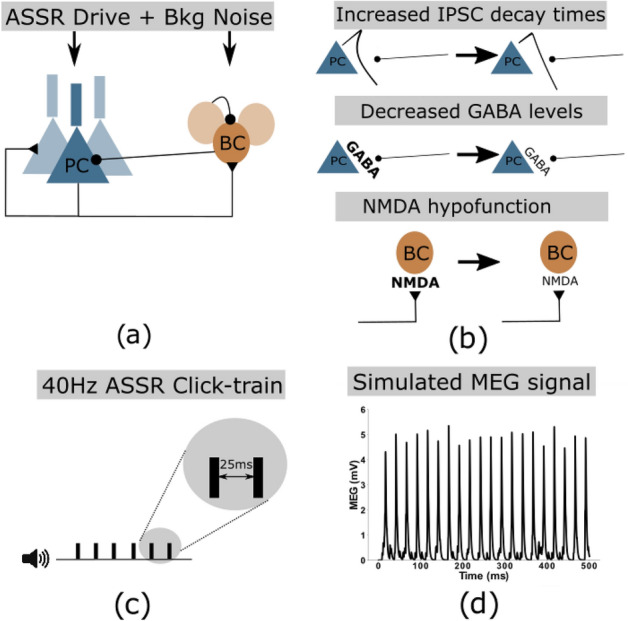
The mechanisms underlying circuit dysfunctions in schizophrenia (SCZ) remain poorly understood. Auditory steady-state responses (ASSRs), especially in the gamma and beta band, have been suggested as a potential biomarker for SCZ. While the reduction of 40 Hz power for 40 Hz drive has been well established and replicated in SCZ patients, studies are inconclusive when it comes to an increase in 20 Hz power during 40 Hz drive. There might be several factors explaining the inconsistencies, including differences in the sensitivity of the recording modality (EEG vs MEG), differences in stimuli (click-trains vs amplitude-modulated tones) and large differences in the amplitude of the stimuli. Here, we used a computational model of ASSR deficits in SCZ and explored the effect of three SCZ-associated microcircuit alterations: reduced GABA activity, increased GABA decay times and NMDA receptor hypofunction. We investigated the effect of input strength on gamma (40 Hz) and beta (20 Hz) band power during gamma ASSR stimulation and saw that the pronounced increase in beta power during gamma stimulation seen experimentally could only be reproduced in the model when GABA decay times were increased and only for a specific range of input strengths. More specifically, when the input was in this specific range, the rhythmic drive at 40 Hz produced a strong 40 Hz rhythm in the control network; however, in the 'SCZ-like' network, the prolonged inhibition led to a so-called 'beat-skipping', where the network would only strongly respond to every other input. This mechanism was responsible for the emergence of the pronounced 20 Hz beta peak in the power spectrum. The other two microcircuit alterations were not able to produce a substantial 20 Hz component but they further narrowed the input strength range for which the network produced a beta component when combined with increased GABAergic decay times. Our finding that the beta component only existed for a specific range of input strengths might explain the seemingly inconsistent reporting in experimental studies and suggests that future ASSR studies should systematically explore different amplitudes of their stimuli. Furthermore, we provide a mechanistic link between a microcircuit alteration and an electrophysiological marker in schizophrenia and argue that more complex ASSR stimuli are needed to disentangle the nonlinear interactions of microcircuit alterations. The computational modelling approach put forward here is ideally suited to facilitate the development of such stimuli in a theory-based fashion.
© 2021. The Author(s).
Conflict of interest statement
The authors declare no competing interests.
Figures
Similar articles
-
Test-retest reliability of time-frequency measures of auditory steady-state responses in patients with schizophrenia and healthy controls.Neuroimage Clin. 2019;23:101878. doi: 10.1016/j.nicl.2019.101878. Epub 2019 Jun 5. Neuroimage Clin. 2019. PMID: 31228795 Free PMC article.
-
Spontaneous Gamma Activity in Schizophrenia.JAMA Psychiatry. 2015 Aug;72(8):813-21. doi: 10.1001/jamapsychiatry.2014.2642. JAMA Psychiatry. 2015. PMID: 25587799 Free PMC article.
-
The 40-Hz Auditory Steady-State Response in Patients With Schizophrenia: A Meta-analysis.JAMA Psychiatry. 2016 Nov 1;73(11):1145-1153. doi: 10.1001/jamapsychiatry.2016.2619. JAMA Psychiatry. 2016. PMID: 27732692
-
Neuronal imbalance of excitation and inhibition in schizophrenia: a scoping review of gamma-band ASSR findings.Psychiatry Clin Neurosci. 2022 Dec;76(12):610-619. doi: 10.1111/pcn.13472. Epub 2022 Oct 13. Psychiatry Clin Neurosci. 2022. PMID: 36069299
-
The 40-Hz auditory steady-state response in bipolar disorder: A meta-analysis.Clin Neurophysiol. 2022 Sep;141:53-61. doi: 10.1016/j.clinph.2022.06.014. Epub 2022 Jul 6. Clin Neurophysiol. 2022. PMID: 35853310
Cited by
-
Data-driven multiscale model of macaque auditory thalamocortical circuits reproduces in vivo dynamics.Cell Rep. 2023 Nov 28;42(11):113378. doi: 10.1016/j.celrep.2023.113378. Epub 2023 Nov 3. Cell Rep. 2023. PMID: 37925640 Free PMC article.
-
The 40-Hz auditory steady-state response enhanced by beta-band subharmonics.Front Neurosci. 2023 Feb 24;17:1127040. doi: 10.3389/fnins.2023.1127040. eCollection 2023. Front Neurosci. 2023. PMID: 36908794 Free PMC article.
-
Auditory steady-state response deficits in Fragile X Syndrome implicate deficits in stimulus representation maintenance and GABAergic modulation.medRxiv [Preprint]. 2025 Jan 31:2025.01.29.25321365. doi: 10.1101/2025.01.29.25321365. medRxiv. 2025. PMID: 39973986 Free PMC article. Preprint.
-
Common Genomic and Proteomic Alterations Related to Disturbed Neural Oscillatory Activity in Schizophrenia.Int J Mol Sci. 2025 Aug 4;26(15):7514. doi: 10.3390/ijms26157514. Int J Mol Sci. 2025. PMID: 40806641 Free PMC article. Review.
-
Exploring global and local processes underlying alterations in resting-state functional connectivity and dynamics in schizophrenia.Front Psychiatry. 2024 Feb 13;15:1352641. doi: 10.3389/fpsyt.2024.1352641. eCollection 2024. Front Psychiatry. 2024. PMID: 38414495 Free PMC article.
References
Publication types
MeSH terms
LinkOut - more resources
Full Text Sources
Medical
