. 2021 Oct 14;11(1):20407.
doi: 10.1038/s41598-021-99538-9.

Early prediction of developing spontaneous activity in cultured neuronal networks

Affiliations

Early prediction of developing spontaneous activity in cultured neuronal networks

David Cabrera-Garcia et al. Sci Rep. .

Abstract

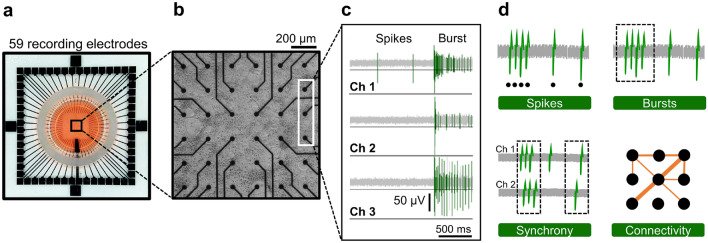
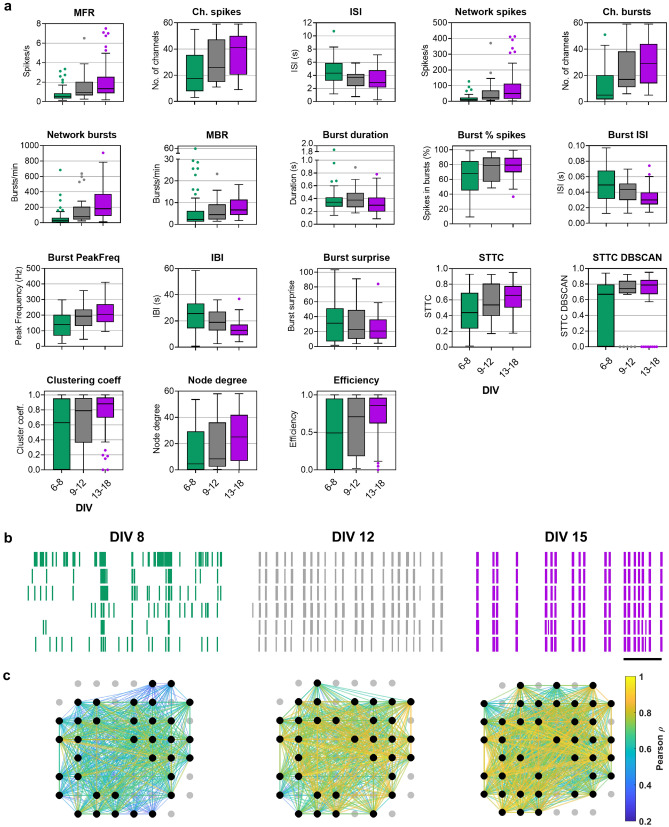
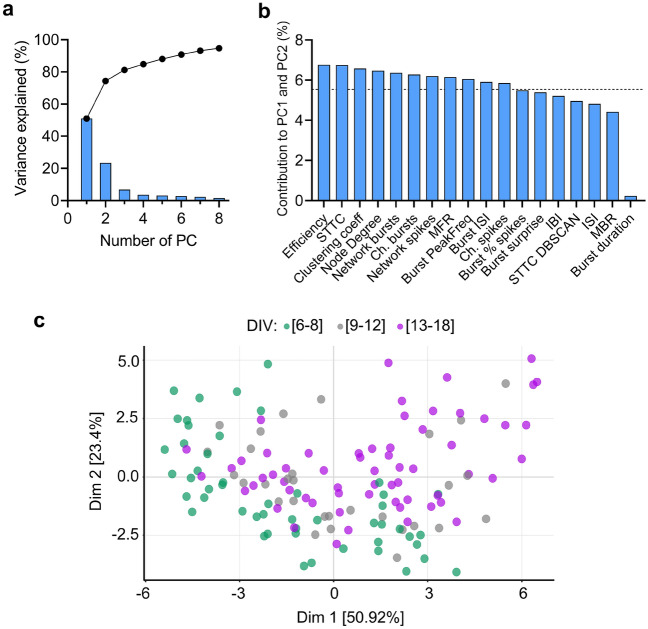
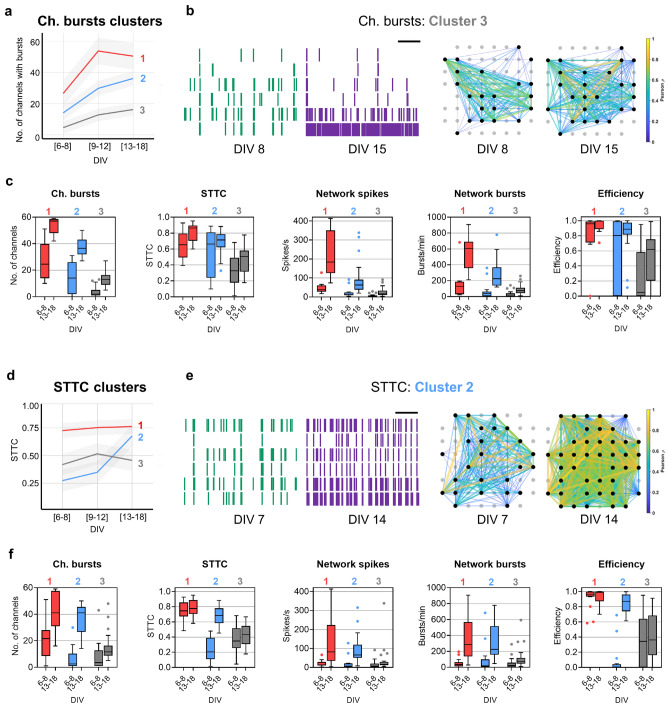
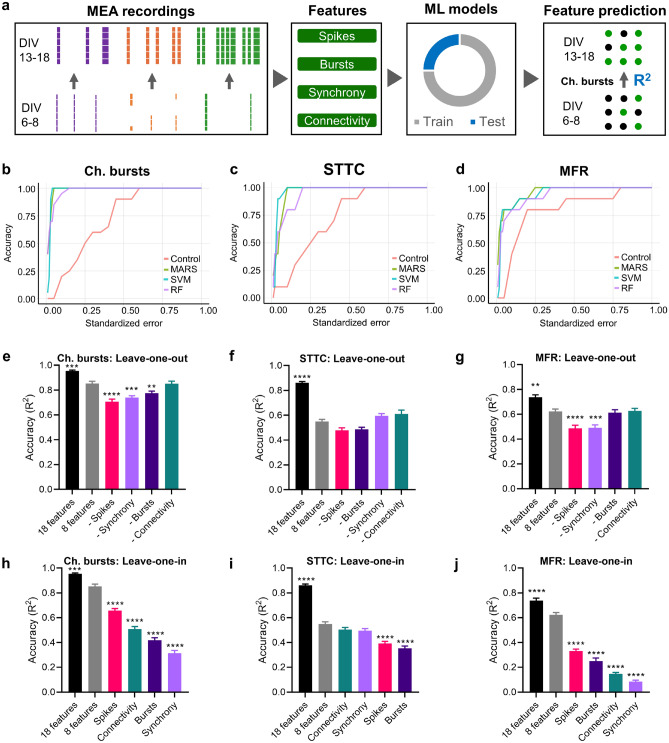
Synchronization and bursting activity are intrinsic electrophysiological properties of in vivo and in vitro neural networks. During early development, cortical cultures exhibit a wide repertoire of synchronous bursting dynamics whose characterization may help to understand the parameters governing the transition from immature to mature networks. Here we used machine learning techniques to characterize and predict the developing spontaneous activity in mouse cortical neurons on microelectrode arrays (MEAs) during the first three weeks in vitro. Network activity at three stages of early development was defined by 18 electrophysiological features of spikes, bursts, synchrony, and connectivity. The variability of neuronal network activity during early development was investigated by applying k-means and self-organizing map (SOM) clustering analysis to features of bursts and synchrony. These electrophysiological features were predicted at the third week in vitro with high accuracy from those at earlier times using three machine learning models: Multivariate Adaptive Regression Splines, Support Vector Machines, and Random Forest. Our results indicate that initial patterns of electrical activity during the first week in vitro may already predetermine the final development of the neuronal network activity. The methodological approach used here may be applied to explore the biological mechanisms underlying the complex dynamics of spontaneous activity in developing neuronal cultures.


Conflict of interest statement

The authors declare no competing interests.

Figures

Figure 1
Figure 1
Electrophysiological characterization of cortical neuron cultures on MEAs. (a) Photograph of a 60 electrode MEA device used in the study. (b) Phase-contrast image of cortical neurons in culture at DIV 14. The distance between electrodes is 200 µm. Each black dot corresponds to one of the recording electrodes. (c) Sample traces of spontaneous electrical activity recorded by three channels. Electrical events, spikes and bursts, that crossed a threshold (horizontal black line) were recorded. (d) Spontaneous activity of cortical neurons was analyzed according to electrophysiological features of spikes, bursts, synchrony, and connectivity. The figure was created using MC_Rack 4.6 (https://www.multichannelsystems.com/software/mc-rack) (c) and Microsoft PowerPoint 365 (https://www.microsoft.com/powerpoint) (d).
Figure 2
Figure 2
Development of spontaneous activity of cortical neurons in culture during the first three weeks in vitro. (a) Analysis of 18 electrophysiological features of neuronal network activity at DIV intervals: 6–8 (n = 50), 9–12 (n = 30), and 13–18 (n = 61). The box plots show the median and the interquartile range with Tukey whiskers. Description of features is provided in Table S1 and p-values for (a) are reported in Table S2. (b) Raster plots show the spontaneous activity recorded by 6 electrodes from a representative neuronal network at DIV 8, 12, and 15 with an archetypical increase of spontaneous activity and synchrony with days in culture. Vertical lines correspond to spikes. Horizontal scale bar, 20 s. (c) Maps of functional connectivity of the same neuronal network and period as in (b). The color of the connections (edges) between electrodes (nodes) represents Pearson’s correlation and shows a general increase in connectivity during early development. The figure was created using Graphpad 8.0 (https://www.graphpad.com) (a), Neuroexplorer 5 (https://plexon.com/products/neuroexplorer/) (b), and Matlab 9.8 (https://www.mathworks.com/products/matlab.html) (c).
Figure 3
Figure 3
Principal Component Analysis (PCA) of electrophysiological features of neuronal network activity in vitro. (a) The graph shows the percentage of variance explained by each principal component (PC) (bars) and the cumulative percentage of variance (dots) by the number of PCs. (b) Bar plot displays the contribution (%) of each of the 18 electrophysiological features to the PC1 and PC2. The dotted line represents the significant contribution value (5.55%) for the first two PCs. (c) Scatter plot of MEA recordings grouped by DIV intervals in the 2-dimensional PCA based on the 18 electrophysiological features. PC 1 (x-axis) and PC2 (y-axis) captured 74.3% of the total variance and each dot represents a time point recording within each DIV interval: 6–8 (green), 9–12 (gray), and 13–18 (purple) DIV. A gradient from young (DIV 6–8) to mature neuronal networks (DIV 13–18) is captured by the PCA projection: 38.3% of DIV 13–18 recordings are in the positive plane of PC1 and PC2 dimensions while no DIV 6–8 recordings are in the same PC area. The figure was created using Graphpad 8.0 (https://www.graphpad.com) (a,b), and R 4.03 (https://www.r-project.org/) (c).
Figure 4
Figure 4
Patterns of developing spontaneous activity in neuronal networks using clustering analysis. (a,d) Graphs display three developmental patterns for the features of Ch. bursts (a) and STTC identified by k-means clustering of the SOM. The lines represent the means of the observations, labelled by k-means, and the shaded areas represent the 95% confidence intervals. (b,e) Examples of raster plots (left panels) and connectivity maps (right panels) of neuronal networks included in either cluster 3 of Ch. bursts (b) or cluster 2 of STTC (e). Horizontal scale bar in raster plots, 20 s. Color of the edges between nodes in connectivity maps represents Pearson’s correlation. (c,f) Changes in Ch. bursts, STTC, Network spikes, Network bursts, and Efficiency between DIV 6–8 and 13–18 in each cluster of Ch. bursts (c) and STTC (f). The box plots show the median and the interquartile range with Tukey whiskers. Clusters are indicated on top of the graphs. The figure was created using Graphpad 8.0 (https://www.graphpad.com) (c,f), Neuroexplorer 5 (https://plexon.com/products/neuroexplorer/), Matlab 9.8 (https://www.mathworks.com/products/matlab.html) (b,e), and R 4.03 (https://www.r-project.org/) (a, d).
Figure 5
Figure 5
Machine learning for the prediction of features of bursts, synchrony, and spikes. (a) Schematics of the machine learning workflow. The 18 electrophysiological features were analyzed from MEA recordings at DIV 6–8 and DIV 13–18 and these features were used to train (gray segment) machine learning (ML) models. Then, accuracy prediction (R2) at DIV 13–18 was evaluated in the test dataset (blue segment) for electrophysiological features (e.g., Ch. bursts). Figure created with Microsoft PowerPoint 365 (https://www.microsoft.com/powerpoint). (bd). REC curves for control and MARS, SVM, and Random Forest (RF) machine learning models for the prediction of STTC (b), Ch. bursts (c), and MFR (d). REC curves represent the cumulative error obtained by the machine learning models. (e-j) SVM prediction of Ch. bursts (eh), STTC (fi), and MFR (gj) using leave-one-out (eg) and leave-one-in (hj) strategies. We performed fourfold cross-validation (10 iterations) to calculate the mean accuracy of the SVM prediction using 8 electrophysiological features (2 features per group): MFR and Ch. spikes (spikes), MBR and Ch. bursts (bursts), STTC and DBSCAN STTC (synchrony), and Efficiency and Clustering coeff (connectivity). Feature importance was evaluated by removing (leave-one-out) or leaving (leave-one-in) one group of features. Baseline accuracy of cross-validation was calculated using the 18 features. Error bars represent the mean ± SEM. *P < 0.05, **P < 0.01, ***P < 0.001, ****P < 0.0001 vs accuracy obtained with 8 features (one-way ANOVA, followed by Dunnett’s post hoc multiple comparison test). The figure was created using Microsoft PowerPoint 365 (https://www.microsoft.com/powerpoint) (a), R 4.03 (https://www.r-project.org/) (b), and Graphpad 8.0 (https://www.graphpad.com) (ej).

References

    1. Izhikevich EM, Desai NS, Walcott EC, Hoppensteadt FC. Bursts as a unit of neural information: Selective communication via resonance. Trends Neurosci. 2003;26:161–167. doi: 10.1016/S0166-2236(03)00034-1. - DOI - PubMed
    1. Salinas E, Sejnowski TJ. Correlated neuronal activity and the flow of neural information. Nat. Rev. Neurosci. 2001;2:539–550. doi: 10.1038/35086012. - DOI - PMC - PubMed
    1. Kepecs A, Lisman J. Information encoding and computation with spikes and bursts. Netw. Comput. Neural Syst. 2003;14:103–118. doi: 10.1080/net.14.1.103.118. - DOI - PubMed
    1. Khazipov R, Luhmann HJ. Early patterns of electrical activity in the developing cerebral cortex of humans and rodents. Trends Neurosci. 2006;29:414–418. doi: 10.1016/j.tins.2006.05.007. - DOI - PubMed
    1. Luhmann HJ, et al. Spontaneous neuronal activity in developing neocortical networks: From single cells to large-scale interactions. Front. Neural Circuits. 2016;10:1–14. doi: 10.3389/fncir.2016.00040. - DOI - PMC - PubMed

Publication types