. 2021 Oct 14;11(1):20434.
doi: 10.1038/s41598-021-99902-9.

Morphodynamics facilitate cancer cells to navigate 3D extracellular matrix

Affiliations

Morphodynamics facilitate cancer cells to navigate 3D extracellular matrix

Christopher Z Eddy et al. Sci Rep. .

Erratum in

Abstract

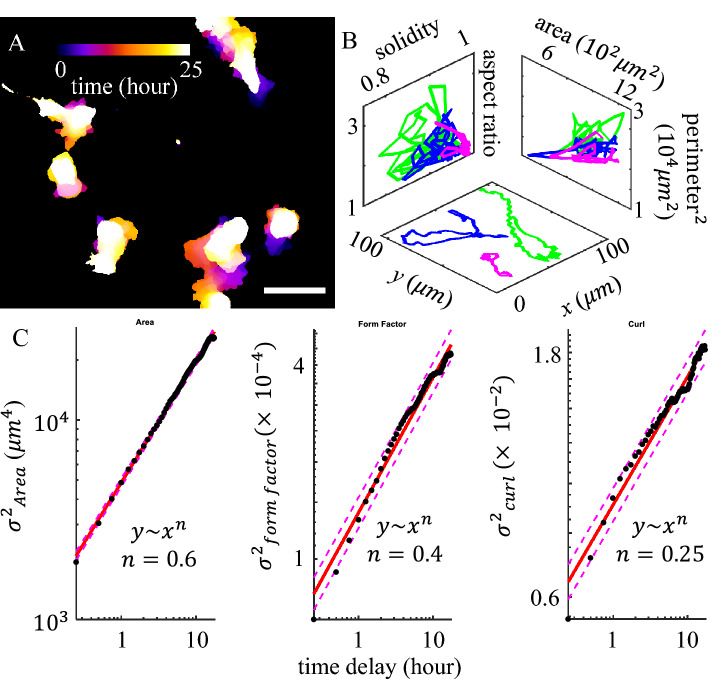
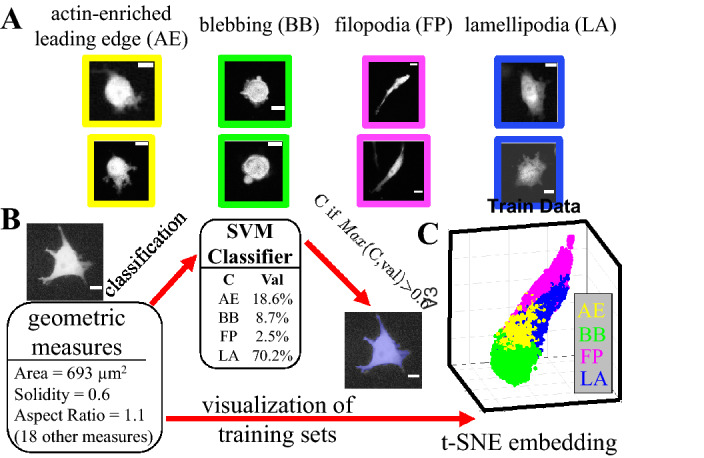
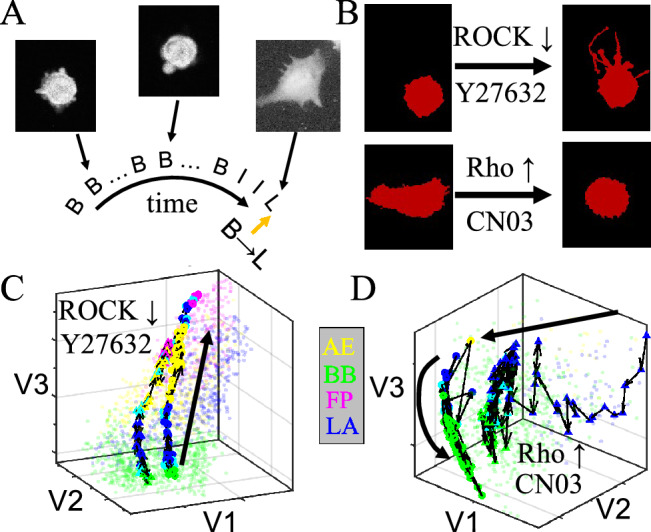
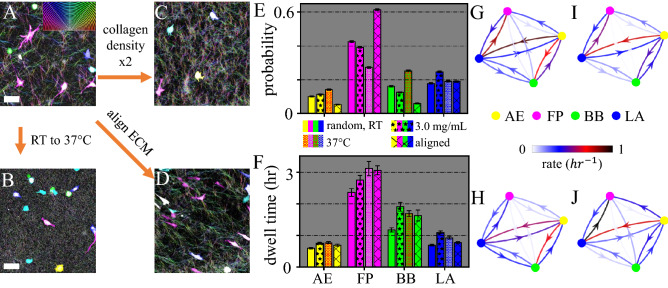
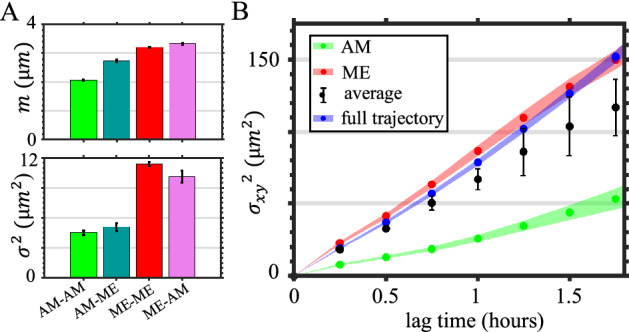
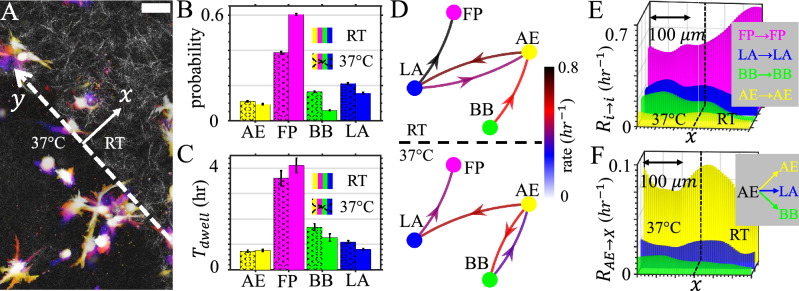
Cell shape is linked to cell function. The significance of cell morphodynamics, namely the temporal fluctuation of cell shape, is much less understood. Here we study the morphodynamics of MDA-MB-231 cells in type I collagen extracellular matrix (ECM). We systematically vary ECM physical properties by tuning collagen concentrations, alignment, and gelation temperatures. We find that morphodynamics of 3D migrating cells are externally controlled by ECM mechanics and internally modulated by Rho/ROCK-signaling. We employ machine learning to classify cell shape into four different morphological phenotypes, each corresponding to a distinct migration mode. As a result, we map cell morphodynamics at mesoscale into the temporal evolution of morphological phenotypes. We characterize the mesoscale dynamics including occurrence probability, dwell time and transition matrix at varying ECM conditions, which demonstrate the complex phenotype landscape and optimal pathways for phenotype transitions. In light of the mesoscale dynamics, we show that 3D cancer cell motility is a hidden Markov process whereby the step size distributions of cell migration are coupled with simultaneous cell morphodynamics. Morphological phenotype transitions also facilitate cancer cells to navigate non-uniform ECM such as traversing the interface between matrices of two distinct microstructures. In conclusion, we demonstrate that 3D migrating cancer cells exhibit rich morphodynamics that is controlled by ECM mechanics, Rho/ROCK-signaling, and regulate cell motility. Our results pave the way to the functional understanding and mechanical programming of cell morphodynamics as a route to predict and control 3D cell motility.


Conflict of interest statement

The authors declare no competing interests.

Figures

Figure 1
Figure 1
Three-dimensional migration of MDA-MB-231 cells show significant cell shape fluctuation. (A) A typical time lapse recording of 25 h is projected onto a single image with colors representing time. (B) The real space (x–y plane), and shape fluctuations of 3 cells shown in (A). (C) The mean square displacement (σ2) of selected cell geometric measures. Dots: experimental measurements. Solid lines: linear fit. Dashed lines: 95% prediction interval. Here the form factor is defined as perimeter2/area. Curl is defined as the ratio between the major axis length and skeletonized contour length. This figure is prepared with Matlab R2020a (www.mathworks.com) and ImageJ (https://imagej.net).
Figure 2
Figure 2
Development of a supervised machine learning model to classify cells into morphological phenotypes corresponding to different migration modes. (A) MDA-MB-231 cells in 3D collagen matrices exhibit multiple morphological phenotypes that are characteristic of four distinct migration modes: actin-enriched leading edge (AE), small blebbing (BB), filopodial (FP), and lamellipodial (LA). Scale bars are 20 μm. (B) The cell images are quantified using a total of 21 geometric measures such as area, solidity, and aspect ratio. With 3800 manually labeled single cell images we have trained a supported vector machine (SVM) to calculate probability scores (Val) for a cell to belong to each morphological phenotypes (classes). We assign a cell to the class C with the maximum score (Max(Cval)), if this maximum score is greater than a threshold of 60% (Max(C,val)>0.6). We consider a cell to be at an intermediate state if none of the four classes have a score higher than 0.6. In (B) a sample cell image is classified as a lamellipodial cell (LA), because LA class has a score of greater than 0.6. (C) To better visualize the high dimensional geometric measures, we apply t-SNE method to generate a 3D projection of the geometric cell shape space. 15,000 unseen data set is presented here. Different morphological phenotypes are well separated. AE (yellow): actin-enriched leading edge. BB (green): small blebbing. FP (magenta): filopodial. LA (blue): lamellipodial. This figure is prepared with Matlab R2020a (www.mathworks.com) and ImageJ (https://imagej.net).
Figure 3
Figure 3
Rho/ROCK-signaling internally controls mesoscale morphodynamics of 3D cultured MDA-MB-231 cells. (A) A sample time series of morphological phenotype. Insets: three snapshots showing the GFP-labeled cell morphology. Abbreviations: B—blebbing, I—intermediate state, L—lamellipodial. (B) Representative morphological changes under treatment of Y27632 and CN03, which downregulates and upregulates Rho/ROCK signaling respectively. (C, D) Characteristic morphodynamic trajectories of cells in the t-SNE embedded shape space. The trajectories start immediately after introducing Y27632 or CN03, and ends after 12 h of incubating with the drugs. The forward time directions are shown as thick curves with arrows as guide to the eyes. Two representative trajectories (one with circular symbols, and another one with triangular symbols) per each treatment are shown as colored symbols connected by black lines, where color represents the instantaneous phenotype. Unconnected light-colored dots show training sets which are the same as in Fig. 2C. Note that to better visualize the 3D trajectories, coordinates have been rotated with respect to Fig. 2C. This figure is prepared with Matlab R2020a (www.mathworks.com) and ImageJ (https://imagej.net).
Figure 4
Figure 4
Physical properties of collagen ECM regulate the morphological phenotype homeostasis of 3D migrating MDA-MB-231 cells. (AD) Confocal reflection images and pseudo colored MDA-MB-231 cells for collagen matrices prepared at varying conditions. Scale bars: 20 μm. A Collagen ECM prepared at room temperature (RT, or 25 C) and collagen concentration of [col]=1.5 mg/mL. B Collagen ECM prepared at 37 C and [col] = 1.5 mg/mL. C Collagen ECM prepared at RT and [col]=3.0 mg/mL. D collagen ECM prepared with flow-aligned collagen fibers. (E) Fraction of cells in each morphological phenotype. 8000 single cell images are analyzed under each ECM condition. (F) Dwell time of cells in each morphological phenotype. Errorbars in (E, F) represent 95% confidence intervals calculated from 1000 bootstrap iterations. (GJ) The transition matrix—morphological phenotype transition rates under varying ECM conditions. G Collagen ECM prepared at room temperature and [col]=1.5 mg/mL. H Collagen ECM prepared at 37 C and [col]= 1.5 mg/mL. I Collagen ECM prepared at RT and [col] = 3.0 mg/mL. J Collagen ECM prepared with flow-aligned collagen fibers. Under each ECM condition a total of more than 2000 h of single cell trajectories are analyzed. This figure is prepared with Matlab R2020a (www.mathworks.com) and ImageJ (https://imagej.net).
Figure 5
Figure 5
Cancer cell migration in 3D ECM is coupled with morphological phenotype and phenotype transitions. (A) Means (m, upper panel) and variances (σ2, lower panel) of the step size distributions by fitting the experimental measurements with log-normal distribution. The steps are categorized based on morphological phenotype (coarse-grained as mesenchymal, amoeboidal and intermediate state) dynamics. ME: abbreviation for mesenchymal, which includes FP and LA states. AM: abbreviation for amoeboidal, which includes BB and AE states. If a cell makes a step by starting from AM state to ME state, the step is categorized as an AM-ME step. The starting and ending frames of steps are separated by 15 minutes. In (A) errorbars show the 95% confidence interval of fitted parameters. (B) Real-space (2D projection) mean square displacements (MSD) of cells. AM: the MSD of cells dwelling in the AM state. ME: the MSD of cells dwelling in the ME state. average: the weighted average of mean square displacements of AM, ME, and intermediate dwelling cells. The average is based on the occurrence fraction of AM, ME and intermediate state of cells. Full trajectory: the MSD obtained from entire cell trajectories regardless of the morphological phenotypes. Shaded areas in C show SEM. In (A-B) a total of 1974 hours of single cell trajectories are analyzed. The ECM are prepared at room-temperature with a concentration [col] = 1.5 mg/mL. This figure is prepared with Matlab R2020a (www.mathworks.com) and ImageJ (https://imagej.net).
Figure 6
Figure 6
Morphological phenotype transition facilitates cell migration in heterogeneous ECM. (A) Time-lapse projection of 3D migrating MDA-MB-231 cells navigating engineered heterogeneous ECM. The ECM contains two adjacent layers that are prepared at room temperature (RT) and 37 C respectively. A confocal reflection image shows the ECM structure next to the interface (dashed line, y-axis). Scale bar: 50 μm. (B) Fraction of cells of each morphological phenotype in both sides of the interface. (C) Dwell time of cells of each morphological phenotype in both sides of the interface. (D) Phenotype transition rates in both sides of the interface. (E) Spatial frequency of of dwell events. (F) Spatial frequency of AE to AE, AE to LA and AE to BB events. See main text for the definition of spatial frequency R(ij,x). In (E, F) dashed lines indicate the interface (x=0) separating the 37 C gel (left) and RT gel (right). A total of 3800 h of single cell recordings from three independent experiments have been used to calculate the results in (B–F). This figure is prepared with Matlab R2020a (www.mathworks.com) and ImageJ (https://imagej.net).

References

    1. Hooke R. Micrographia. The Royal Society; 1665.
    1. Mazzarello P. A unifying concept: The history of cell theory. Nat. Cell Biol. 1999;25:E13–E15. - PubMed
    1. Mayr E. The Growth of the Biological Thought. Belknap; 1982.
    1. Alberts B, et al. Molecular Biology of the Cell. Garland Science; 2014.
    1. Singhvi R, et al. Engineering cell shape and function. Science. 1994;264:696–698. - PubMed

Publication types