. 2021 Oct 14;4(1):1183.
doi: 10.1038/s42003-021-02691-0.

Matrigel 3D bioprinting of contractile human skeletal muscle models recapitulating exercise and pharmacological responses

Affiliations

Matrigel 3D bioprinting of contractile human skeletal muscle models recapitulating exercise and pharmacological responses

Angela Alave Reyes-Furrer et al. Commun Biol. .

Abstract

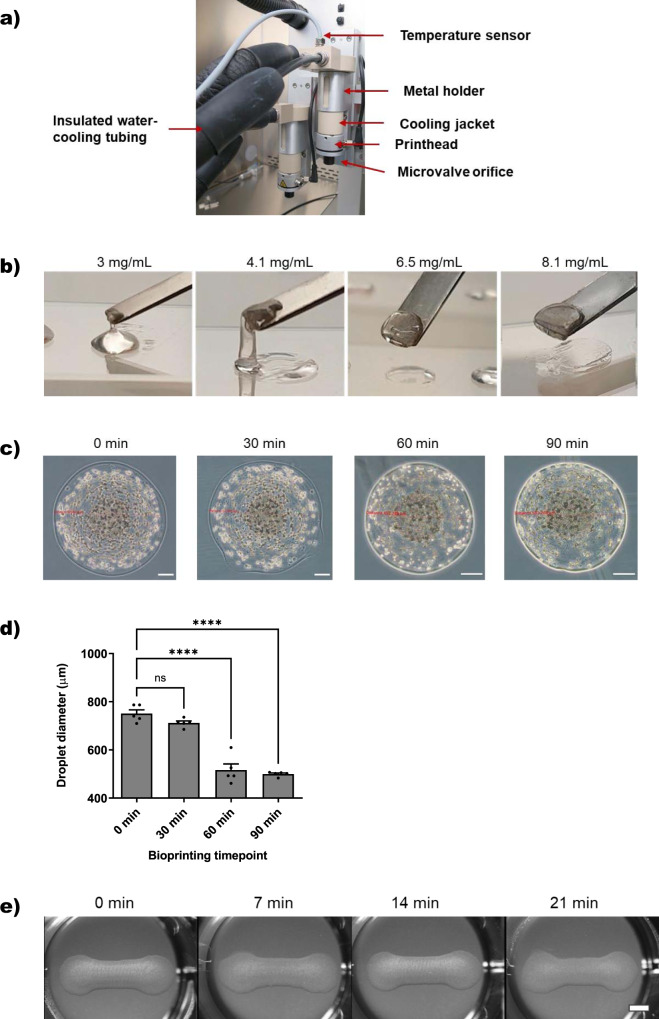
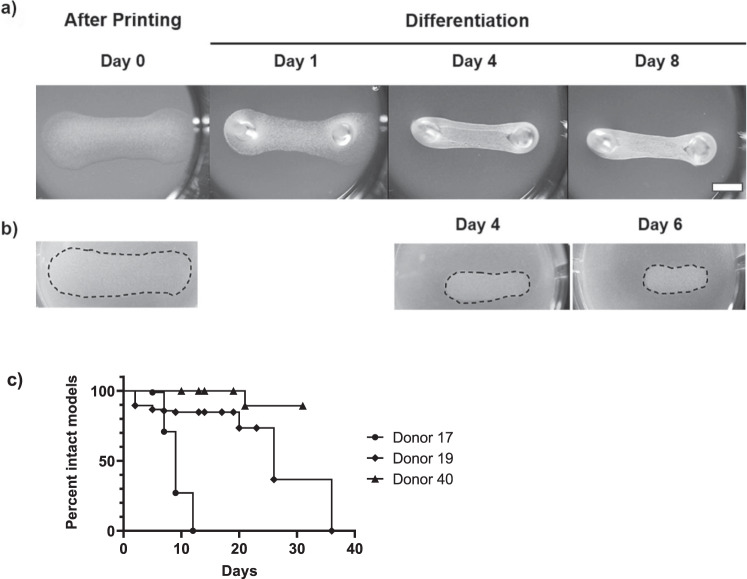
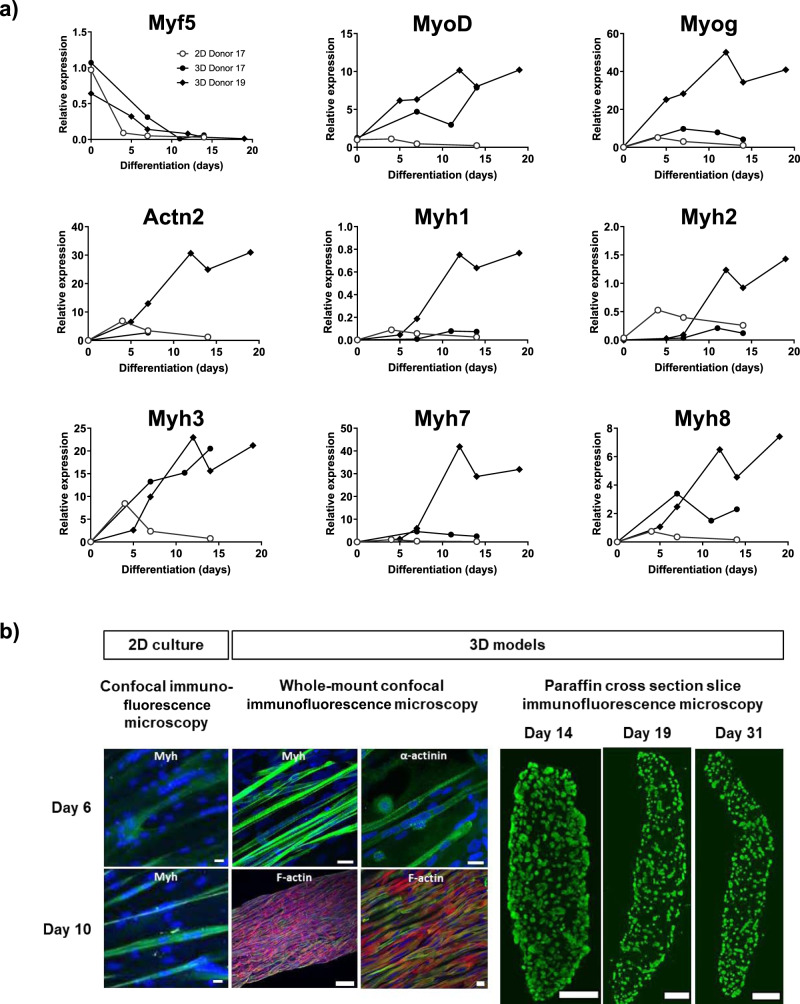
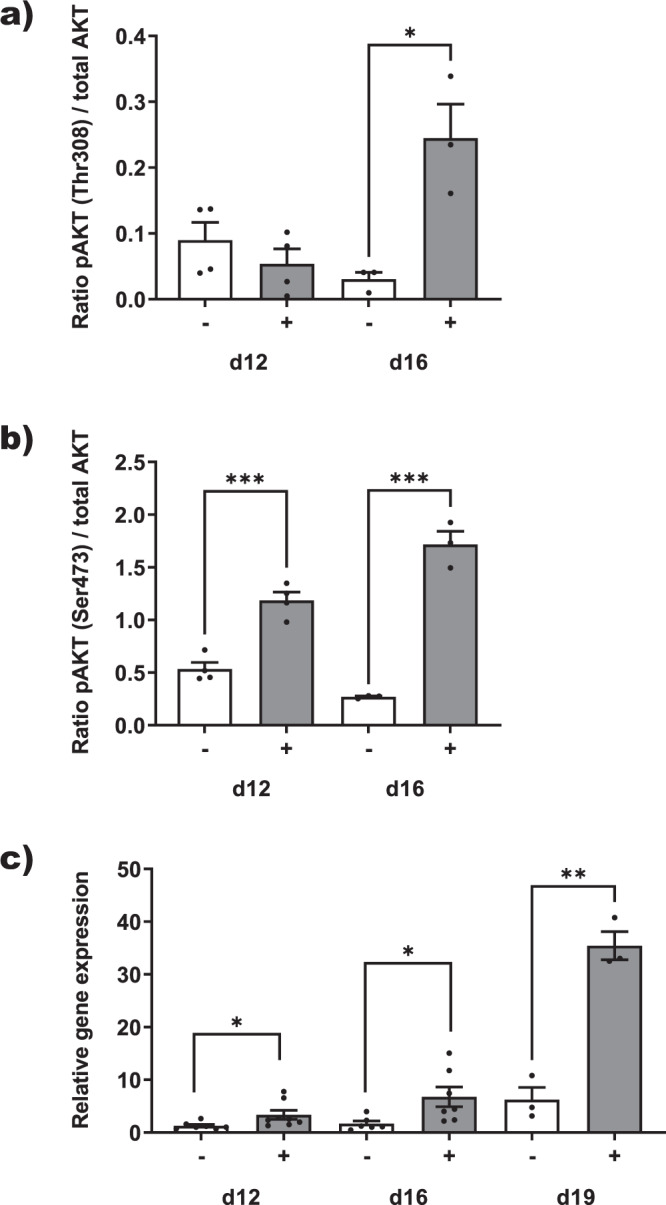
A key to enhance the low translatability of preclinical drug discovery are in vitro human three-dimensional (3D) microphysiological systems (MPS). Here, we show a new method for automated engineering of 3D human skeletal muscle models in microplates and functional compound screening to address the lack of muscle wasting disease medication. To this end, we adapted our recently described 24-well plate 3D bioprinting platform with a printhead cooling system to allow microvalve-based drop-on-demand printing of cell-laden Matrigel containing primary human muscle precursor cells. Mini skeletal muscle models develop within a week exhibiting contractile, striated myofibers aligned between two attachment posts. As an in vitro exercise model, repeated high impact stimulation of contractions for 3 h by a custom-made electrical pulse stimulation (EPS) system for 24-well plates induced interleukin-6 myokine expression and Akt hypertrophy pathway activation. Furthermore, the known muscle stimulators caffeine and Tirasemtiv acutely increase EPS-induced contractile force of the models. This validated new human muscle MPS will benefit development of drugs against muscle wasting diseases. Moreover, our Matrigel 3D bioprinting platform will allow engineering of non-self-organizing complex human 3D MPS.


Conflict of interest statement

The authors declare no competing interests.

Figures

Fig. 1
Fig. 1. Microvalve-based DOD 3D bioprinting of pure Matrigel/cell suspensions.
a Images of the printhead cooling system. Two printheads were equipped with cooling jackets for the printing cartridges. Insulated tubing connected to a temperature-controlled water bath delivered circulating water-based cooling. An integrated temperature sensor in the cooling jacket provided temperature control. b Qualitative spatula lift-up gelling tests of Matrigel drops with increasing total protein contents as indicated in the figure. c Microscopic images of printed Matrigel/cell suspension droplets over time. Scale bar 100 µm. d Quantification of printed droplet diameter (n = 5, means ± sem). Statistics: Ordinary one-way ANOVA, Bonferroni’s multiple comparison test, ****p < 0.0001. e Macroscopic images of dumbbell-shaped Matrigel/cell models directly after printing at different time points of the printing process in 24-well plates on agarose substrates. Scale bar 2 mm.
Fig. 2
Fig. 2. Morphological tissue development in 3D bioprinted Matrigel/cell models.
a Macroscopic images of a typical Matrigel/cell model after printing (day 0) and following fixation with two micro-posts in differentiation medium at day 1, 4 and 8. Scale bar, 2 mm. b Macroscopic images of a typical printed model overlaid with Matrigel after printing and during differentiation without micro-posts at day 4 and 6. c Time course of the survival of models from different donors until they tore between the micro-posts. Shown are the results ≥ 2 independent experiments.
Fig. 3
Fig. 3. Differentiation of 3D bioprinted Matrigel/skeletal muscle cell models.
a Marker gene expression analyses. Temporal expression profiles of myogenesis marker genes (Myf5, MyoD, Myog, Actn2, Myh1-3, Myh7&8) in differentiating 2D cultures of skeletal muscle precursor cells from a 17-year-old donor and in 3D bioprinted models with cells from a 17-year-old and a 19-year-old donor. Gene expression was determined by qPCR and normalized by 18S, GAPDH, TBP and β2M housekeeping genes. Expressions were standardized by arbitrarily taking MyoD expression at day 0 as 1. Shown are the means of ≥ 2 independent experiments. b Histological analyses of tissue cultures of a 17-year-old donor. Confocal immunofluorescence microscopy of Myosin heavy chain (Myh) expression in control 2D cultures of differentiation day 6 and 10 as indicated in the figure. Whole-mount confocal microscopy images of models differentiated for 6 and 10 days were immunostained for Myh, α-actinin and F-actin proteins as indicated in the figure. Nuclei were stained with DAPI. Scale bar, 20 µm, except for F-actin, 200 µm (left image). Cross section microscopy images of models from a 40-year-old donor after 14, 19 and 31 days of differentiation were immunostained for Myh. Scale bar, 150 µm.
Fig. 4
Fig. 4. EPS-induced repetitive model contractions activate Akt hypertrophy pathway and induce IL-6 myokine expression.
3D models (n ≥ 3) from a 19-year-old donor, differentiated for 12 (d12), 16 (d16) and 19 days (d19), were stimulated by high impact EPS ( + ) for 3 h or left untreated as controls (−). Induction of Akt phosphorylation as a ratio of total Akt was determined by Western Blotting. a Thr308 phosphorylation. b Ser473 phosphorylation. c Relative induction of IL-6 gene expression determined by qPCR and normalized by GAPDH expression. Shown are means ± sem. Statistics: Unpaired t-test, *p < 0.05, **p < 0.01, ***p < 0.001.
Fig. 5
Fig. 5. Measurement of EPS-induced contractile force.
a Representative 2 ms single twitch EPS-induced contractile peak forces of a 3D model from a 19-year-old donor, differentiated for 18 days, in relation to pulse strength. b Effect of model elongation and single versus multiple twitch activation on 400 mA EPS-induced contractile peak force production in a representative model (n ≥ 3 stimulations) Shown are means ± sem. Statistics: One-way ANOVA, Bonferroni’s Multiple Comparison test, ****p < 0.0001. c Effect of EPS (50 Hz, 300 ms, 400 mA) pulse length on contractile peak force in a representative model. d Effect of 1 µM TTX or solvent control (Con) on EPS-induced (1 ms pulse, 25 Hz, 300 ms, 400 mA) contractile peak force in a representative model from a 19-year-old donor differentiated for 17 days (n = 6 stimulations). Shown are means ± sem. Statistics: Unpaired t test, ****p < 0.0001.
Fig. 6
Fig. 6. Acute enhancement of EPS-induced contractile force by known muscle stimulating drugs.
a Effect of 10 mM caffeine (Caf) or solvent control (Con) on EPS-induced peak force and contraction duration (width50 and AUC [area under curve]) in 3D models from a 19-year-old donor differentiated for 20 days (n ≥ 8). Data are presented as means ± sem. Statistics: Unpaired t-test; ****p < 0.0001. b Time course of the effect of 20 µM troponin C activator Tirasemtiv on peak force production in a representative model from a 19-year-old donor differentiated for 18 days. c Relative effect of 20 µM Tirasemtiv (T) on peak force and contraction duration compared to before treatment (Con). Shown are means ± sem (n ≥ 10). Statistics: Unpaired t-test, ****p < 0.0001. d Time course of the effect of 0.2% DMSO solvent on peak force production in a representative model from a 19-year-old donor differentiated for 20 days. e Relative effect of 0.2% DMSO (D) on peak force and contraction duration compared to before treatment (Con). Shown are means ± sem (n ≥ 11). Statistics: Unpaired t-test, *p < 0.05. f Dose-response relation of the effect of Tirasemtiv on EPS-induced peak force in a representative model from a 19-year-old donor differentiated for 29 days. Shown are means ± sem (n ≥ 3). Statistics: One-way ANOVA, Dunnett’s multiple comparison test, **p < 0.01, ****p < 0.0001.

References

    1. Janssen I, Heymsfield SB, Wang ZM, Ross R. Skeletal muscle mass and distribution in 468 men and women aged 18-88 yr. J. Appl Physiol. 2000;89:81–88. doi: 10.1152/jappl.2000.89.1.81. - DOI - PubMed
    1. Yelin E, Weinstein S, King T. The burden of musculoskeletal diseases in the United States. Semin Arthritis Rheum. 2016;46:259–260. doi: 10.1016/j.semarthrit.2016.07.013. - DOI - PubMed
    1. Tieland M, Trouwborst I, Clark BC. Skeletal muscle performance and ageing. J. Cachexia Sarcopenia Muscle. 2018;9:3–19. doi: 10.1002/jcsm.12238. - DOI - PMC - PubMed
    1. Batsis JA, Villareal DT. Sarcopenic obesity in older adults: aetiology, epidemiology and treatment strategies. Nat. Rev. Endocrinol. 2018;14:513–537. doi: 10.1038/s41574-018-0062-9. - DOI - PMC - PubMed
    1. Rooks, D. et al. Treatment of sarcopenia with bimagrumab: results from a phase II, randomized, controlled, proof-of-concept study. J. Am. Geriatr. Soc., 10.1111/jgs.14927 (2017). - PubMed