. 2021 Dec;27(12):2127-2135.
doi: 10.1038/s41591-021-01548-7. Epub 2021 Oct 14.

Effect of Delta variant on viral burden and vaccine effectiveness against new SARS-CoV-2 infections in the UK

Affiliations

Effect of Delta variant on viral burden and vaccine effectiveness against new SARS-CoV-2 infections in the UK

Koen B Pouwels et al. Nat Med. 2021 Dec.

Abstract

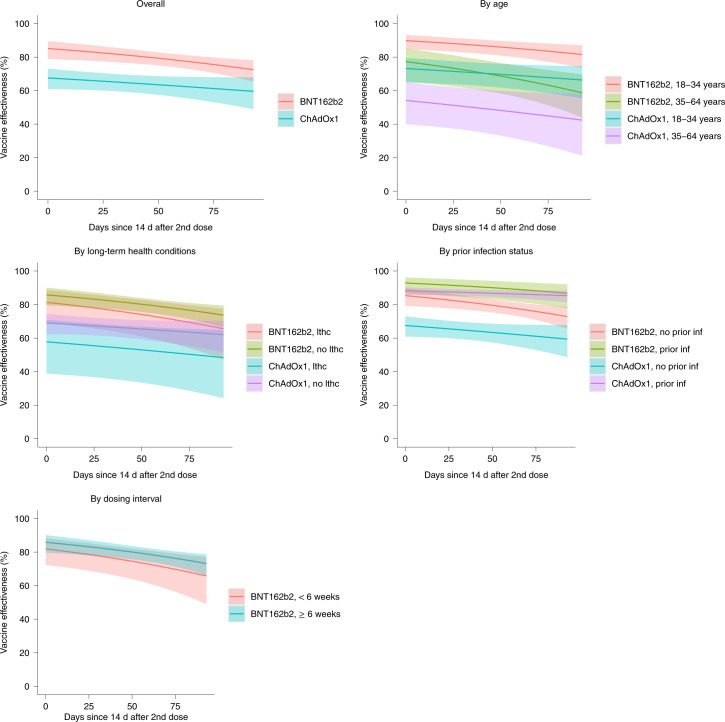
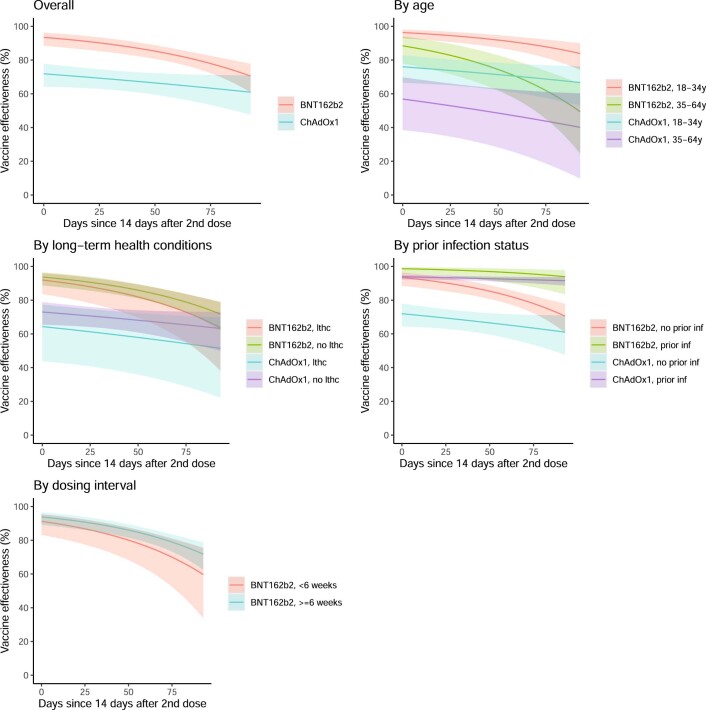
The effectiveness of the BNT162b2 and ChAdOx1 vaccines against new severe acute respiratory syndrome coronavirus 2 (SARS-CoV-2) infections requires continuous re-evaluation, given the increasingly dominant B.1.617.2 (Delta) variant. In this study, we investigated the effectiveness of these vaccines in a large, community-based survey of randomly selected households across the United Kingdom. We found that the effectiveness of BNT162b2 and ChAdOx1 against infections (new polymerase chain reaction (PCR)-positive cases) with symptoms or high viral burden is reduced with the B.1.617.2 variant (absolute difference of 10-13% for BNT162b2 and 16% for ChAdOx1) compared to the B.1.1.7 (Alpha) variant. The effectiveness of two doses remains at least as great as protection afforded by prior natural infection. The dynamics of immunity after second doses differed significantly between BNT162b2 and ChAdOx1, with greater initial effectiveness against new PCR-positive cases but faster declines in protection against high viral burden and symptomatic infection with BNT162b2. There was no evidence that effectiveness varied by dosing interval, but protection was higher in vaccinated individuals after a prior infection and in younger adults. With B.1.617.2, infections occurring after two vaccinations had similar peak viral burden as those in unvaccinated individuals. SARS-CoV-2 vaccination still reduces new infections, but effectiveness and attenuation of peak viral burden are reduced with B.1.617.2.


Conflict of interest statement

All authors have completed the International Committee of Medical Journal Editors uniform disclosure form at www.icmje.org/coi_disclore.pdf. D.W.E. declares lecture fees from Gilead, outside the submitted work. E.P., P.C.M., N.S., D.W.E., J.I.B., D.C., T.E.A.P., A.S.W. and K.B.P. are employees of the University of Oxford but were not involved in the development or production of the vaccine. J.I.B. acts as an unpaid advisor to Her Majesty’s Government on COVID but does not sit on the vaccine task force and is not involved in procurement decisions. J.I.B. also sits on the Board of the Oxford Sciences Innovation, which has an investment in Vaccitech, which has a royalty from the ChAdOx1 vaccine when, if ever, it makes a profit. A.S.W., in addition to the funding mentioned above, received grants from the Medical Research Council UK during the conduct of the study. P.C.M. received funding from the Wellcome Trust. The remaining authors declare no competing interests.

Figures

Fig. 1
Fig. 1. Protection against new PCR-positive cases.
a, Protection against all new PCR-positive cases, case with Ct < 30, or cases with self-reported symptoms in individuals 18–64 years in the B.1.617.2-dominant period. b, Protection against all new PCR-positive cases in individuals older than 18 years in both the B.1.1.7- and B.1.617.2-dominant periods. All estimates (VE = 100% × (1 odds ratio)) were obtained from a generalized linear model with a logit link comparing to the reference category of ‘Not vaccinated, not previously positive and ≥21 d before vaccination’ and using clustered robust standard errors. The dots represent the point estimates (central estimate, 100% × (1 odds ratio)), and the error bars represent 95% CIs. Underlying counts are provided in Supplementary Table 2. VE estimates in Tables 1 and 2 for ≥18 years and 18–64 years, respectively.
Fig. 2
Fig. 2. Protection against new PCR-positive cases since second dose.
Note: Data were restricted to individuals aged 18–64 years and the B.1.617.2-dominant period. All estimates (VE = 100% × (1 odds ratio)) were obtained from a generalized linear model with a logit link comparing to the reference category of ‘Not vaccinated, not previously positive and ≥21 d before vaccination’ and using clustered robust standard errors. The error bars represent 95% CIs. See Extended Data Figs. 4 and 5 for effects on PCR-positive cases with Ct <30 or symptoms. See Table 3 for estimates of decline. See Supplementary Table 6 for estimates of VE within subgroups 14 d after second vaccination (intercept on panels below). lthc, self-reporting a long-term health condition.
Fig. 3
Fig. 3. Ct values in new PCR-positive cases in individuals 18 years of age and older.
a, All new PCR-positive cases by vaccination/reinfection status over time (n = 15,434). b, Distribution of Ct values in all PCR-positive cases ≥14 d after second dose (n = 1,736). c, Probability that each new PCR-positive case in b falls into the higher viral shedding class over time. d, Association between Ct values and time from second dose. Note: Boxes in a are median (IQR); b shows observed Ct values with the marginal density (black) and the densities estimated from a two-component mixture distribution. In a, the box plots show median values and upper and lower quartiles of the distribution, with whiskers extending from the hinge to the largest and smallest value no further than 1.5 times the IQR. In c, dotted lines show categorical effects of pre-specified calendar periods reflecting B.1.1.7 dominance and early and late B.1.617.2 dominance (Extended Data Fig. 1); the solid line shows a continuous calendar time effect (linear on the log-odds scale). In d, months since second dose was truncated at the 95th percentile to avoid the undue influence of outliers. Spearman’s ρ = −0.09 (P = 0.004, two-sided t-test).
Extended Data Fig. 1
Extended Data Fig. 1. Characteristics of new PCR positive episodes over time.
(a) gene positivity pattern overall, (b) gene positivity pattern restricted to episodes with cycle threshold (Ct) <30; (c) and mean Ct value and 95% CI in all positives. Note: analysis among those ≥18 years; ORF1ab + N + S (black) are compatible with wild-type and B.1.617.2 variants (S-gene positive); ORF1ab + N (gray) are compatible with the B.1.1.7 variant (S-gene negative). Those PCR-positives where only a single gene (N or ORF1ab were detected) cannot be classified (vast majority Ct>30). The percentage of PCR-positives with Ct<30 that were ORF1ab + N + S, compatible with B.1.617.2, increased from 6% the week commencing 10 May 2021, to 67% and 92% the weeks starting 17 May and 14 June 2021, respectively. For panel (c), the number of new PCR positive tests in each calendar week are denoted at the top of the graph.
Extended Data Fig. 2
Extended Data Fig. 2. Visits included in analysis over time by vaccination status.
The graphs (with different scales for the axes) show the number of visits by vaccination status, by calendar time and age category (dark: 18-34 year olds, intermediate: 35-64 year olds; light: 65+ year olds. The vertical line at 25 weeks indicates the start of the period dominated by B.1.617.2.
Extended Data Fig. 3
Extended Data Fig. 3. Proportion of visits by exposure.
The vertical line at 25 weeks indicates the start of the period dominated by B.1.617.2.
Extended Data Fig. 4
Extended Data Fig. 4. Protection against PCR-positive episodes with Ct < 30.
Note: data restricted to those aged 18-64 years old and the B.1.617.2-dominant period; lthc=self-reporting a long term health condition. All estimates (Vaccine effectiveness = 100% * (1-odds ratio)) were obtained from a generalised linear model with a logit link comparing to the reference category of ‘Not vaccinated, not previously positive and ≥21 days before vaccination’ and using clustered robust standard errors. The error bars represent 95% CIs. See Fig. 2 for effects on all PCR-positive episodes. See Table 3 for estimates of overall decline over time. See Supplementary Table 6 for estimates of VE within subgroups 14 days after second vaccination (intercept on panels below).
Extended Data Fig. 5
Extended Data Fig. 5. Protection against PCR-positives with reported symptoms.
Note: data restricted to those aged 18-64 years old and the B.1.617.2-dominant period; lthc=self-reporting a long term health condition. All estimates (Vaccine effectiveness = 100% * (1-odds ratio)) were obtained from a generalised linear model with a logit link comparing to the reference category of ‘Not vaccinated, not previously positive and ≥21 days before vaccination’ and using clustered robust standard errors. The error bars represent 95% CIs. See Fig. 2 for effects on all PCR-positive episodes. See Table 3 for estimates of overall decline over time. See Supplementary Table 6 for estimates of VE within subgroups 14 days after second vaccination (intercept on panels below).
Extended Data Fig. 6
Extended Data Fig. 6. Symptoms reported in PCR-positives by subgroup.
Note: data restricted to those 18+ years old. Error bars represent 95% confidence intervals. The number of tests in each group and the corresponding percentages with any symptoms and classic symptoms (cough, fever, anosmia, ageusia) are denoted in the top of the graph.
Extended Data Fig. 7
Extended Data Fig. 7. Probability of reporting symptoms in new PCR-positives.
Note: data include all new PCR positives among those ≥18 years old. Panels (a) and (c) relate to any symptoms, while (b) and (d) relate to classic symptoms (cough, fever, loss of taste/smell). Panels (a) and (b) include all PCR-positives from 1 December 2020 to 1 August 2021; panels (c) and (d) fit separate models to the periods 1 December 2020-16 May 2021 (solid lines) and 14 June 2021-1 August 2021 (dashed lines).
Extended Data Fig. 8
Extended Data Fig. 8. Low Ct populations ≥14 days after second vaccination.
(a) Adjusted effects of vaccine type and months since second vaccination on probability of belonging to the low Ct sub-population; (b) adjusted effects of vaccine type and months since second vaccination on Ct values within the low Ct sub-population; (c) adjusted effects of calendar time on Ct values within the low Ct sub-population. Shaded areas represent 95% confidence intervals. Note: data include all new PCR positives among those ≥18 years old; estimated at the reference category for other factors (27 April 2021, male, no previous PCR/antibody-positive, not reporting a long-term health condition). In (c), test for non-linearity in effect of calendar date p = 0.003 for low and <0.0001 for high Ct sub-population (two-sided Wald test without adjustment for multiple comparison).
Extended Data Fig. 9
Extended Data Fig. 9. Ct values in new PCR-positives ≥14 days after second vaccination.
(a) by months since second vaccination (N = 1,736), (b) by age (N = 1,736) and (c) by most recent anti-trimeric spike IgG antibody measurement where available (N = 846). Note: in (a) red solid line shows 30 threshold used in main analysis. Short red lines show median within groups. In (c) antibody measurements taken median 30 (IQR 28-54) [range 25–91] days before the new PCR-positive, at or before the most recent prior negative swab and 14 days or more after first vaccination. 42 ng/ml is the positivity threshold. Overall association with Ct Spearman rho=0.08 (p = 0.002) for age (b), and 0.10 (p = 0.002) for IgG (c). P-values for the Spearman tests were obtained using a two-side t-test.
Extended Data Fig. 10
Extended Data Fig. 10. Antibody changes upon PCR-positive ≥14 days after second vaccination.
(a) ChAdOx1 (N = 60), (b) BNT162b2 (N = 51]. Lines join repeated observations from the same individual. Median second vaccination date (IQR) 24 Apr 2021 (15 April-18 May) for ChAdOx1 and 5 April (9 January-16 April 2021) for BNT162b2. Median (IQR) new PCR-positive date 13 June (30 May-19 June) for ChAdOx1 and 25 May 2021 (20 February-16 June) for BNT162b2.

Similar articles

Cited by

References

    1. Imai, N. et al. Interpreting estimates of coronavirus disease 2019 (COVID-19) vaccine efficacy and effectiveness to inform simulation studies of vaccine impact: a systematic review. Wellcome Open Res. 6, 185 https://wellcomeopenresearch.org/articles/6-185 (2021)
    1. Chemaitelly H, et al. mRNA-1273 COVID-19 vaccine effectiveness against the B.1.1.7 and B.1.351 variants and severe COVID-19 disease in Qatar. Nat. Med. 2021;27:1614–1621. doi: 10.1038/s41591-021-01446-y. - DOI - PubMed
    1. Chung H, et al. Effectiveness of BNT162b2 and mRNA-1273 COVID-19 vaccines against symptomatic SARS-CoV-2 infection and severe COVID-19 outcomes in Ontario, Canada: a test-negative design study. Brit. Med. J. 2021;374:n1943. doi: 10.1136/bmj.n1943. - DOI - PMC - PubMed
    1. Thompson MG, et al. Interim estimates of vaccine effectiveness of BNT162b2 and mRNA-1273 COVID-19 vaccines in preventing SARS-CoV-2 infection among health care personnel, first responders, and other essential and frontline workers—eight U.S. locations, December 2020–March 2021. MMWR Morb. Mortal. Wkly Rep. 2021;70:495–500. doi: 10.15585/mmwr.mm7013e3. - DOI - PMC - PubMed
    1. Noori, M. et al. Potency of BNT162b2 and mRNA-1273 vaccine-induced neutralizing antibodies against severe acute respiratory syndrome-CoV-2 variants of concern: a systematic review of in vitro studies. Rev. Med. Virol.10.1002/rmv.2277 (2021). - PMC - PubMed

Publication types

Supplementary concepts