. 2022 Mar;40(3):411-421.
doi: 10.1038/s41587-021-01045-9. Epub 2021 Oct 14.

High-confidence structural annotation of metabolites absent from spectral libraries

Affiliations

High-confidence structural annotation of metabolites absent from spectral libraries

Martin A Hoffmann et al. Nat Biotechnol. 2022 Mar.

Abstract

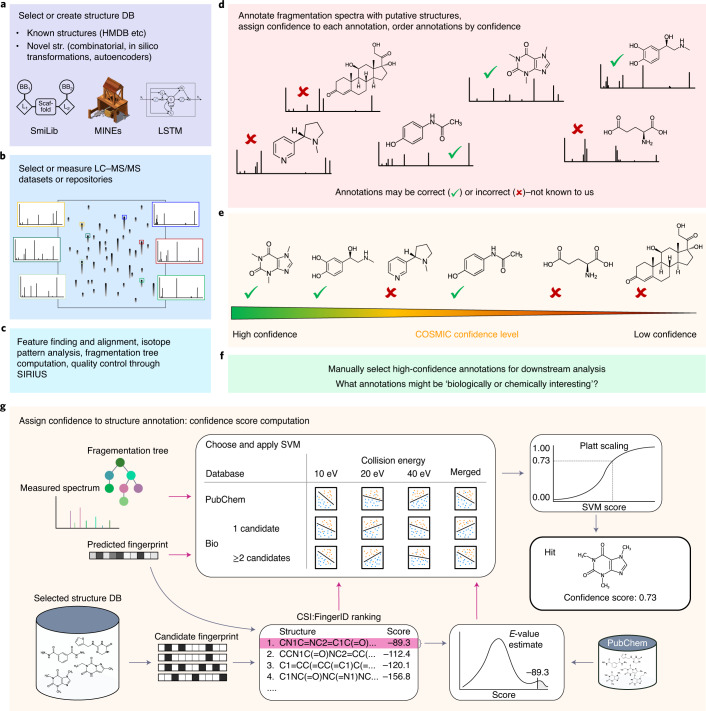
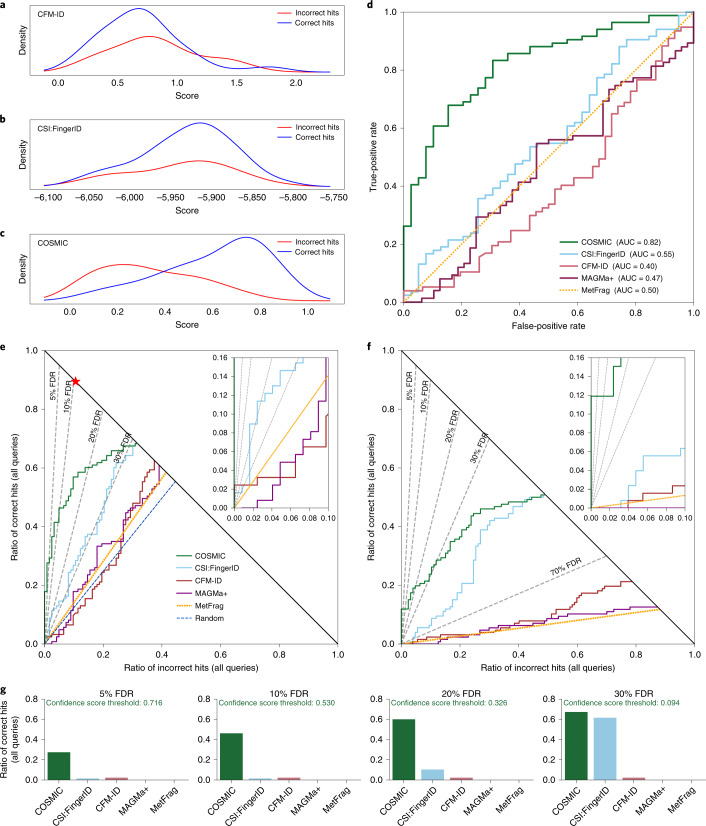
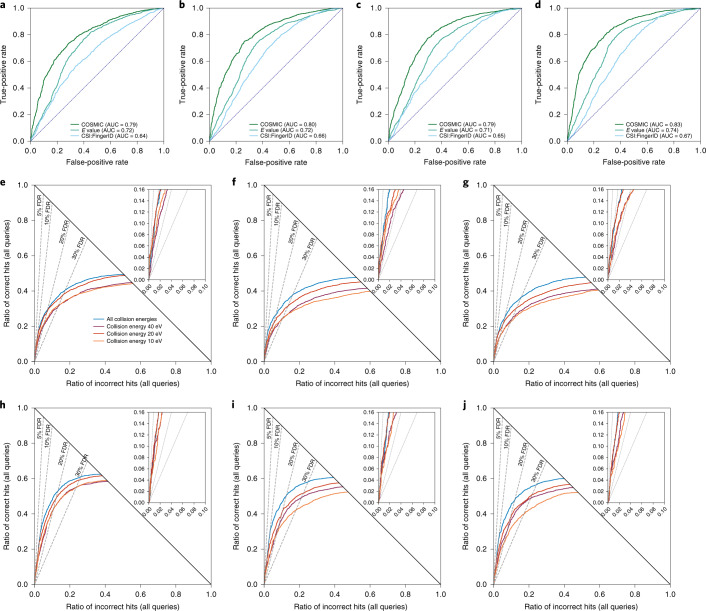
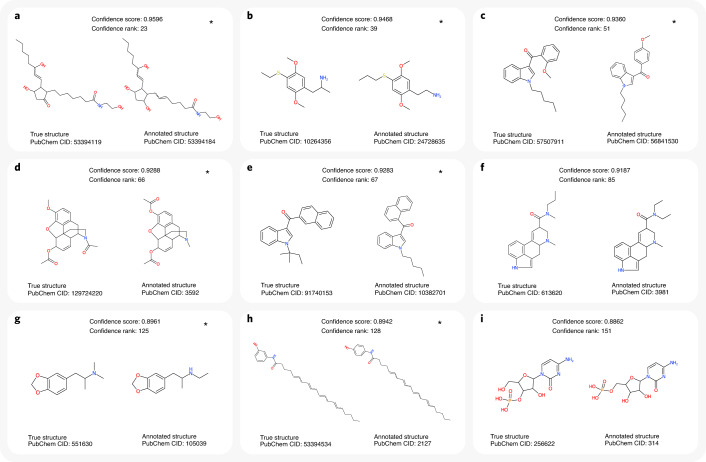
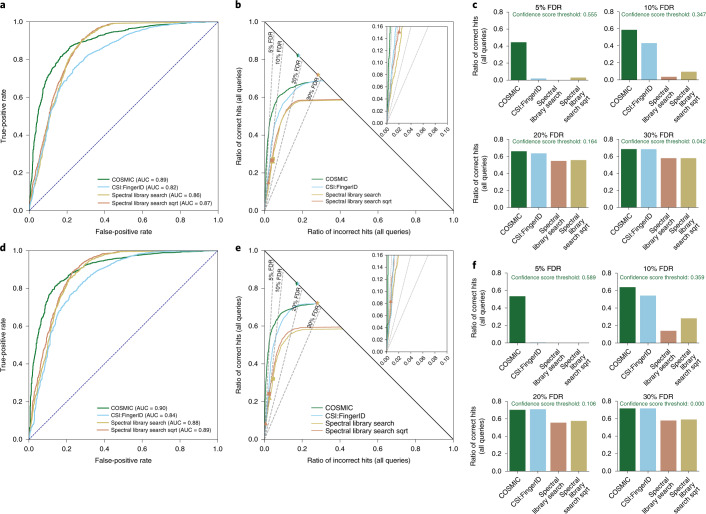
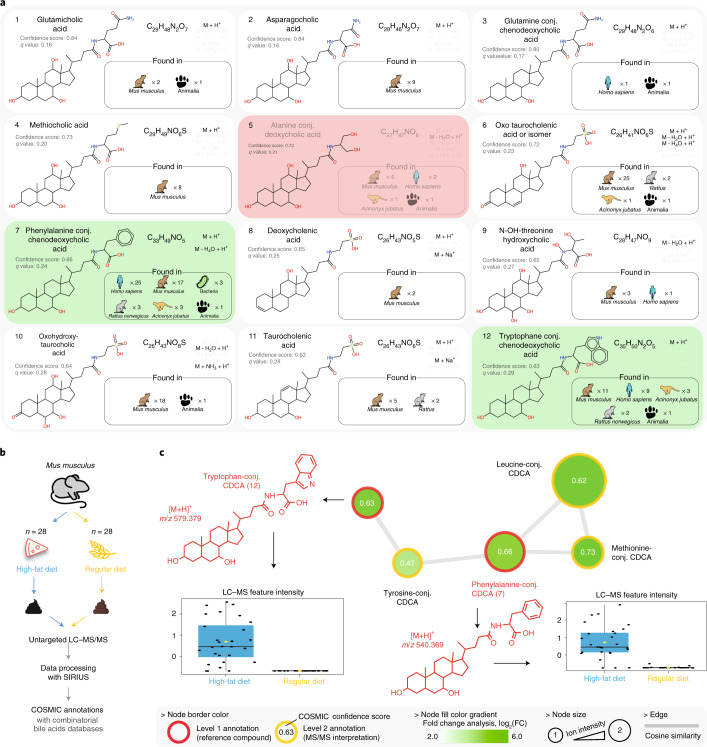
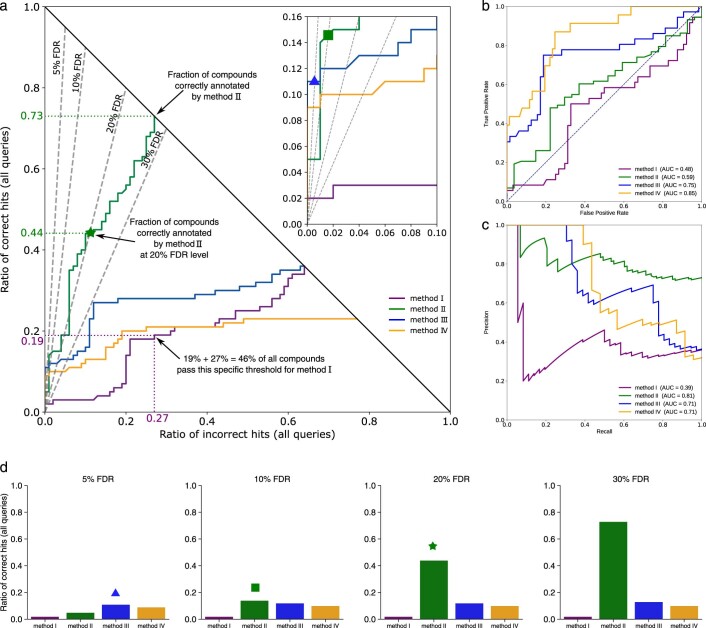
Untargeted metabolomics experiments rely on spectral libraries for structure annotation, but, typically, only a small fraction of spectra can be matched. Previous in silico methods search in structure databases but cannot distinguish between correct and incorrect annotations. Here we introduce the COSMIC workflow that combines in silico structure database generation and annotation with a confidence score consisting of kernel density P value estimation and a support vector machine with enforced directionality of features. On diverse datasets, COSMIC annotates a substantial number of hits at low false discovery rates and outperforms spectral library search. To demonstrate that COSMIC can annotate structures never reported before, we annotated 12 natural bile acids. The annotation of nine structures was confirmed by manual evaluation and two structures using synthetic standards. In human samples, we annotated and manually validated 315 molecular structures currently absent from the Human Metabolome Database. Application of COSMIC to data from 17,400 metabolomics experiments led to 1,715 high-confidence structural annotations that were absent from spectral libraries.


Conflict of interest statement

S.B., K.D., M.L., M.F. and M.A.H. are co-founders of Bright Giant. P.C.D. is scientific advisor for Sirenas, Galileo and Cybele and is scientific advisor and co-founder of Enveda and Ometa. The remaining authors declare no competing interests.

Figures

Fig. 1
Fig. 1. COSMIC workflow.
a, Select or create a structure database; this can be an existing structure database such as the HMDB or generated explicitly for this purpose. b, Select or measure an LC–MS/MS dataset or select a complete data repository (data repurposing). c, Data processing through SIRIUS. d, Structure annotation of fragmentation spectra through CSI:FingerID; only the candidate that is top ranked by CSI:FingerID is considered. We stress that, at this point, there is no ordering of hits. e, Each hit (structure annotation) is assigned a confidence score; annotations are then ordered by confidence, allowing users to concentrate on high-confidence annotations. f, High-confidence annotations can be used to develop or test a biological hypothesis. g, Detailed confidence score computation for the structure annotation of a spectrum (hit) applied in e, including feature calculation (magenta arrows), E value estimation, selection and application of the appropriate SVM and Platt scaling. Notably, COSMIC can annotate metabolites at an early stage of a biological analysis. DB, database; str., structure; MINE, metabolic in silico network expansions; LSTM, long short-term memory.
Fig. 2
Fig. 2. Separation by hit score for different in silico tools, using the CASMI 2016 contest submissions.
Positive ion mode; candidates retrieved by molecular formula. ae, Searching the biomolecule structure database (n = 123 queries). f, Searching in ChemSpider (n = 127 queries). ac, Kernel density estimates of the score mixture distribution (correct and incorrect hits) for CFM-ID (a) and CSI:FingerID (b), ensuring structure–disjoint training data through cross-validation, and COSMIC (c). Kernel density estimates do not allow for a direct comparison of different tools. d, ROC curves for MetFrag, MAGMa+, CFM-ID, CSI:FingerID (ensuring structure–disjoint training data) and COSMIC. MetFrag normalizes scores, so the ordering of hits is exactly random. e,f, Hop plots for the same tools, searching the biomolecule structure database (e) or ChemSpider (f). FDR levels are shown as dashed lines; FDR levels are exact, not estimated (Methods). The blue dashed line in e indicates random scores, resulting in random ordering of candidates and hits; the red star in e is the best possible search result. g, Bar plots for the ratio of correct hits returned at FDR 5%, 10%, 20% and 30%, searching the biomolecule structure database. Again, FDR levels are exact. This information can also directly be read from the hop plot (e) (see Extended Data Fig. 1 for details). We also report COSMIC’s confindence score thresholds corresponding to each level. ag, CSI:FingerID and COSMIC are computed here; all other scores are from ref. . Source data
Fig. 3
Fig. 3. Evaluation of separation searching in the biomolecule structure database.
ad, Comparison of CSI:FingerID score, calibrated score (E value) and COSMIC confidence score. ROC curves, structure–disjoint evaluation, independent data and medium noise (n = 3,013). 10 eV (a), 20 eV (b), 40 eV (c) and merged spectra (d) (‘all collision energies’). In each plot, all curves end in the same number of correct hits (1,829 for a, 1,901 for b, 1,765 for c and 1,948 for d), so a hop plot would not contain additional information. ej, Evaluation of COSMIC confidence score: hop plots for different collision energies. eg, Structure–disjoint cross-validation; queries are Orbitrap MS/MS data (n = 3,721). hj, Independent data with structure–disjoint evaluation; queries are QTOF MS/MS data (n = 3,013). No added noise (e,h), medium noise (f,i) and high noise (g,j). FDR levels are shown as dashed lines; FDR levels are exact, not estimated (Methods). Source data
Fig. 4
Fig. 4. Examples of incorrect annotations with highest confidence scores.
Queries are cross-validation data, merged spectra, medium noise, biomolecule structure database and structure–disjoint evaluation. Evaluations were carried out using reference spectra, so the true structure behind each query spectrum is known to us but not known to CSI:FingerID or the confidence score. Each query spectrum is annotated with the structure that is top ranked by CSI:FingerID; this pair is called ‘hit’ and can be either correct (annotation is identical to the true structure) or incorrect. All hits were then ordered by confidence score; it is inevitable that some incorrect hits will receive a high confidence score. Of the 151 hits with confidence scores above 0.8862, 142 were correct (not shown here), and only nine were incorrect (ai). Incorrect annotation (CSI:FingerID top-ranked structure) is on the right, and corresponding true structure is on the left. Incorrect annotations might or might not be structurally similar to the true structure (compare to Extended Data Fig. 3). Notably, the nine incorrect annotations with highest confidence score (ai) show very high structural similarity to the corresponding true structures. This is particularly noteworthy as the confidence score machine learning model has not been trained taking into account this structural similarity. If incorrect hit i is at rank n, this implies that n − i of the n − 1 top-ranked hits are correct, and only i − 1 are incorrect, corresponding to exact FDR (i − 1)/(n − 1). For example, only eight of 150 hits with highest confidence score were incorrect (exact FDR 5.33%) for confidence score threshold 0.8863. ‘Confidence rank’ is the rank of the (incorrect) hit in the complete ordered list of hits, and ‘PubChem CID’ is the PubChem compound identifier number. Instances where the true structure was not contained in the biomolecule structure database are marked by an asterisk. For these instances, a correct annotation by CSI:FingerID is impossible; at the same time, it is highly challenging for the confidence score to identify these hits as ‘incorrect’. In seven cases, molecular graphs of the incorrect hit and true structure differ by the theoretical minimum of two edge deletions. Query spectra: NIST 1210761/62/64 (a), NIST 1617825/29/34 (b), NIST 1320583/85/91 (c), NIST 1429464/65/71 (d), NIST 1483460/63/69 (e), NIST 1247455/57/63 (f), NIST 1480825/30/34 (g), NIST 1418771/73/80 (h) and NIST 1276453/55/59 (i).
Fig. 5
Fig. 5. Comparison to spectral library search and separation without structure–disjoint evaluation.
Query spectra (independent dataset) distorted with medium noise. COSMIC is searching the biomolecule structure database. ROC curves (a,d), hop plots (b,e) and bar plots (c,f) for collision energy 20 eV (ac) and merged spectra (df). Bar plots (c,f) for FDR levels 5%, 10%, 20% and 30%. There is no overlap in fragmentation spectra between training data and independent data, but we do not remove training data for which we find the same structure in the independent dataset. To this end, 2,192 of the n = 3,013 structures from the independent dataset (72.75%) are also present in the spectral library. We compare search performance and separation of COSMIC, the CSI:FingerID score and spectral library search. All three methods use basically the same MS/MS data. For spectral library search, we compute the normalized dot product using either regular peak intensities or the square root of peak intensities (‘Spectral library search sqrt’). Spectral library search candidates were restricted to those with the correct molecular formula for each query. Query spectra are QTOF MS/MS data, whereas the spectral library contains a mixture of QTOF and Orbitrap MS/MS data. The spectral library is 16-fold smaller than the biomolecule structure database, giving library search a large competitive edge in evaluation. Notably, COSMIC results in substantially more correct annotations than library search for all reasonable FDR levels; FDR levels are exact, not estimated (Methods). For spectral library search, markers show commonly used cosine score thresholds 0.9 (triangle) and 0.8 (square), respectively. Finally, stars indicate the best possible annotation results, for CSI:FingerID/COSMIC and library search. sqrt, square root. Source data
Fig. 6
Fig. 6. Applying COSMIC to discover novel bile acid conjugates in a mice fecal dataset.
a, Top 12 highest-scoring COSMIC annotations of ‘truly novel’ bile acid conjugates. Bile acid conjugates that are also present in PubChem are omitted from the list; see Supplementary Table 2 for the complete list. For each bile acid conjugate, we report its chemical name, putative structure, molecular formula and adducts of annotations for this structure. In addition, we report confidence scores and estimated q values; note that the exact FDR is 0% for the top 4 bile acid conjugates and 8.3% for the top 12 (compare to Extended Data Fig. 5). We also report species and number of datasets with spectral matches from a MASST search. Two annotations verified by authentic standards are highlighted in green and the single incorrect annotation in red. b, Experimental design and the data processing and annotation carried out with COSMIC. c, MS-based molecular network of novel bile acid conjugates annotated with COSMIC and the combinatorial bile acids structure database. Two annotations (7 and 12) were validated using synthetic standards, and the other annotations were manually inspected. Fold change analysis showed that all these bile acid derivatives were predominantly observed in mice fed an HFD. Box plots depict the first and third quartiles as well as the median. Whiskers extend to the smallest and largest value but no further than 1.5× interquartile range from the hinges. n = 56 independent biological experiments. conj., conjugate; FC, fold change. Source data
Extended Data Fig. 1
Extended Data Fig. 1. Introducing hop plots.
(a) Hop plots allow us to simultaneously assess a methods annotation rate and its power to separate correct and incorrect hits. Two methods with identical annotation rate will end up in the same point (x, y) with x + y = 1, see methods I and III; these methods can differ substantially in their separation power. The plot shows which method performs best for a desired number of correct annotations (horizontal lines, not shown), incorrect annotations (vertical lines, not shown), or false discovery rate (FDR, dashed lines). For example, if we are willing to accept three incorrect annotations from a total of N = 100 queries, then method IV clearly outperforms method I; this ordering is reversed if we consider all queries (x + y = 1). FDR levels correspond to lines through the origin; a hop curve may cross or touch some FDR line multiple times, or only in the origin. We report the maximum number of correct annotations among all crossing points. For example, method II returns 55 hits (44 correct, 11 incorrect) at FDR 20 % (star). We are usually interested in small FDR values such as FDR 10 %, so a zoom-in shows where different curves cross the corresponding FDR lines: For example, method III returns 11 hits (all correct) at FDR 5 % (triangle, zoom-in), and method II returns 15 hits (14 correct) at FDR 10 % (square, zoom-in). See Online Methods for further details. (b) ROC plot and (c) precision-recall curve for the data shown in (a). Both plots (b) and (c) hide the information that method II is by far the most powerful method. (d) Bar plots for four FDR levels. Notably, the information from the bar plot can directly be read from the hop plot: We mark the corresponding values by star, triangle and square, compare to the corresponding marks in (a). Source data
Extended Data Fig. 2
Extended Data Fig. 2. Evaluation of separation vs. number of intense peaks in the query spectrum.
Independent data, 10 eV, structure-disjoint evaluation, medium noise, searching the biomolecule structure database. We binned query spectra into three categories (up to 2 fragments, 3 to 5 fragments, 6 or more fragments), based on the number of peaks in the query spectrum with relative intensity at least 5 %. We observe that the number of peaks has a clear impact on the annotation performance of CSI:FingerID, but a weaker impact on the separation performance of COSMIC’s confidence score. Source data
Extended Data Fig. 3
Extended Data Fig. 3. Examples of incorrect annotations with lowest confidence scores.
Queries are cross-validation data, merged spectra, medium noise, biomolecule structure database, structure-disjoint evaluation. (a–i) Incorrect hits with lowest confidence scores. Top-ranked structure on the right and corresponding true structure on the left. ‘PubChem CID’ is PubChem compound identifier number. Instances where the true structure was not contained in the biomolecule structure database are marked by an asterisk. For (g), the structure of the top hit is not contained in PubChem; we report the KNApSAcK compound identifier (‘C_ID’) instead. For (a) and (e), molecular graphs of incorrect hit and true structure differ by the theoretical minimum of two edge deletions. For (a), the query spectrum was heavily distorted, and only 8.6 % of peak intensities were explained by the fragmentation tree. For (e), the three top-ranked candidates — including the correct one — were structurally highly similar and received almost identical CSI:FingerID score. Hence, COSMIC rightfully showed little confidence in these (incorrect) hits. Query spectra: (a) NIST 1544714/19/23, (b) NIST 1322859/64/69, (c) NIST 1627646/51/56, (d) NIST 1462584/87/93, (e) NIST 1340388/91/96, (f) NIST 1320854/56/62, (g) NIST 1386503/07/12, (h) NIST 1305770/72/78, (i) NIST 1325235/37/43.
Extended Data Fig. 4
Extended Data Fig. 4. Comparison of fragmentation spectra for high-scoring incorrect hits from Fig. 4.
These correspond to compound pairs where COSMIC search resulted in an incorrect hit; would spectral library search be able to avoid these incorrect annotations? For three incorrect hits from Fig. 4 (a,b,h) there exist merged spectra; for the remaining six incorrect hits, no such data are available. Be reminded in all three cases (a,b,h), the true structure was not contained in the searched molecular structure database. Merged spectrum and structure of true structure shown top, merged spectrum and structure of incorrect hit bottom. Merged spectra were combined from 10 eV, 20 eV and 40 eV spectra as described in the Methods section. (a) Mirror plot for Fig. 4a, confidence 0.9596, cosine score 0.8566. (b) Mirror plot for Fig. 4b, confidence 0.9468, cosine score 0.9432. (c) Mirror plot for Fig. 4h, confidence 0.8942, cosine score 0.9968. In all three cases, the cosine score is above 0.85, and would result in a high-confidence but incorrect library search annotation if one of the spectra was in the library, the other our query. For (c) we argue that no method could possibly distinguish between these structures based on the MS/MS data. Merged spectra: (a) correct NIST 1210761/62/64, incorrect hit NIST 1215622/23/27; (b) correct NIST 1617825/29/34, incorrect hit NIST 1386465/69/74; (c) correct NIST 1418771/73/80, incorrect hit NIST 1375293/295/301.
Extended Data Fig. 5
Extended Data Fig. 5. False discovery rate estimation.
Q-Q plot of true vs. estimated q-values with no added noise, medium noise, and high noise. (a–d) cross-validation, N = 3 721. (a) 10 eV, (b) 20 eV, (c) 40 eV, (d) merged spectra. (e–h) Independent data, N = 3 013. (e) 10 eV, (f) 20 eV, (g) 40 eV, (h) merged spectra. The ‘step’ at the beginning of most curves in (e–h) is not an issue of FDR estimation, but due to the fact that no non-zero (true) q-values below this exist in the dataset. Source data
Extended Data Fig. 6
Extended Data Fig. 6. Separation results for the Sciex dataset.
Comparison of CSI:FingerID score, calibrated score (E-value) and COSMIC confidence score. Positive ion mode, structure-disjoint evaluation. MS/MS spectra were recorded as ramp spectra with collision energy 20 eV to 50 eV; we used the ‘merged spectra’ model of the confidence score. (a) ROC plot and (b) hop plot for searching the biomolecule structure database, N = 301. FDR levels shown as dashed lines; FDR levels are exact, not estimated (Online Methods). CSI:FingerID correctly annotated 226 queries (75.1 %) in this dataset. Notably, separation by both the CSI:FingerID score and the calibrated score is worse than random on this dataset. COSMIC’s performance is particularly remarkable as the confidence score uses both the CSI:FingerID score and the calibrated score as features. COSMIC correctly annotated 23 hits with FDR below 5 %, and 166 hits with FDR below 15 %. Source data
Extended Data Fig. 7
Extended Data Fig. 7. Mirror plots of low-scoring library hits that were correctly annotated with high confidence using COSMIC.
Shown is the query spectrum (bottom) from the independent dataset, plus the top-scoring reference spectrum (top) from the spectral library, that is, the CSI training dataset without merging spectra. Cosine scores were calculated using regular intensities (cosine) as well as square root of intensities (cosine-sqrt). All query spectra consist of a single 20 eV collision energy measurement with medium noise added. Reference spectra consist of a single collision energy measurement with no added noise; shown is the spectrum with the highest cosine, among all spectra in the spectral library for this compound. (a) Spectra of Thiophanate, PubChem CID 3032792, molecular formula C14H18N4O4S2. Reference spectrum NIST 1191658, query spectrum Agilent PCDL 345. Correct COSMIC annotation with confidence 0.9092, cosine 0.0637, cosine-sqrt 0.3165. (b) Spectra of Chlorbufam, PubChem CID 16073, molecular formula C11H10ClNO2. Reference spectrum NIST 1537783, query spectrum Agilent PCDL 3113. Correct COSMIC annotation with confidence 0.9347, cosine 0.1949, cosine-sqrt 0.3523. (c) Spectra of Duloxetine, PubChem CID 60835, molecular formula C18H19NOS. Reference spectrum NIST 1245947, query spectrum Agilent PCDL 2545. Correct COSMIC annotation with confidence 0.9283, cosine 0.5197, cosine-sqrt 0.4767. (d) Spectra of Proscillaridin, PubChem CID 5284613, molecular formula C30H42O8. Reference spectrum NIST 1519862, query spectrum Agilent PCDL 781. Correct COSMIC annotation with confidence 0.9720, cosine 0.6312, cosine-sqrt 0.4852. Unlike the commercial Agilent library, the query spectra shown here are uncurated and artificial noise was added.
Extended Data Fig. 8
Extended Data Fig. 8. Mirror plots of fragmentation spectra for novel bile acid conjugate annotations.
Query spectra above, reference spectra below the x-axis. Reference and query spectra of Phe-CDCA 7 (a) and Trp-CDCA 12 (b). Reference and query spectra were both measured on Q Exactive Orbitrap instruments. See Online Methods for the comparison of retention times.
Extended Data Fig. 9
Extended Data Fig. 9. COSMIC confidence score vs. exact FDR and ratio of annotated compounds.
Independent data (Agilent, QTOF), 20 eV, medium noise, N = 3, 013. We vary the confidence score threshold and present the resulting exact FDR (a) and the ratio of annotated compounds (b). Dashed lines indicate COSMIC confidence score thresholds of 0.94, 0.64, 0.34, and 0.14, corresponding to exact FDR levels of rougly 5 %, 10 %, 20 %, and 30 %, respectively. The spike for high tresholds beyond 0.9 is an artifact of the small number of hits that pass this threshold; hence, a few incorrect hits with high confidence score can lead to high FDR. In practice, confidence scores depend on numerous factors such as the overall quality of the data and the identity of the query compounds. Hence, these thresholds come with no guarantee in either direction: For example, in the CASMI 2016 dataset, a smaller confidence score threshold of 0.53 corresponded to exact FDR 10 %, and using the abovementioned threshold of 0.64 would have returned fewer hits than possible. Nevertheless, these thresholds may serve as a starting point for practitioners. Source data
Extended Data Fig. 10
Extended Data Fig. 10. The 315 molecular structures not contained in HMDB annotated with high confidence in the human dataset.
Confidence score threshold 0.64 was used. For none of these structures, reference MS/MS data are available. Structures are shown with identification number (ID), molecular formula and COSMIC confidence score. Structures present in the latest version of HMDB (Feb 2021) are marked by an asterisk. Colors indicate compound classes. Notably, 48 compounds were annotated as proteinogenic peptides; these structures were absent from HMDB but are clearly no novel metabolite structures. Lipid structures must be interpreted with some care: It is understood that neither COSMIC nor any other method can deduce, say, the position of the double bond in a carbon chain from MS/MS data alone; rather, this happens to be the candidate present in our biomolecule structure database.

References

    1. Cohen LJ, et al. Commensal bacteria make GPCR ligands that mimic human signalling molecules. Nature. 2017;549:48–53. - PMC - PubMed
    1. Nguyen DD, et al. Indexing the Pseudomonas specialized metabolome enabled the discovery of poaeamide B and the bananamides. Nat. Microbiol. 2016;2:16197. - PMC - PubMed
    1. Nothias L-F, et al. Feature-based molecular networking in the GNPS analysis environment. Nat. Methods. 2020;17:905–908. - PMC - PubMed
    1. Haug K, et al. MetaboLights: a resource evolving in response to the needs of its scientific community. Nucleic Acids Res. 2019;48:D440–D444. - PMC - PubMed
    1. Sud M, et al. Metabolomics Workbench: an international repository for metabolomics data and metadata, metabolite standards, protocols, tutorials and training, and analysis tools. Nucleic Acids Res. 2015;44:D463–D470. - PMC - PubMed

Publication types