. 2021 Oct;3(10):1313-1326.
doi: 10.1038/s42255-021-00471-y. Epub 2021 Oct 14.

Non-canonical glutamine transamination sustains efferocytosis by coupling redox buffering to oxidative phosphorylation

Affiliations

Non-canonical glutamine transamination sustains efferocytosis by coupling redox buffering to oxidative phosphorylation

Johanna Merlin et al. Nat Metab. 2021 Oct.

Abstract

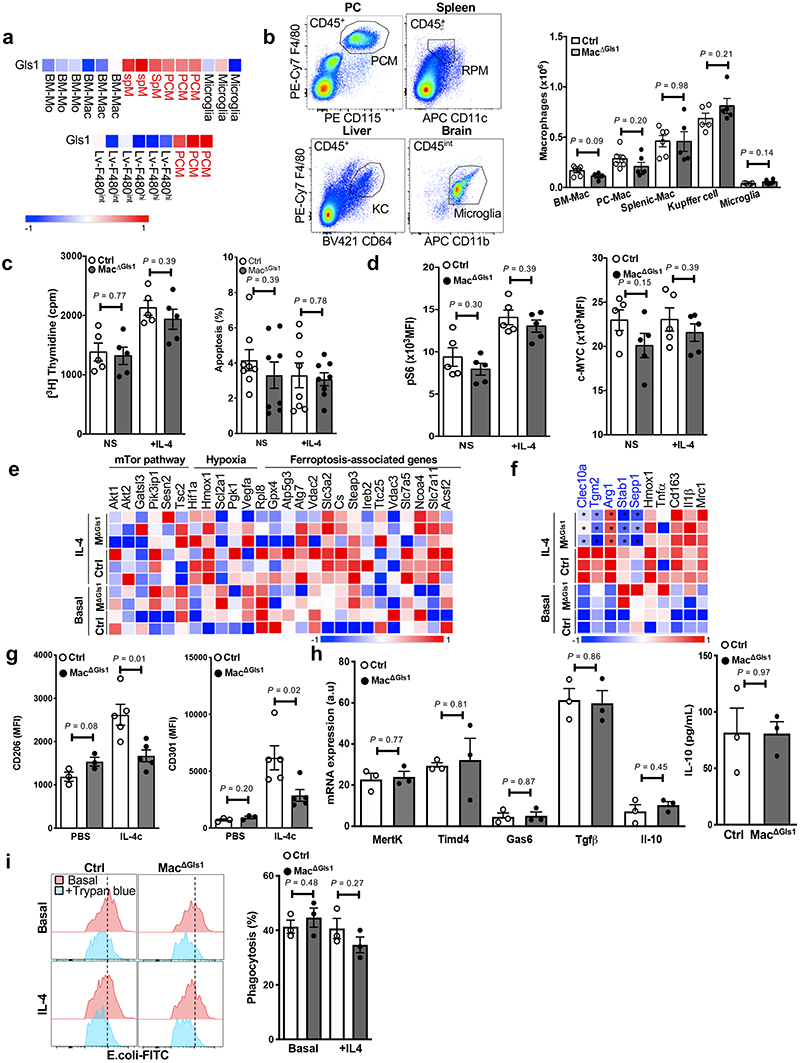
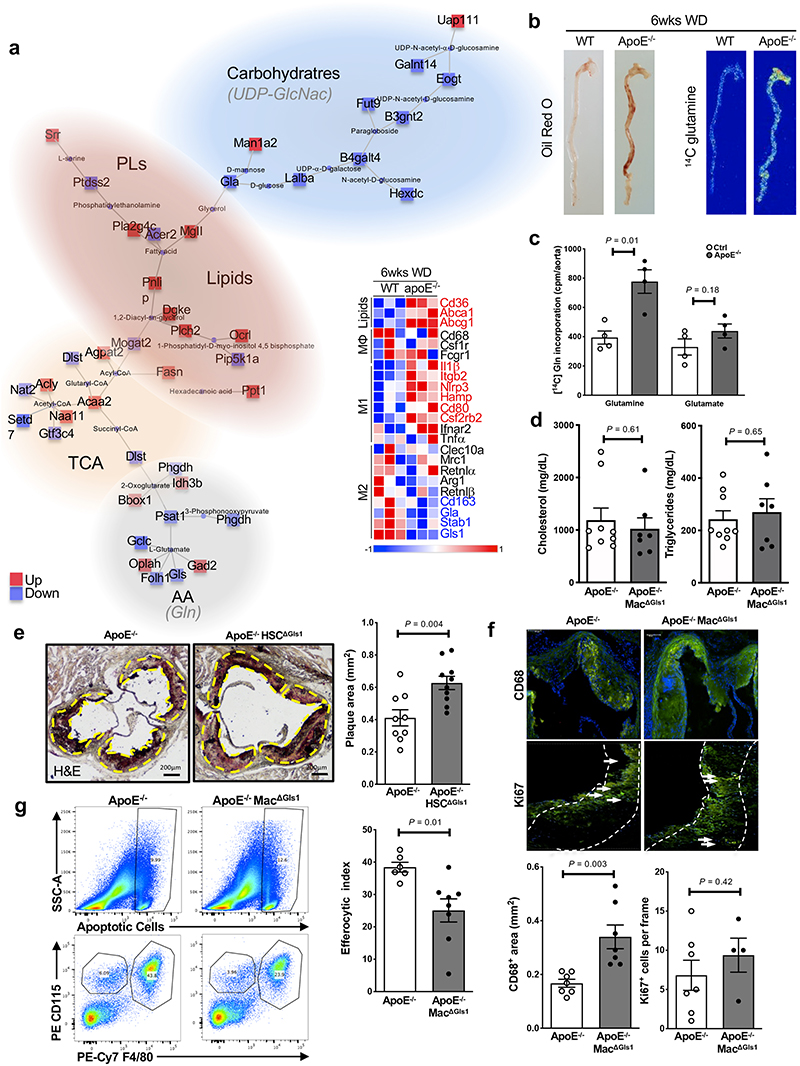
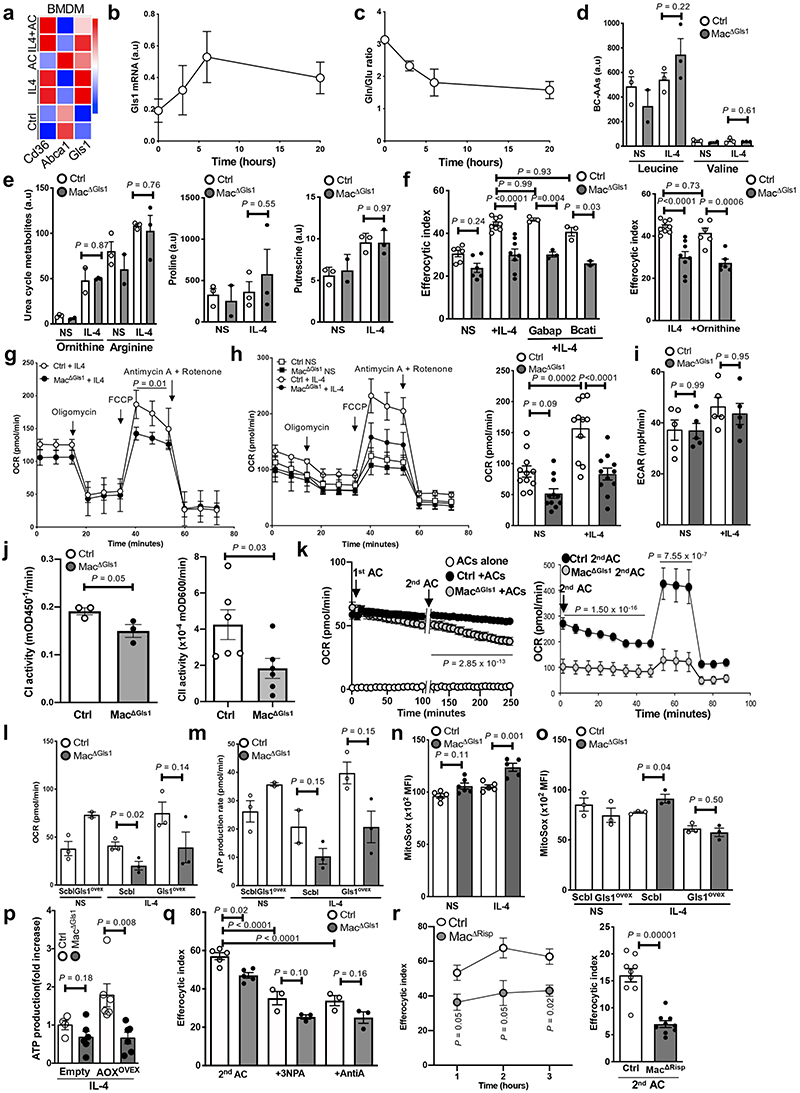
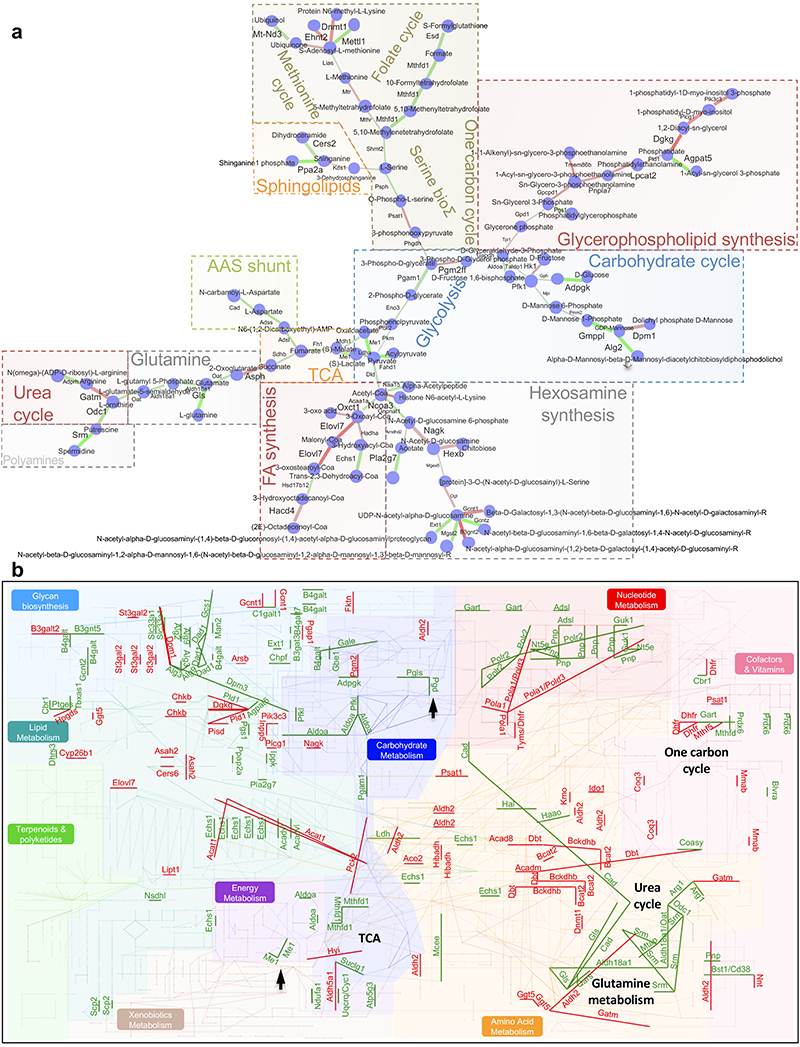
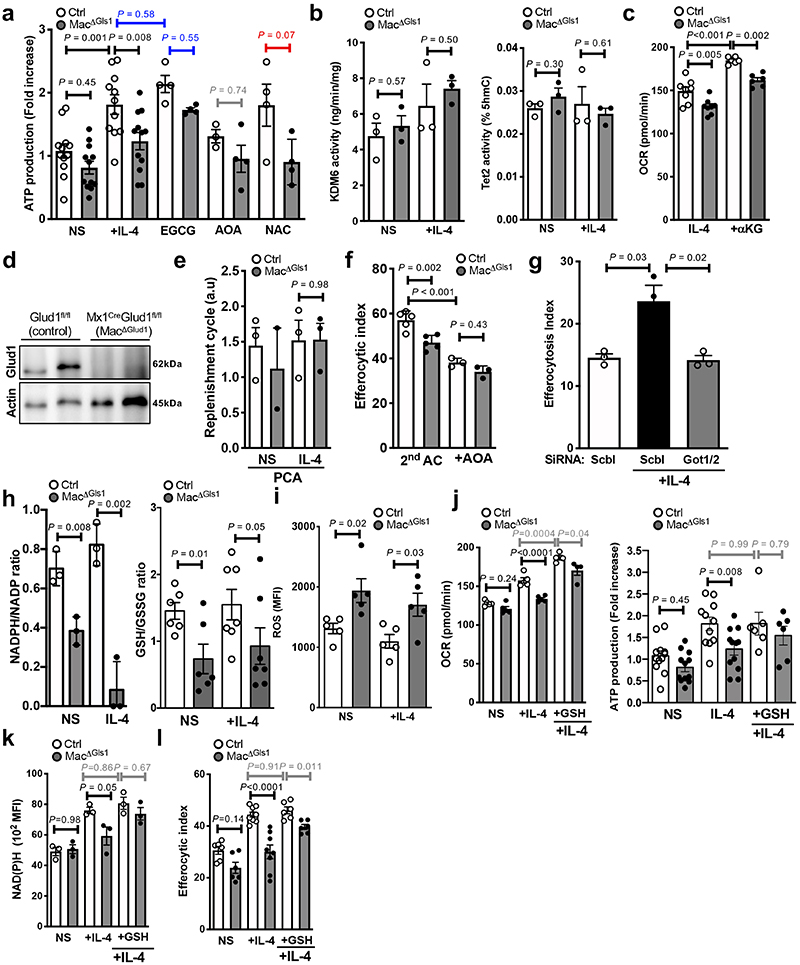
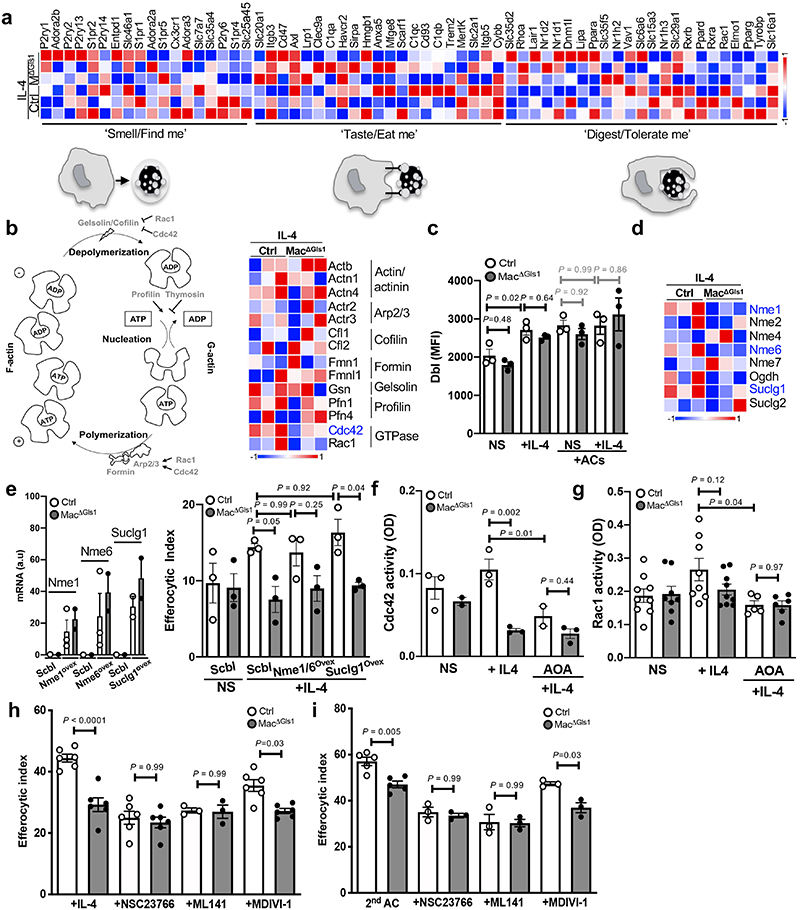
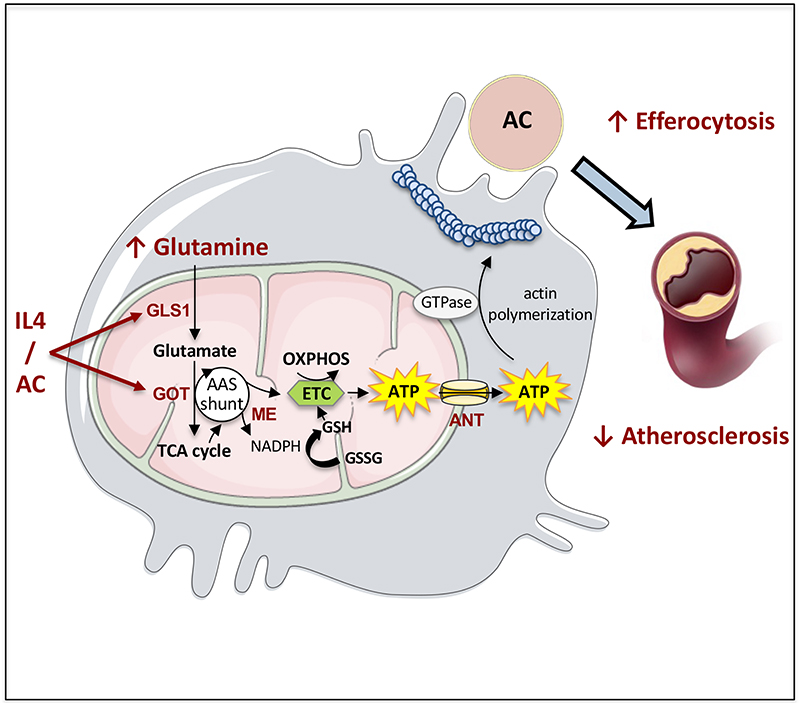
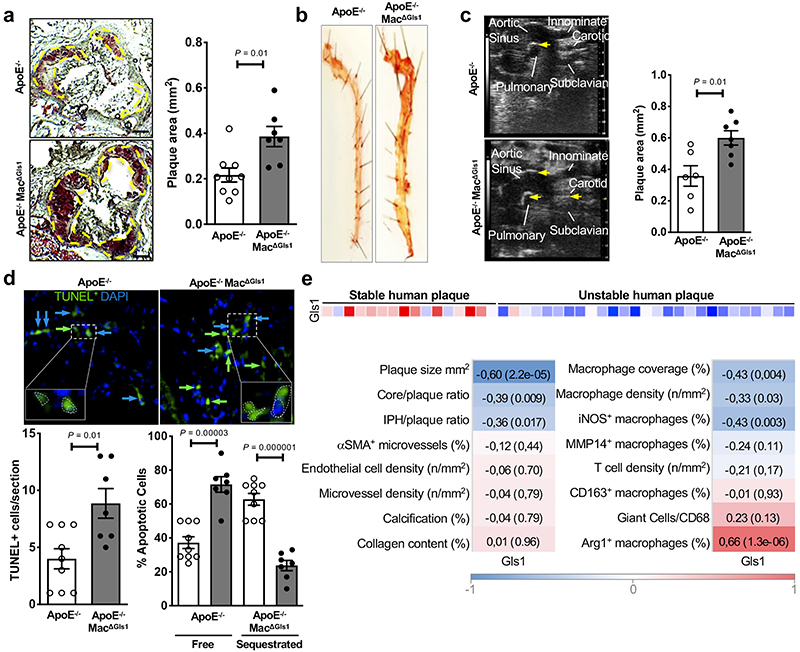
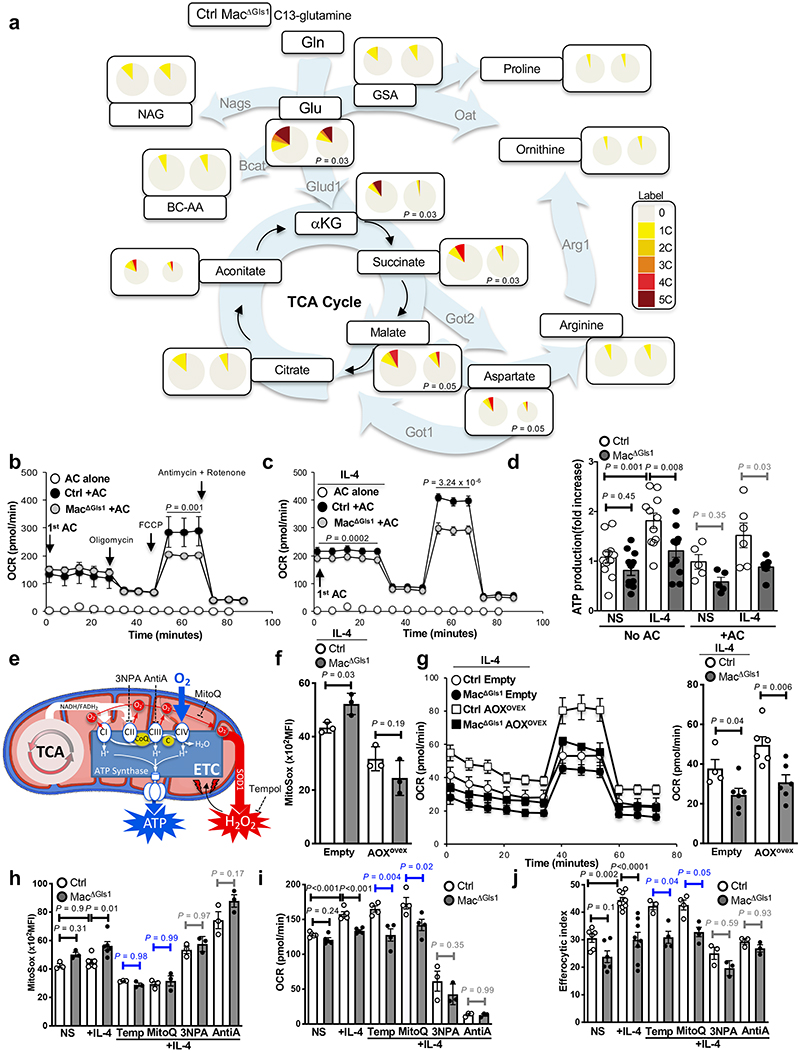
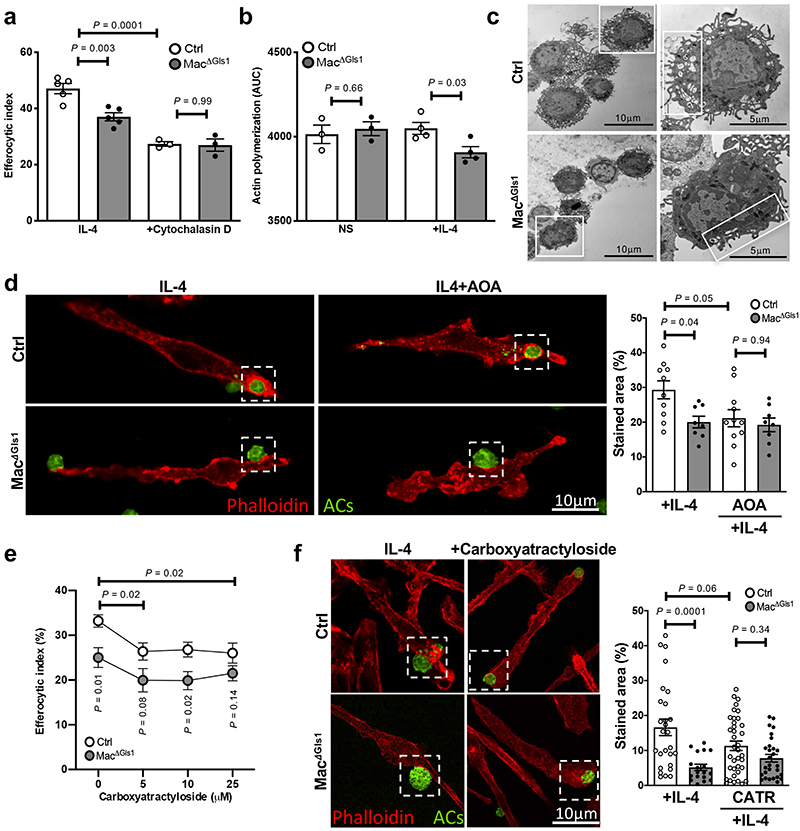
Macrophages rely on tightly integrated metabolic rewiring to clear dying neighboring cells by efferocytosis during homeostasis and disease. Here we reveal that glutaminase-1-mediated glutaminolysis is critical to promote apoptotic cell clearance by macrophages during homeostasis in mice. In addition, impaired macrophage glutaminolysis exacerbates atherosclerosis, a condition during which, efficient apoptotic cell debris clearance is critical to limit disease progression. Glutaminase-1 expression strongly correlates with atherosclerotic plaque necrosis in patients with cardiovascular diseases. High-throughput transcriptional and metabolic profiling reveals that macrophage efferocytic capacity relies on a non-canonical transaminase pathway, independent from the traditional requirement of glutamate dehydrogenase to fuel ɑ-ketoglutarate-dependent immunometabolism. This pathway is necessary to meet the unique requirements of efferocytosis for cellular detoxification and high-energy cytoskeletal rearrangements. Thus, we uncover a role for non-canonical glutamine metabolism for efficient clearance of dying cells and maintenance of tissue homeostasis during health and disease in mouse and humans.


Conflict of interest statement

Conflict of interest.

The authors declare no conflict of interest.

Figures

Extended Data Fig. 1
Extended Data Fig. 2
Extended Data Fig. 3
Extended Data Fig. 4
Extended Data Fig. 5
Extended Data Fig. 6
Extended Data Fig. 7
Figure 1
Figure 1. Macrophage-Gls1 deletion impairs efferocytosis in vitro and in vivo.
(a) Western blot of GLS1 protein (left) and glutamate levels (right) in Gls1 fl/fl control and MacΔGls1 PCMs. (b) Efferocytic index gating strategy (left) and quantification (right) measured by flow cytometry after 45min exposure with apoptotic cells (ACs) in Cre+ control and MacΔGls1 PCMs at steady state (resting condition) or after overnight IL-4 stimulation (reparative condition). (c) Similar experiments were performed in resting and reparative control (both Gls1 fl/fl and Cre+) and MacΔGls1 BMDMs. Efferocytic index was calculated as follows: (number of macrophages with ACs/total number of macrophages) × 100. (d) qPCR quantification (left) and efferocytic index (right) in Gls1 fl/fl control and MacΔGls1 BMDMs stimulated overnight with IL-4 after Gls1 lentivirus overexpression. (e) Efferocytic index gating strategy (left) and quantification (right) measured by flow cytometry after one (45min) or two (45min + 1-hour rest + 45min) incubations with ACs (resolving condition) in control (both Gls1 fl/fl and Cre+) and MacΔGls1 BMDMs. (f) Efferocytic index gating strategy (left) and quantification (right) measured by flow cytometry in Gls1 fl/fl control and MacΔGls1 Kupffer cells (KC), red pulp macrophages (RPM) and monocyte-derived macrophages (MoMac) after labelled apoptotic thymocytes i.v. injection. Both sexes were analyzed. All values are mean ± SEM and are representative of at least one independent experiment (n=6 independent animals for a, c, e, n=3 to 6 for d, n=3 for b). Western blot results in a are representative experiments of two biologically independent replicates. P values were determined by two-tailed Student’s t-test. Source data are provided as a Source Data file (a-f).
Figure 2
Figure 2. Myeloid-Gls1 deletion impairs efferocytosis in the pathological process of atherosclerosis.
(a) Representative sections (left) and quantification (right) of aortic plaques from Apoe-/- or Apoe-/- MacΔGls1 mice (12 weeks WD) stained for Oil Red O and Hematoxylin Eosin. Scale bar: 200μm. Both sexes were analyzed. (b) Oil red O stained descending aortas from representative female Apoe-/- or Apoe-/- MacΔGls1 mice maintained on a WD for 12 weeks. (c) Echography (left) and quantification (right) of aortic plaques from male Apoe-/- or Apoe-/- MacΔGls1 mice fed for 12 weeks on WD. Arrows indicate plaque areas. (d) Representative images (top) and quantification (bottom) of TUNEL+ cells (green) in aortic plaques from Apoe -/- or Apoe-/- MacΔGls1 mice (12 weeks WD). Sections were counterstained with DAPI (blue). TUNEL positive apoptotic cell (AC) either free (TUNEL-positive considered as apoptotic bodies) or cell sequestrated (TUNEL-positive associated with large cellular nuclei considered as efferocytes) was quantified. All values are mean ± SEM and are representative of at least one independent experiment (n=6 to 9 independent animals for a, c, d). P values were determined by two-tailed Student’s t-test. Source data are provided as a Source Data file (a, c, d). (e) Correlation between Gls1 expression and human atherosclerotic plaque complexity in the Maastricht Pathology collection (Results are from 16 stable segments and 27 unstable segments; red indicates positive and blue negative correlations).
Figure 3
Figure 3. Glutamine metabolism fuels mitochondrial oxidative phosphorylation (OXPHOS) to support efferocytosis.
(a) Carbon fluxes using U-13C-glutamine. U-13C glutamine was added in the medium of reparative IL-4 treated macrophages for 4 hours. Circle sizes are scaled with respect to pool size for individual metabolites and the number of carbon incorporated from U-13C glutamine is indicated by color code. Thin black arrows represent known metabolic pathway connections; background arrows indicate deduced major metabolic flows in reparative macrophages. Grey to dark red indicate increased number of carbons. (b) OCR measured by Seahorse after one incubation with ACs in control or MacΔGls1 BMDMs in resting conditions or (c) stimulated overnight with IL-4. (d) ATP production measured by Seahorse in resting and reparative control or MacΔGls1 BMDMs after one or no round of efferocytosis. (e) Schematic representation of mitochondria electron transport chain and its pharmacological inhibitors. (f) Mitochondrial ROS quantification using MitoSox by flow cytometry in reparative control or MacΔGls1 BMDMs after lentiviral vector-mediated overexpression of mitochondrial alternative oxidase (AOX) from Ciona intestinalis. (g) OCR measured by Seahorse in these cells. (h) MitoSox quantification, (i) OCR quantification and (j) efferocytic index in control or MacΔGls1 BMDMs at steady state or after overnight IL-4 stimulation +/- Tempol, Mitoquinol, 3NPA or antimicyn A. All values are mean ± SEM and are representative of at least one experiment (n=6 for a, n= 5 to 12 for b-d, n=3 for f-h, n=3 to 9 for i,j of biologically independent replicates). P values were determined by ordinary two-tailed Student’s t-test (a, b, c, f, g) or one-way ANOVA with Tukey post hoc test for multiple comparisons (d, h, i, j). Each statistical bar color-coded represents an independent one-way ANOVA test. Source data are provided as a Source Data table (a) or Source Data file (b-d, f-j).
Figure 4
Figure 4. Non-canonical transaminase pathway allows glutaminolysis to fuel OXPHOS and support efferocytosis.
(a) Schematic representation of glutamate incorporation into metabolic cycles. Red indicates up- and blue down-regulated pathways (b) Pathway enrichment analysis of RNA-seq profiling in resting and reparative control or MacΔGls1 PCMs. Pathways highlighted in red and blue indicated significant up- or down-regulation, respectively. (c) OCR quantification (left panel) and efferocytic index (right panel) in control or MacΔGls1 BMDMs at steady state or after overnight IL-4 stimulation +/- EGCG, AOA or NAC. (d) OCR measurements and (e) ATP production rate measured by Seahorse and (f) efferocytic index in control or MacΔGlud1 BMDMs at steady state or after overnight IL-4 stimulation +/- AOA. (g) NAD(P)H levels as assessed by endogenous fluorescence in control or MacΔGls1 BMDMs at steady state or after overnight IL-4 stimulation +/- EGCG, AOA or NAC. (h) NAD(P)H levels (left panel) and efferocytic index (right panel) in reparative control or MacΔGls1 BMDMs after lentiviral vector-mediated overexpression of empty, glutathione-disulfide reductase (Gsr) or malic enzymes (Me1 and Me2). All values are mean ± SEM and are representative of at least one experiment (n=5 for c (left), n= 3 to 12 for c (right), n=6 for d, n=3 for e,h, n=4 for f, n=6 for g of biologically independent replicates). P values were determined by ordinary one-way ANOVA with Tukey post hoc test for multiple comparisons (c-h). Each statistical bar color-coded represents an independent one-way ANOVA test against IL-4 conditions. Source data are provided as a Source Data file (c-h).
Figure 5
Figure 5. Glutamine metabolism supports the high-energy requirement of cytoskeletal rearrangement and corpse engulfment.
(a) Quantification of AC binding and internalization after treatment with 5μM cytochalasin D for 15 min before the addition of AC in control or MacΔGls1 BMDMs stimulated overnight +/- IL-4. (b) Actin polymerization assay in resting and reparative control or MacΔGls1 BMDMs. (c) Transmission electron microscopy imaging of control or MacΔGls1 PCMs. Left scale bar: 10μm. Right scale bar: 5μm. (d) Representative images of control or MacΔGls1 BMDMs stimulated overnight with IL-4 in presence or absence of AOA and stained for F-actin (Red) and ACs (green). Scale bar: 10μm. F-actin staining localized around the phagocytic cup was quantified. (e) Efferocytic index in reparative control or MacΔGls1 BMDMs after treatment with the indicated concentrations of carboxyatractyloside (CATR) for 15 min before the addition of AC. (f) Representative images and quantification of F-actin staining localized around the phagocytic cup after treatment with 5μM CATR for 15 min before the addition of AC. All values are mean ± SEM and are representative of at least one experiment (n=3-5 for a, n=3 for b,e of biologically independent replicates; n=9-11 for d, n=18-39 for f of biologically independent measurements). P values were determined by ordinary two-tailed Student’s t-test (b, e) or one-way ANOVA with Tukey post hoc test for multiple comparisons (a, d, f). Source data are provided as a Source Data file (a-b, d-f).

References

    1. Kojima Y, Weissman IL, Leeper NJ. The Role of Efferocytosis in Atherosclerosis. Circulation. 2017;135:476–489. - PMC - PubMed
    1. Elliott MR, Ravichandran KS. The Dynamics of Apoptotic Cell Clearance. Dev Cell. 2016;38:147–160. - PMC - PubMed
    1. Wang Y, et al. Mitochondrial Fission Promotes the Continued Clearance of Apoptotic Cells by Macrophages. Cell. 2017;171:331–345.:e22. - PMC - PubMed
    1. Yurdagul A, Jr, et al. Macrophage Metabolism of Apoptotic Cell-Derived Arginine Promotes Continual Efferocytosis and Resolution of Injury. Cell Metab. 2020;31:518–533.:e10. - PMC - PubMed
    1. Bosurgi L, et al. Macrophage function in tissue repair and remodeling requires IL-4 or IL-13 with apoptotic cells. Science. 2017;356:1072–1076. - PMC - PubMed

Publication types