. 2021 Mar;22(141):1-49.

Inference for Multiple Heterogeneous Networks with a Common Invariant Subspace

Affiliations

Inference for Multiple Heterogeneous Networks with a Common Invariant Subspace

Jesús Arroyo et al. J Mach Learn Res. 2021 Mar.

Abstract

The development of models and methodology for the analysis of data from multiple heterogeneous networks is of importance both in statistical network theory and across a wide spectrum of application domains. Although single-graph analysis is well-studied, multiple graph inference is largely unexplored, in part because of the challenges inherent in appropriately modeling graph differences and yet retaining sufficient model simplicity to render estimation feasible. This paper addresses exactly this gap, by introducing a new model, the common subspace independent-edge multiple random graph model, which describes a heterogeneous collection of networks with a shared latent structure on the vertices but potentially different connectivity patterns for each graph. The model encompasses many popular network representations, including the stochastic blockmodel. The model is both flexible enough to meaningfully account for important graph differences, and tractable enough to allow for accurate inference in multiple networks. In particular, a joint spectral embedding of adjacency matrices-the multiple adjacency spectral embedding-leads to simultaneous consistent estimation of underlying parameters for each graph. Under mild additional assumptions, the estimates satisfy asymptotic normality and yield improvements for graph eigenvalue estimation. In both simulated and real data, the model and the embedding can be deployed for a number of subsequent network inference tasks, including dimensionality reduction, classification, hypothesis testing, and community detection. Specifically, when the embedding is applied to a data set of connectomes constructed through diffusion magnetic resonance imaging, the result is an accurate classification of brain scans by human subject and a meaningful determination of heterogeneity across scans of different individuals.

Keywords: community detection; multiple random graphs; spectral embeddings.


Figures

Figure 1:
Figure 1:
Graphical representation of the multiple adjacency spectral embedding algorithm (MASE, see Algorithm 1) for estimating the common invariant subspace V in a multilayer stochastic blockmodel (see Definition 3).
Figure 2:
Figure 2:
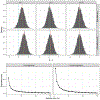
The top panel shows the distribution of the difference between the MASE estimates and true eigenvalues of a single graph. The graphs in the sample are distributed according to a two-block multilayer SBM with n = 300 vertices, block connection probability matrix B(i) = 0.3I + 0.111. The distributions appear to be Gaussian, and as the sample size m increases, the mean of the distribution (red solid line) approaches to zero (blue dashed line). This phenomenon is also observed in the bottom panel, which shows that the estimation bias decreases with the sample size.
Figure 3:
Figure 3:
The top panel shows the distribution of the difference between the MASE estimates and true eigenvalues of a single graph. The graphs in the sample are distributed according to a two-block multilayer SBM, block connection probability matrix B(i) = 0.3I + 0.111, and a fixed sample size m = 3 but different number of vertices n. The estimation bias remains positive even with a large graph size (bottom panel), and for any fixed n the mean of the distributions (red solid line) is away from zero (blue dashed line), but the distributions appear to be Gaussian.
Figure 4:
Figure 4:
Distance between the true and estimated invariant subspaces computed with MASE (scaled and unscaled ASE) and ASE of the mean of the graphs for a sample of graphs distributed according to a multilayer SBM with 3 communities. On the left panel, all graphs have the same expected matrix. The three methods perform almost the same, reducing the error as the sample size increases. On the right panel, the connection probabilities of the SBM are chosen uniformly at random for each graph. ASE on the average adjacency matrix performs poorly, while MASE still improves with a larger sample size.
Figure 5:
Figure 5:
Out-of-sample classification accuracy as a function of the difference between classes for different graph embedding methods. Graphs in the sample are distributed as a multilayer SBM with n = 256 vertices, two communities, four different connectivity matrices that correspond to the class labels, and a training and test samples with m = 40 graphs. As the separation between the classes increase, all methods improve performance, but MASE and OMNI show the most gains.
Figure 6:
Figure 6:
Average normalized mean squared error of estimating the expected adjacency matrix of a sample of graphs using different embedding methods. Graphs in the sample are distributed as a multilayer SBM with n = 256 vertices, two communities, four different classes of connectivity matrices, and a training and test samples with m = 40 graphs. MASE and JE are the only methods that are flexible enough to capture the heterogeneous structure of the graphs, but MASE shows superior performance among these two. As the graphs become more different, the error of MRDPG and OMNI increases.
Figure 7:
Figure 7:
Performance in community detection of a Gaussian mixture clustering applied to a common set of vertex latent positions estimated with different methods, for a sample of m = 40 two-block multilayer SBM graphs, with n = 256 vertices, and four classes of connectivity matrices. The class separation controls the magnitude of the smallest eigenvalue of the graphs, and as this increases, all methods show better accuracy. MRDPG, which is based on a non-convex optimization problem, performance the best for small α, but as long as α is large enough, MASE and OMNI also show a great performance.
Figure 8:
Figure 8:
Empirical power for rejecting the null hypothesis that two graphs have the same distribution as a function of the difference in their parameters at a 0.05 significance level (black dotted line). Both graphs are sample from a mixed-membership SBM A(i) ~ MMSBM(Z(i), B(i)). In the left panel, the community assignments Z(1) and Z(2) are the same, while the connection probability changes on the x-axis. In the right panel, B(1) = B(2), while the community assignments of a few nodes change. Both methods improve their power as the difference between the graphs get larger, but MASE can effectively use the common subspace structure to outperform OMNI when the difference between the B matrices is small. The p-values of MASE are estimated accurately usign a parametric bootstrap, while the asymptotic distribution is only valid in the first scenario when the common invariant subspace is represented in both graphs.
Figure 9:
Figure 9:
Histogram of the embedding dimension selected by the method of Zhu and Ghodsi (2006) for each of the 300 graphs in the HNU1 data. The graphs are composed by 200 vertices, and the values of the embedding dimensions ranges between 5 and 18.
Figure 10:
Figure 10:
Scree plot of the top singular values of the concatenated scaled (left) and unscaled (right) adjacency spectral embeddings of the HNU1 data graphs. The plots show the 100 largest singular values ordered by magnitude. In both scaled and unscaled methods, we identified an elbow at d = 15.
Figure 11:
Figure 11:
Estimated latent positions obtained by MASE on the HNU1 data graphs with a 3-dimensional embedding.
Figure 12:
Figure 12:
Matrix of distances between the estimated score parameters. Each entry of the matrix corresponds to the distance between the MASE estimated score matrices of a pair of graphs from the HNU1 data, composed by 30 subjects with 10 graphs each. Distances between graphs of the same subject are usually smaller than distances between different subjects.
Figure 13:
Figure 13:
Multidimensional scaling of the individual graph representations obtained by MASE for the HNU1 data. The plot shows the positions discovered by MDS for the graphs corresponding to 5 subjects of the data, showing that graphs corresponding to the same subject are more similar between each other.
Figure 14:
Figure 14:
Cross-validation error in classifying the subject labels of the HNU1 data. For each embedding estimated with a different method, a 1-NN classifier was trained using the distance between the individual graph embeddings, varying the number of embedding dimensions (left plot) which control the description length of the different embeddings (right plot). MASE, OMNI and CISE are the only methods that achieve perfect accuracy, but MASE requires much fewer parameters.
Figure 15:
Figure 15:
Matrices of p-values for the hypothesis test that a pair of graphs has the same score matrix in the COSIE model. Each entry corresponds to the aforementioned test for a pair of the graphs in the HNU1 data. The test generally assigns small p-values to pairs of graphs corresponding to different subjects, and large p-values to same-subject pairs.
Figure 16:
Figure 16:
Proportion of rejected test as a function of the significance level for pairwise equal distribution tests between pairs of graphs representing scans of the same subject (left) and different subjects (right). The black dotted line on the left figure corresponds to the identity, indicating the expected proportion of rejections assuming that the distribution of same-subject graphs is the same. The test constructed with MASE estimates either using the asymptotic distribution (MASE-A) or parametric bootstrap (MASE-B) to approximate the null is rejected more often than the OMNI test.

References

    1. Abbe Emmanuel. Community detection and stochastic block models: recent developments. Journal of Machine Learning Research, 18:1–86, 2017.
    1. Airoldi Edoardo M, Blei David M, Fienberg Stephen E, and Xing Eric P. Mixed membership stochastic blockmodels. Journal of Machine Learning Research, 9:1981–2014, 2007. - PMC - PubMed
    1. Arroyo Jesus and Hou Elizabeth. Efficient distributed estimation of inverse covariance matrices. In 2016 IEEE Statistical Signal Processing Workshop (SSP), pages 1–5. IEEE, jun 2016.
    1. Relión Jesús D. Arroyo, Kessler Daniel, Levina Elizaveta, and Taylor Stephan F.. Network classification with applications to brain connectomics. Ann. Appl. Stat, 13(3):1648–1677, 09 2019. - PMC - PubMed
    1. Athreya Avanti, Priebe Carey E, Tang Minh, Lyzinski Vince, Marchette David J, and Sussman Daniel L.. A limit theorem for scaled eigenvectors of random dot product graphs. Sankhya A, 78: 1–18, 2016.

LinkOut - more resources