

Selective STAT3 Inhibitor Alantolactone Ameliorates Osteoarthritis via Regulating Chondrocyte Autophagy and Cartilage Homeostasis
- PMID: 34650433
- PMCID: PMC8505527
- DOI: 10.3389/fphar.2021.730312
Selective STAT3 Inhibitor Alantolactone Ameliorates Osteoarthritis via Regulating Chondrocyte Autophagy and Cartilage Homeostasis
Abstract
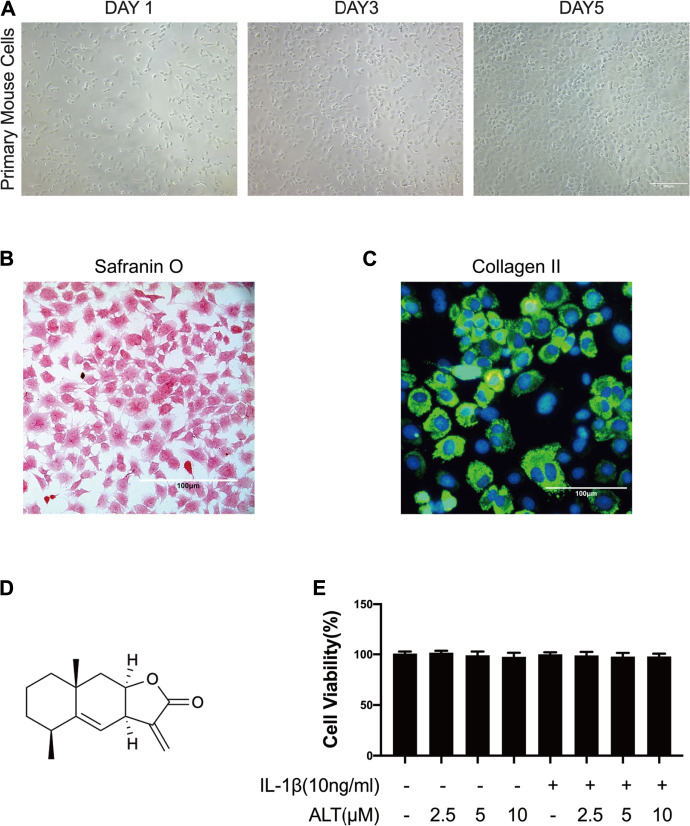
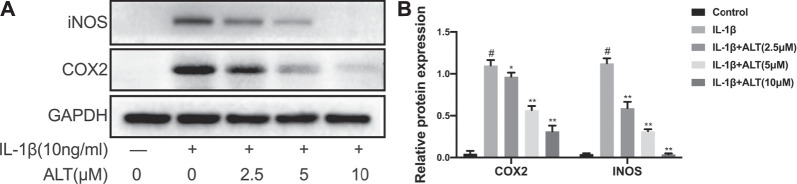
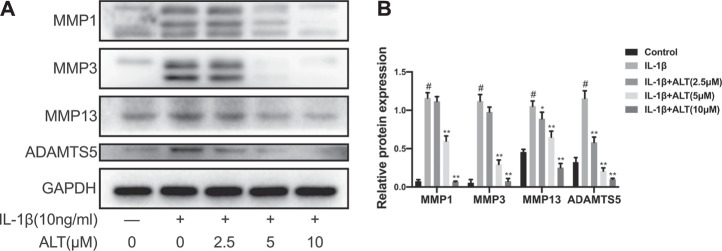
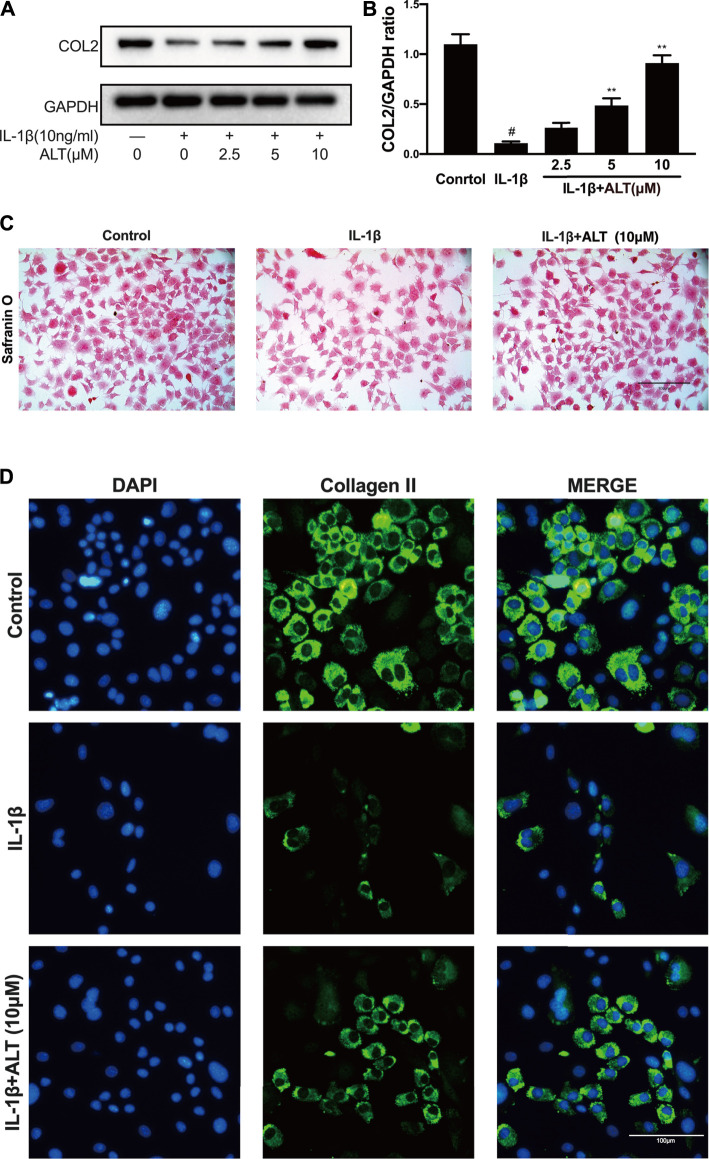
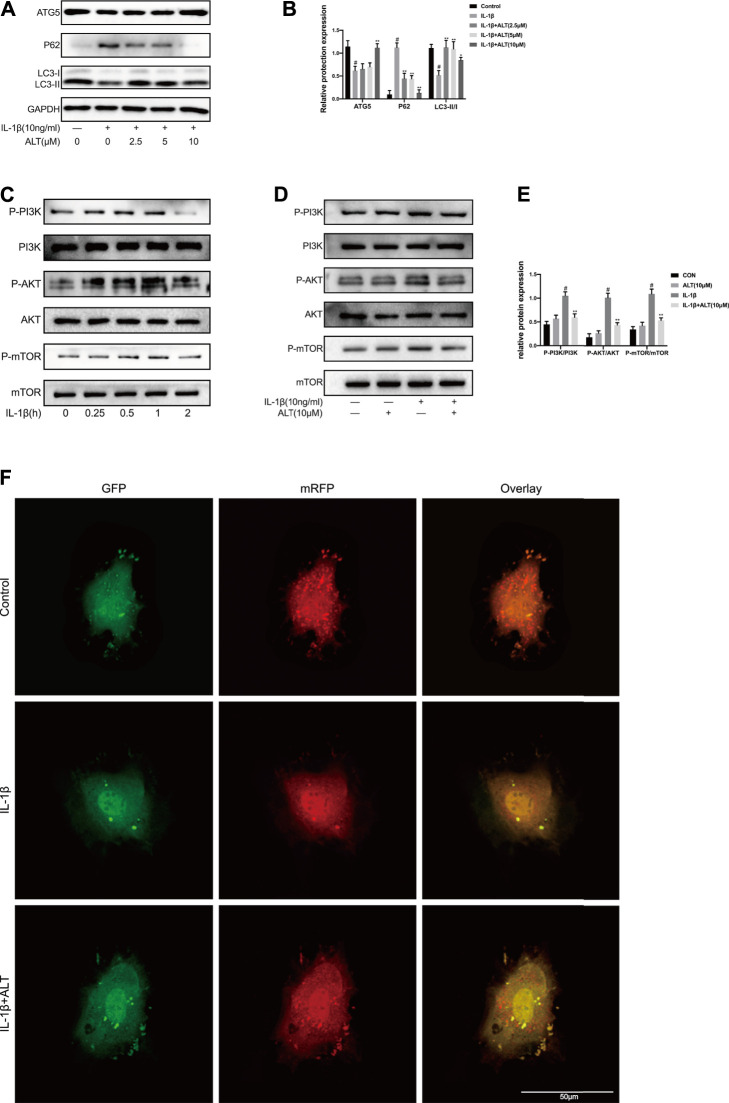
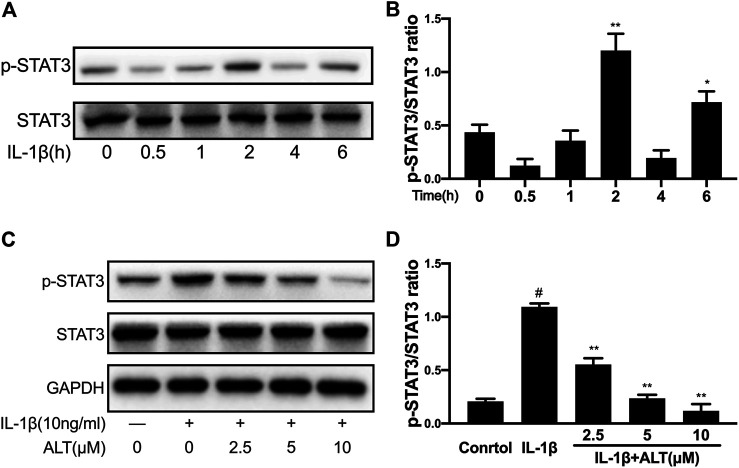
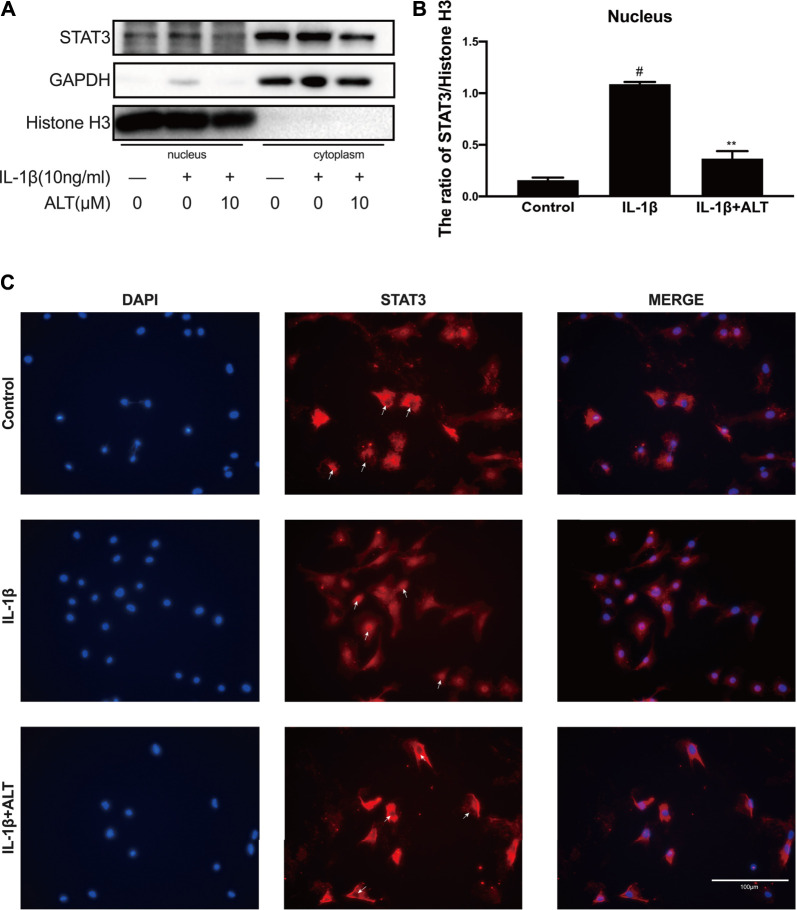
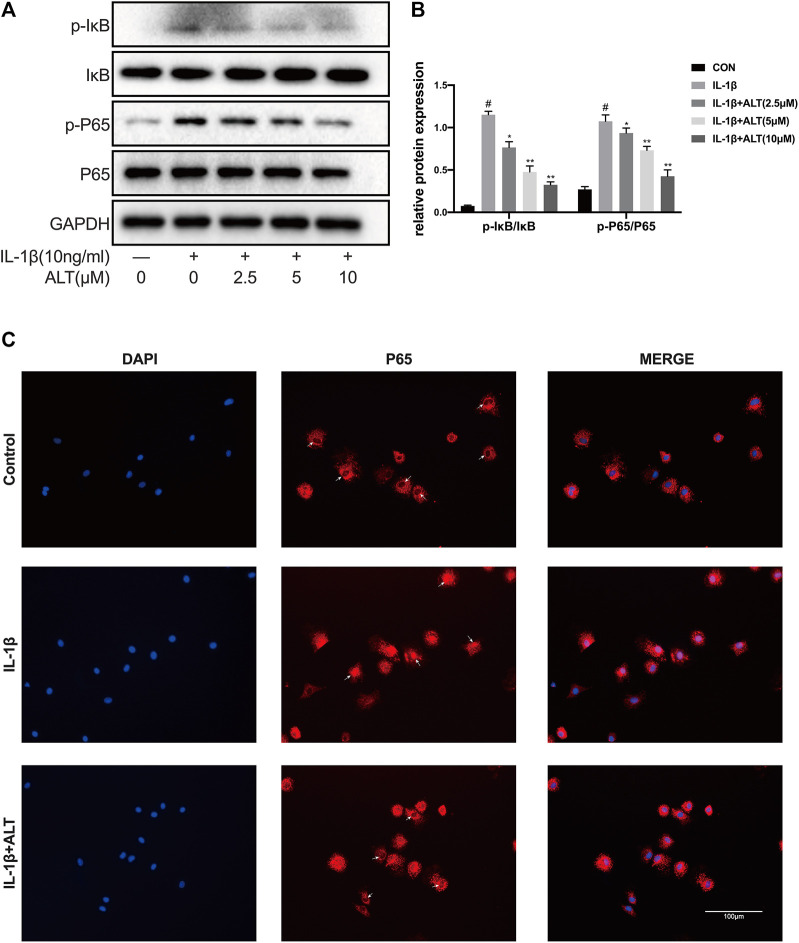
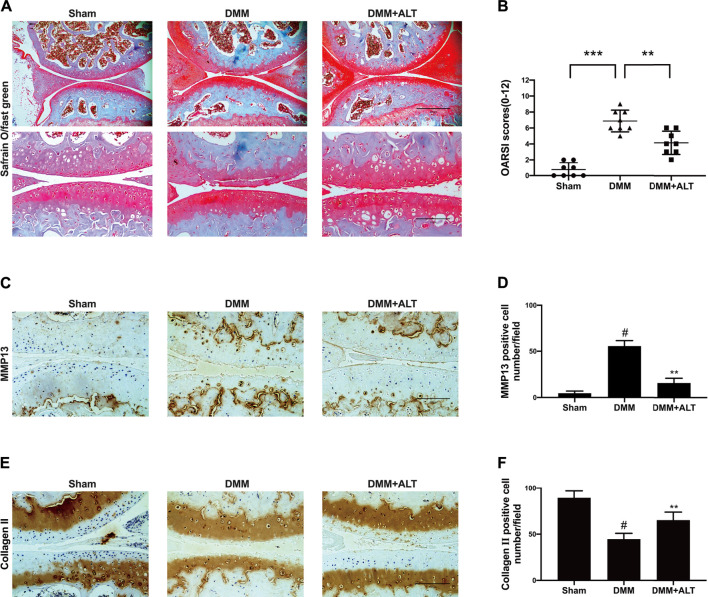
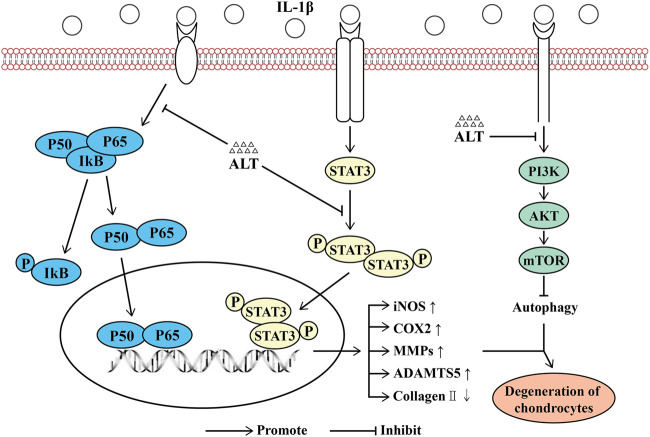
Osteoarthritis (OA), which is identified by chronic pain, impacts the quality of life. Cartilage degradation and inflammation are the most relevant aspects involved in its development. Signal transducer and activator of transcription 3(STAT3), a member of the STATs protein family, is associated with inflammation. Alantolactone (ALT), a sesquiterpene lactone compound, can selectively suppress the phosphorylation of STAT3. However, the pharmacological effect of ALT on OA is still imprecise. In this study, IL-1β (10 ng/ml) was applied to cartilage chondrocytes, which were treated with different concentrations of Alantolactone for 24 h. The expression of inducible nitric oxide synthase (iNOS), cyclooxygenase-2(COX2), matrix metalloproteinases (MMPs) and thrombospondin motifs-5 (ADAMTS5) were detected by western blot. Protein expression of Collagen Ⅱ was observed by western blot, safranin O staining and immunofluorescence. Manifestation of autophagy related proteins such as autophagy-related gene-5 (ATG5), P62, LC3Ⅱ/Ⅰ and PI3K/AKT/mTOR-related signaling molecules were measured by western blot and autophagic flux monitored by confocal microscopy. Expression of STAT3 and NF-κB-related signaling molecules were evaluated by western blot and immunofluorescence. In vivo, 2 mg/kg ALT or equal bulk of vehicle was engaged in the destabilization of medial meniscus (DMM) mouse models by intra-articular injection, the degree of cartilage destruction was classified by Safranin O/Fast green staining. Our findings reported that the enhance of inflammatory factors containing iNOS, COX2, MMPs and ADAMTS5 induced by IL-1β could be ameliorated by ALT. Additionally, the diminish of Collagen Ⅱ and autophagy which was stimulated by IL-1β could be alleviated by ALT. Mechanistically, STAT3, NF-κB and PI3K/AKT/mTOR signal pathways might be involved in the effect of ALT on IL-1β-induced mouse chondrocytes. In vivo, ALT protected cartilage in the DMM mouse model. Overall, this study illustrated that ALT attenuated IL-1β-induced inflammatory responses, relieved cartilage degeneration and promoted impaired autophagy via restraining of STAT3 and NF-κB signal pathways, implying its auspicious therapeutical effect for OA.
Keywords: MMPs; NF-κB; alantolactone; autophagy; osteoarthritis; stat3.
Copyright © 2021 Pei, Huang, Ni, Zhang, Niu and You.
Conflict of interest statement
The authors declare that the research was conducted in the absence of any commercial or financial relationships that could be construed as a potential conflict of interest.
Figures
Similar articles
-
Alantolactone: A Natural Plant Extract as a Potential Therapeutic Agent for Cancer.Front Pharmacol. 2021 Nov 26;12:781033. doi: 10.3389/fphar.2021.781033. eCollection 2021. Front Pharmacol. 2021. PMID: 34899346 Free PMC article. Review.
-
Schisandrin A Inhibits the IL-1β-Induced Inflammation and Cartilage Degradation via Suppression of MAPK and NF-κB Signal Pathways in Rat Chondrocytes.Front Pharmacol. 2019 Jan 29;10:41. doi: 10.3389/fphar.2019.00041. eCollection 2019. Front Pharmacol. 2019. PMID: 30761007 Free PMC article.
-
Oroxin B alleviates osteoarthritis through anti-inflammation and inhibition of PI3K/AKT/mTOR signaling pathway and enhancement of autophagy.Front Endocrinol (Lausanne). 2022 Dec 1;13:1060721. doi: 10.3389/fendo.2022.1060721. eCollection 2022. Front Endocrinol (Lausanne). 2022. PMID: 36531454 Free PMC article.
-
Alpha-Mangostin protects rat articular chondrocytes against IL-1β-induced inflammation and slows the progression of osteoarthritis in a rat model.Int Immunopharmacol. 2017 Nov;52:34-43. doi: 10.1016/j.intimp.2017.08.010. Epub 2017 Aug 31. Int Immunopharmacol. 2017. PMID: 28858724
-
Phytochemicals Mediate Autophagy Against Osteoarthritis by Maintaining Cartilage Homeostasis.Front Pharmacol. 2021 Dec 20;12:795058. doi: 10.3389/fphar.2021.795058. eCollection 2021. Front Pharmacol. 2021. PMID: 34987406 Free PMC article. Review.
Cited by
-
Autophagy in the pathogenesis and therapeutic potential of post-traumatic osteoarthritis.Burns Trauma. 2023 Jan 31;11:tkac060. doi: 10.1093/burnst/tkac060. eCollection 2023. Burns Trauma. 2023. PMID: 36733467 Free PMC article. Review.
-
Bilobalide Exerts Anti-Inflammatory Effects on Chondrocytes Through the AMPK/SIRT1/mTOR Pathway to Attenuate ACLT-Induced Post-Traumatic Osteoarthritis in Rats.Front Pharmacol. 2022 Feb 23;13:783506. doi: 10.3389/fphar.2022.783506. eCollection 2022. Front Pharmacol. 2022. PMID: 35281931 Free PMC article.
-
Alantolactone: A Natural Plant Extract as a Potential Therapeutic Agent for Cancer.Front Pharmacol. 2021 Nov 26;12:781033. doi: 10.3389/fphar.2021.781033. eCollection 2021. Front Pharmacol. 2021. PMID: 34899346 Free PMC article. Review.
-
ChemPert: mapping between chemical perturbation and transcriptional response for non-cancer cells.Nucleic Acids Res. 2023 Jan 6;51(D1):D877-D889. doi: 10.1093/nar/gkac862. Nucleic Acids Res. 2023. PMID: 36200827 Free PMC article.
-
Cartilage progenitor cells derived extracellular vesicles-based cell-free strategy for osteoarthritis treatment by efficient inflammation inhibition and extracellular matrix homeostasis restoration.J Nanobiotechnology. 2024 Jun 19;22(1):345. doi: 10.1186/s12951-024-02632-z. J Nanobiotechnology. 2024. PMID: 38890638 Free PMC article.
References
-
- Bayliss L. E., Culliford D., Monk A. P., Glyn-Jones S., Prieto-Alhambra D., Judge A., et al. (2017). The Effect of Patient Age at Intervention on Risk of Implant Revision after Total Replacement of the Hip or Knee: a Population-Based Cohort Study. Lancet 389 (10077), 1424–1430. 10.1016/s0140-6736(17)30059-4 - DOI - PMC - PubMed
-
- Cai G., Aitken D., Laslett L. L., Pelletier J. P., Martel-Pelletier J., Hill C., et al. (2020). Effect of Intravenous Zoledronic Acid on Tibiofemoral Cartilage Volume Among Patients with Knee Osteoarthritis with Bone Marrow Lesions: A Randomized Clinical Trial. JAMA 323 (15), 1456–1466. 10.1001/jama.2020.2938 - DOI - PMC - PubMed
LinkOut - more resources
Full Text Sources
Research Materials
Miscellaneous