. 2021 Sep 28:12:752597.
doi: 10.3389/fmicb.2021.752597. eCollection 2021.

ORF3a Protein of Severe Acute Respiratory Syndrome Coronavirus 2 Inhibits Interferon-Activated Janus Kinase/Signal Transducer and Activator of Transcription Signaling via Elevating Suppressor of Cytokine Signaling 1

Affiliations

ORF3a Protein of Severe Acute Respiratory Syndrome Coronavirus 2 Inhibits Interferon-Activated Janus Kinase/Signal Transducer and Activator of Transcription Signaling via Elevating Suppressor of Cytokine Signaling 1

Rong Wang et al. Front Microbiol. .

Abstract

Coronavirus disease 2019 (COVID-19) has caused a crisis to global public health since its outbreak at the end of 2019. Severe acute respiratory syndrome coronavirus 2 (SARS-CoV-2), the pathogen of COVID-19, appears to efficiently evade the host immune responses, including interferon (IFN) signaling. Several SARS-CoV-2 viral proteins are believed to involve in the inhibition of IFN signaling. In this study, we discovered that ORF3a, an accessory protein of SARS-CoV-2, inhibited IFN-activated Janus kinase (JAK)/signal transducer and activator of transcription (STAT) signaling via upregulating suppressor of cytokine signaling 1 (SOCS1), a negative regulator of cytokine signaling. ORF3a induced SOCS1 elevation in a dose- and time-dependent manner. RNAi-mediated silencing of SOCS1 efficiently abolished ORF3a-induced blockage of JAK/STAT signaling. Interestingly, we found that ORF3a also promoted the ubiquitin-proteasomal degradation of Janus kinase 2 (JAK2), an important kinase in IFN signaling. Silencing of SOCS1 by siRNA distinctly blocked ORF3a-induced JAK2 ubiquitination and degradation. These results demonstrate that ORF3a dampens IFN signaling via upregulating SOCS1, which suppressed STAT1 phosphorylation and accelerated JAK2 ubiquitin-proteasomal degradation. Furthermore, analysis of ORF3a deletion constructs showed that the middle domain of ORF3a (amino acids 70-130) was responsible for SOCS1 upregulation. These findings contribute to our understanding of the mechanism of SARS-CoV-2 antagonizing host antiviral response.

Keywords: JAK/STAT signaling; Janus kinase 2 (JAK2); SARS-CoV-2; SOCS1; accessory protein ORF3a; ubiquitin-proteasomal degradation.


Conflict of interest statement

The authors declare that the research was conducted in the absence of any commercial or financial relationships that could be construed as a potential conflict of interest.

Figures

FIGURE 1
FIGURE 1
Severe acute respiratory syndrome coronavirus 2 accessory protein ORF3a inhibits IFN-activated JAK/STAT signaling. (A) ISRE luciferase reporter assay. HEK293T cells were cotransfected with ISRE-Luc reporter plasmid, pGL4.74 hRL-TK plasmid, and empty vector (EV) or expression plasmid of SARS-CoV-2 ORF3a. At 24 h post-transfection, the cells were mock-treated or treated with IFNα (500 U/mL) for 20 h and then subjected to Dual-Luciferase reporter assay. The fold activation was determined compared to that of the EV with mock-treated cells. (B–D) The expression levels of ISG15, ISG56, and STAT2 in HEK293T cells with ORF3a plasmid transfection. HEK293T cells were transfected with a plasmid expressing ORF3a for 24 h. Then, the cells were treated with IFNα. ISG15 (B) and ISG56 (C) mRNA levels were determined at 13 h after the IFN treatment by RT-PCR. STAT2 levels were detected at 20 h after the IFN treatment by immunoblotting (D). Relative levels of STAT2 are shown as folds below the images after normalization with β-actin in densitometry analysis. (E) Expression of ORF3a plasmid in HEK293T cells was confirmed by immunofluorescence staining with antibody against Flag. The upper panel shows ORF3a expression, and the lower panel shows an overlay of protein expression and DAPI staining. Bars in the images denote 20 μm. Significant differences from the IFN-treated EV control are denoted by “*” and “***”, which indicate P < 0.05 and P < 0.001, respectively. Error bars represent standard errors of the results of repeated experiments.
FIGURE 2
FIGURE 2
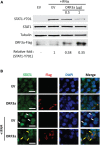
ORF3a dampens IFN-activated signaling via restraining STAT1 phosphorylation and nuclear translocation. (A) ORF3a inhibits IFN-induced phosphorylation of STAT1 in HEK293T cells. Cells were transfected with 0.5 or 1 μg of ORF3a plasmid. Forty-eight hours later, the cells were stimulated with IFNα at 500 U/mL for 0.5 h, then harvested for immunoblotting with antibodies against STAT1-Y701, STAT1, tubulin, and Flag. Relative levels of STAT1-Y701 are shown as folds below the images after normalization with tubulin. (B) ORF3a restrains nuclear translocation of STAT1. The transfected cells were treated with IFNα for 0.5 h and then fixed with paraformaldehyde for immunofluorescence assay with antibodies against STAT1 (green) and Flag (red). DAPI staining of nuclear DNA is also shown. Arrows were added to show the STAT1 in the nucleus (white) or cytoplasm (yellow). Bars in images denote 20 μm.
FIGURE 3
FIGURE 3
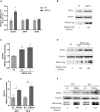
ORF3a increases SOCS1 expression. (A) ORF3a increases the transcription level of SOCS1 instead of SHP1 and SHP2. HEK293T cells were transfected with empty vector (EV) or ORF3a plasmid. At 24 h after transfection, the cells were harvested for RT-qPCR. (B) ORF3a increases the protein level of SOCS1. Cells were treated similarly as A, then harvested at 36 h after transfection for immunoblotting. (C,D) ORF3a induces SOCS1 upregulation in a dose-dependent manner. HEK293T cells were transfected with incremental amounts of ORF3a plasmid for determining SOCS1 at mRNA (C) and protein (D) levels. (E,F) ORF3a increases SOCS1 expression along with time extension. The cells transfected with EV or ORF3a plasmid were harvested at 24 and 36 h after transfection. The transcripts (E) and proteins (F) of SOCS1 were detected. Error bars represent standard errors of the results of repeated experiments. Significant differences from the EV-transfected control cells are denoted by “*” and “**”, which indicates P < 0.05 and P < 0.01, respectively. In densitometry analysis, relative levels of SOCS1 in comparisons with EV samples are shown as folds below the images after normalization with tubulin.
FIGURE 4
FIGURE 4
Silencing of SOCS1 abolishes the inhibitory effect of ORF3a on IFN signaling transduction. (A,B) SOCS1 mRNA and protein levels in cells transfected with siRNA control (NC) or siRNA against SOCS1 (si-SOCS1). HEK293T cells were transfected with NC or si-SOCS1 (100 nM). Forty-eight hours later, the cells were harvested for RT-qPCR (A) and immunoblotting (B). Significant differences from the NC-transfected control cells are denoted by “**”, which indicates P < 0.01. (C) Silencing of SOCS1 restored the STAT1 activation in cells transfected with ORF3a. Cells were cotransfected with empty vector or ORF3a plasmid along with NC or si-SOCS1. At 48 h after transfection, the cells were stimulated with IFNα for 0.5 h and then harvested for immunoblotting with antibodies against STAT1-Y701, STAT1, and tubulin. Relative levels of proteins are shown as folds below the images after normalization with tubulin.
FIGURE 5
FIGURE 5
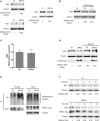
ORF3a reduces JAK2 expression via the proteasome pathway. (A) ORF3a reduces the JAK2 level, but not JAK1 and TYK2. HEK293T cells were transfected with empty vector (EV) or ORF3a plasmid, then harvested for immunoblotting at 36 h post-transfection. (B) ORF3a decreases JAK2 in a dose-dependent manner. Cells were transfected with incremental amounts of ORF3a plasmid and then harvested for immunoblotting to determine the JAK2 level. (C) JAK2 mRNA level is not affected by ORF3a expression. HEK293T cells were transfected with EV or ORF3a plasmid. At 24 h after transfection, the cells were harvested for RNA extraction and RT-qPCR. Error bars represent standard errors of the results of repeated experiments. (D) JAK2 reduction in ORF3a-expressed cells is restored by MG132 treatment. HEK293T cells were transfected with EV or ORF3a plasmid. At 30 h after transfection, the cells were treated with MG132 for 6 h and then harvested for immunoblotting with antibodies against JAK2, Flag, and tubulin. Relative levels of JAK2 are shown as folds below the images after normalization with tubulin in densitometry analysis. (E) ORF3a increases JAK2 ubiquitination. The EV or ORF3a transfected cells were lysed with IP lysis buffer, followed by IP with JAK2 antibody. The input and IP products were subjected to immunoblotting with antibodies against ubiquitin (Ub), JAK2, Flag, and tubulin. (F) JAK2 half-life is shortened in the presence of ORF3a. HEK293T cells transfected with ORF3a plasmid were treated with cycloheximide (CHX) and harvested at indicated times (h) for immunoblotting. EV transfected cells were included as a control. Relative levels of JAK2 are shown as folds below the images after normalization with tubulin.
FIGURE 6
FIGURE 6
Silencing of SOCS1 diminishes ORF3a-induced JAK2 degradation. (A) Knockdown of SOCS1 lessens the elevation of JAK2 ubiquitination induced by ORF3a, while ubiquitination levels of total proteins in input were similar. Cells were cotransfected with empty vector (EV) or ORF3a plasmid along with NC or si-SOCS1. Thirty-six hours later, the cells were harvested the whole cell lysate (input) with IP lysis buffer. IP was conducted with JAK2 antibody. The input and IP products were detected by immunoblotting with Ub, JAK2, Flag, and tubulin antibodies. (B) Silencing of SOCS1 reverses ORF3a-induced JAK2 reduction. Cells were cotransfected with EV or ORF3a and NC or si-SOCS1, and at 36 h after transfection, harvested for immunoblotting. Relative levels of proteins are shown as folds below the images after normalization with tubulin.
FIGURE 7
FIGURE 7
The middle domain of ORF3a appears to be associated with the JAK2 reduction and IFN signaling inhibition. (A) Schematic illustration of full-length (FL) and truncated constructs (D1–D4) of ORF3a. The names of the fragments are indicated on the left. The numbers above the lines indicate starting and ending amino acid positions of ORF3a for the constructs. (B) Immunofluorescence assay showing expression of ORF3a deletion constructs in HEK293T cells. In each panel, the left image shows the expression of EV, ORF3a, or the deletion construct, and the right image shows the overlay with DAPI staining. (C) The levels of SOCS1 in HEK293T cells with expression of ORF3a deletion constructs. The cells were transfected with full-length ORF3a and truncation constructs. At 48 h after transfection, cells were harvested for immunoblotting with antibodies against SOCS1 and tubulin. (D,E) The effect of ORF3a deletion constructs on IFN signaling activation. At 36 h after transfection, the cells were treated with IFNα for another 0.5 or 20 h, then harvested for immunoblotting to detect STAT1-Y701 (D) or STAT2 (E) levels, respectively. (F) The levels of JAK2 in HEK293T cells with expression of ORF3a deletion constructs. Cells were treated similarly to C.

Similar articles

Cited by

References

    1. Ahmed C. M., Dabelic R., Bedoya S. K., Larkin J., III, Johnson H. M. (2015). A SOCS1/3 antagonist peptide protects mice against lethal infection with influenza A virus. Front. Immunol. 6:574. 10.3389/fimmu.2015.00574 - DOI - PMC - PubMed
    1. Ahmed C. M., Dabelic R., Martin J. P., Jager L. D., Haider S. M., Johnson H. M. (2010). Enhancement of antiviral immunity by small molecule antagonist of suppressor of cytokine signaling. J. Immunol. 185 1103–1113. 10.4049/jimmunol.0902895 - DOI - PMC - PubMed
    1. Akhtar L. N., Benveniste E. N. (2011). Viral exploitation of host SOCS protein functions. J. Virol. 85 1912–1921. 10.1128/JVI.01857-10 - DOI - PMC - PubMed
    1. Amor S., Fernandez Blanco L., Baker D. (2020). Innate immunity during SARS-CoV-2: evasion strategies and activation trigger hypoxia and vascular damage. Clin. Exp. Immunol. 202 193–209. 10.1111/cei.13523 - DOI - PMC - PubMed
    1. Blanco-Melo D., Nilsson-Payant B. E., Liu W. C., Uhl S., Hoagland D., Moller R., et al. (2020). Imbalanced host response to SARS-CoV-2 drives development of COVID-19. Cell 181 1036–1045. 10.1016/j.cell.2020.04.026 - DOI - PMC - PubMed