. 2021 Sep 28:12:676105.
doi: 10.3389/fimmu.2021.676105. eCollection 2021.

Relationship Between Inflammation and Metabolism in Patients With Newly Presenting Rheumatoid Arthritis

Affiliations

Relationship Between Inflammation and Metabolism in Patients With Newly Presenting Rheumatoid Arthritis

Gurpreet Singh Jutley et al. Front Immunol. .

Abstract

Background: Systemic inflammation in rheumatoid arthritis (RA) is associated with metabolic changes. We used nuclear magnetic resonance (NMR) spectroscopy-based metabolomics to assess the relationship between an objective measure of systemic inflammation [C-reactive protein (CRP)] and both the serum and urinary metabolome in patients with newly presenting RA.

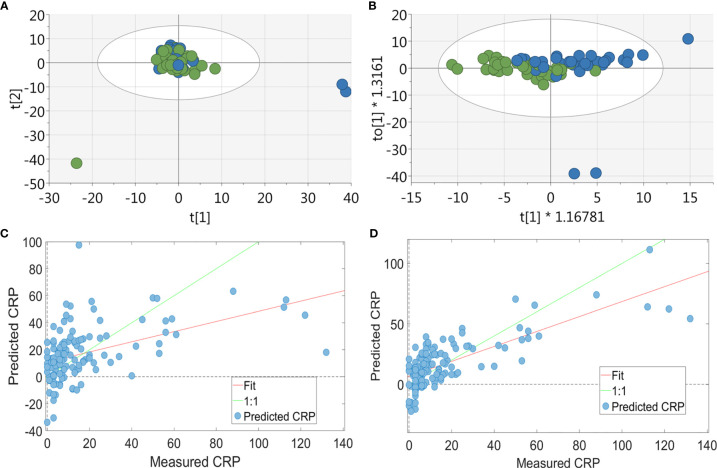
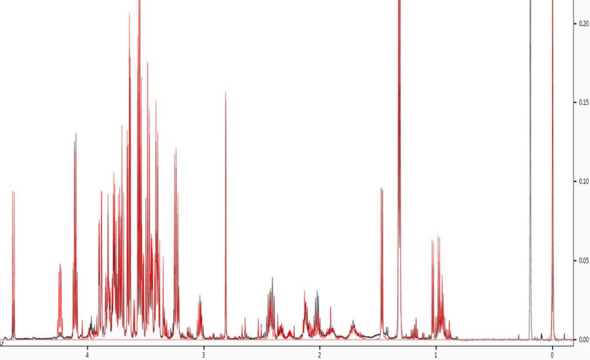
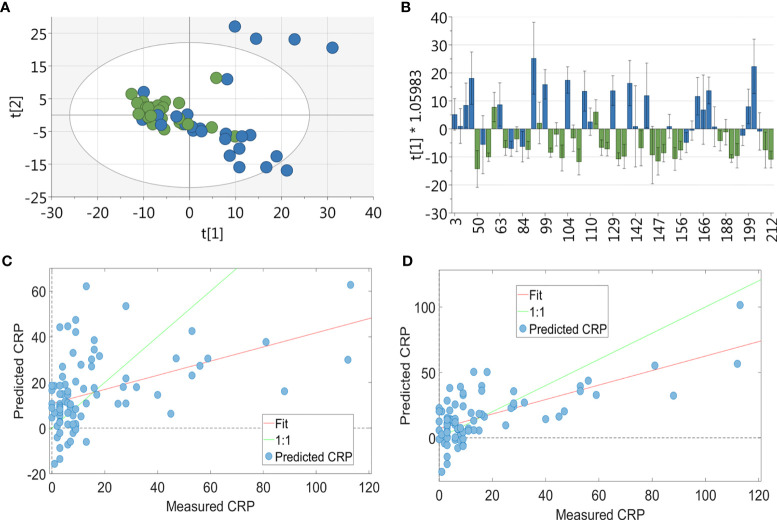
Methods: Serum (n=126) and urine (n=83) samples were collected at initial presentation from disease modifying anti-rheumatic drug naïve RA patients for metabolomic profile assessment using 1-dimensional 1H-NMR spectroscopy. Metabolomics data were analysed using partial least square regression (PLS-R) and orthogonal projections to latent structure discriminant analysis (OPLS-DA) with cross validation.

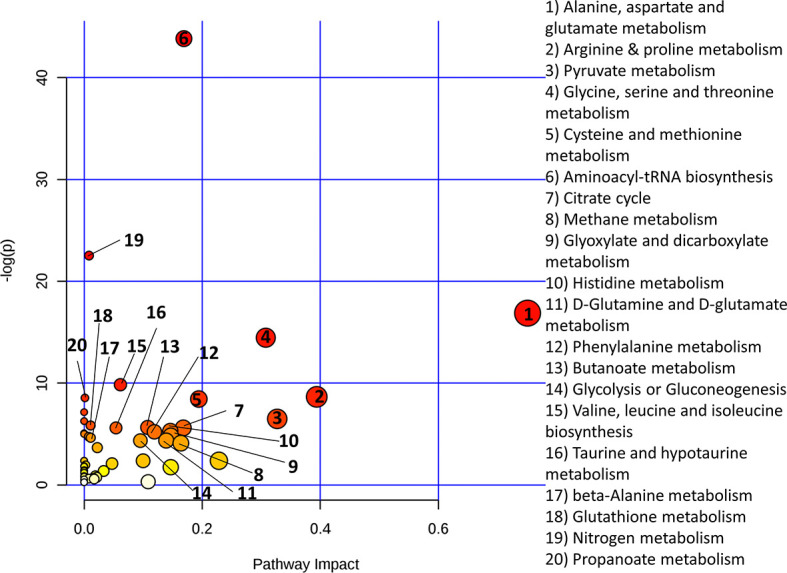
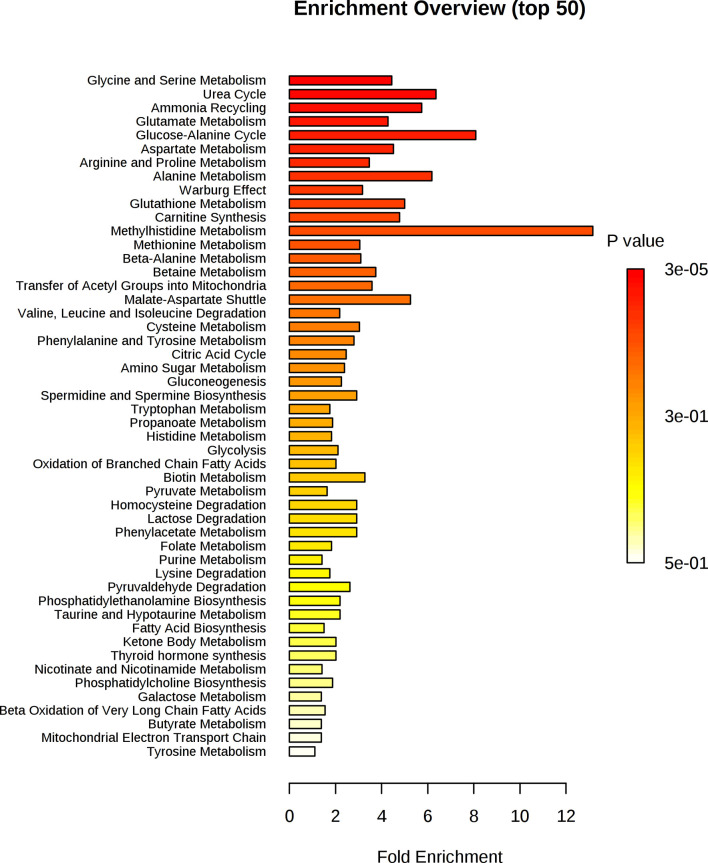
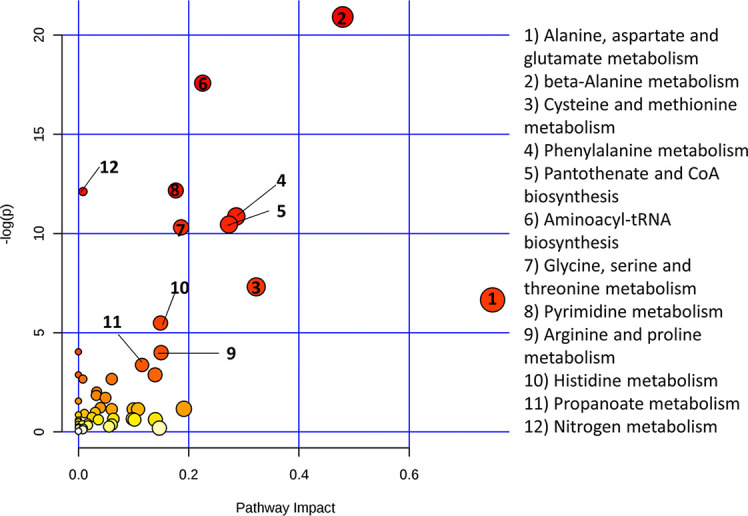
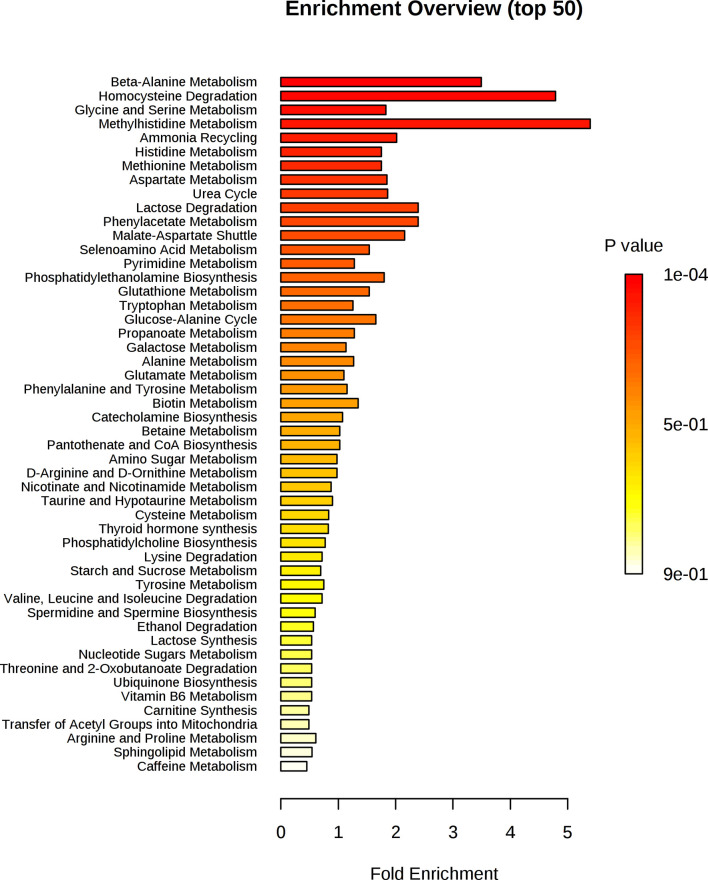
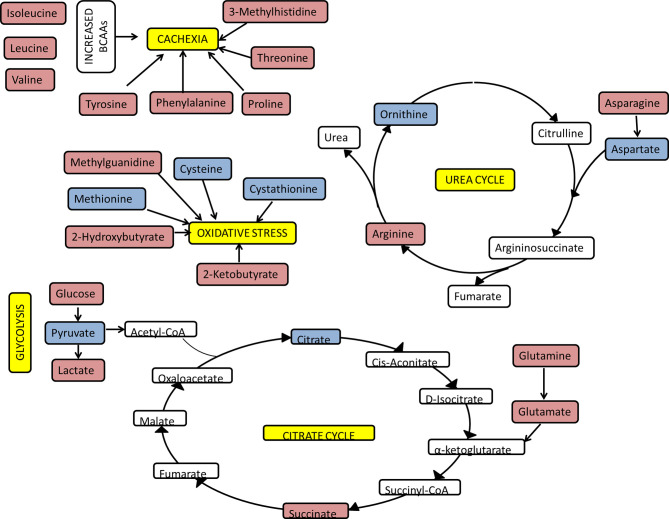
Results: Using PLS-R analysis, a relationship between the level of inflammation, as assessed by CRP, and the serum (p=0.001) and urinary (p<0.001) metabolome was detectable. Likewise, following categorisation of CRP into tertiles, patients in the lowest CRP tertile and the highest CRP tertile were statistically discriminated using OPLS-DA analysis of both serum (p=0.033) and urinary (p<0.001) metabolome. The most highly weighted metabolites for these models included glucose, amino acids, lactate, and citrate. These findings suggest increased glycolysis, perturbation in the citrate cycle, oxidative stress, protein catabolism and increased urea cycle activity are key characteristics of newly presenting RA patients with elevated CRP.

Conclusions: This study consolidates our understanding of a previously identified relationship between serum metabolite profile and inflammation and provides novel evidence that there is a relationship between urinary metabolite profile and inflammation as measured by CRP. Identification of these metabolic perturbations provides insights into the pathogenesis of RA and may help in the identification of therapeutic targets.

Keywords: cachexia; citrate cycle; glycolysis; inflammation; metabolism; oxidative stress; rheumatoid arthritis; urea cycle.


Conflict of interest statement

The authors declare that the research was conducted in the absence of any commercial or financial relationships that could be construed as a potential conflict of interest.

Figures

Figure 1
Figure 1
Multivariate analysis of RA patients’ serum metabolite profile. For the PCA & OPLSDA, patients were split into tertiles according to CRP values, with data shown for the highest and lowest tertile: (A) PCA plot of metabolic data derived from RA patients’ (n = 84) sera (green = CRP <5 and blue = CRP>13; 19 PC, r2 = 0.673) showing no separation between the two groups. (B) OPLS-DA plot of metabolic data derived from RA patients’ (n = 84) sera (green = CRP <5 and blue = CRP>13; 1 + 1+0 LV, p value= 0.033) showing a strong separation between the two groups. PLS-R analysis showed a relationship between serum metabolite profile and CRP. Using the full 590 serum metabolite binned data (n = 126) (C) there was a correlation between metabolite data and CRP on PLS-R analysis (r2 = 0.29, 7 LV, p < 0.001). Using forward selection, 36 bins were identified which correlated with inflammation and a subsequent PLS-R analysis using these bins (D) showed a stronger correlation between serum metabolite profile and CRP (r2 = 0.551, 6 LV, p = 0.001).
Figure 2
Figure 2
Spectral fitting to identify metabolites. NMR spectra were annotated using Chenomx NMR suite (Chenomx, professional version 8.5).
Figure 3
Figure 3
Metaboanalyst pathway analysis of potential biomarkers implicated by PLS-R analysis of CRP and patients’ serum metabolites.
Figure 4
Figure 4
Enrichment analysis of key metabolites in serum implicated as potential biomarkers by the PLS-R analysis of CRP and patients’ serum metabolites.
Figure 5
Figure 5
Multivariate analysis of RA patients’ urinary metabolite profile. For the PCA & OPLSDA, patients were split into tertiles according to CRP values, with data shown for the highest and lowest tertile (n = 54): (A) PCA plot of metabolic data derived from RA patients’ urine (green = CRP <5 and blue = CRP>11; 19 PC, r2 = 0.673) showing no separation between the two groups. (B) OPLS-DA plot of urinary metabolic data (n = 83, green = CRP <5 and blue = CRP>11; 1 + 0+0 LV, p value < 0.001) showing a strong separation between the two groups. PLS-R analysis showing the relationship between urinary metabolites and CRP. Using the full 900 NMR urinary metabolite bins for RA patients (n = 83) (C) there was a correlation between metabolite profile and CRP (r2 = 0.095, 1 LV, p = 0.008). Using forward selection, 144 bins were identified which most strongly correlated with CRP and a subsequent PLS-R using these bins (D) showed a correlation between urinary metabolite profile and CRP (r2 = 0.429, 3 LV, p < 0.001).
Figure 6
Figure 6
Metaboanalyst pathway analysis of potential biomarkers implicated by PLS-R analysis of CRP and patients’ urinary metabolites.
Figure 7
Figure 7
Enrichment analysis of key metabolites in urine implicated as potential biomarkers by the PLS-R analysis of CRP and RA patients’ urinary metabolites.
Figure 8
Figure 8
Overview of key pathways and metabolites correlating with CRP. The functional analysis of PLS-R analysis of the serum and urinary metabolome of newly presenting RA patients as assessed by 1H NMR spectroscopy. Red metabolites had a positive correlation with CRP and blue metabolites had a negative correlation with CRP.

Similar articles

Cited by

References

    1. Raza K. Early Rheumatoid Arthritis Is Characterised by a Distinct and Transient Synovial Fluid Cytokine Profile of T Cell and Stromal Cell Origin. Arthritis Res Ther (2019) 21(1):226. doi: 10.1186/s13075-019-2026-4 - DOI - PMC - PubMed
    1. Cush JJ. Early Rheumatoid Arthritis – Is There a Window of Opportunity? J Rheumatol Suppl (2007) 80:1–7. - PubMed
    1. Grigor C, Capell H, Stirling A, McMahon AD, Lock P, Vallance R, et al. . Effect of a Treatment Strategy of Tight Control for Rheumatoid Arthritis (the TICORA Study): A Single-Blind Randomised Controlled Trial. Lancet (London England) (2004) 364(9430):263–9. doi: 10.1016/S0140-6736(04)16676-2 - DOI - PubMed
    1. van der Kooij SM, de Vries-Bouwstra JK, Goekoop-Ruiterman YP, Ewals JA, Han KH, Hazes JM, et al. . Patient-Reported Outcomes in a Randomized Trial Comparing Four Different Treatment Strategies in Recent-Onset Rheumatoid Arthritis. Arthritis Rheum (2009) 61(1):4–12. doi: 10.1002/art.24367 - DOI - PubMed
    1. Burgers LE, Raza K, van der H, van Mil AH. Window of Opportunity in Rheumatoid Arthritis – Definitions and Supporting Evidence: From Old to New Perspectives. RMD Open (2019) 5(1):e000870. doi: 10.1136/rmdopen-2018-000870 - DOI - PMC - PubMed

Publication types

Substances