. 2021 Sep 15;13(9):10014-10037.
eCollection 2021.

ZLN005 protects against ischemia-reperfusion-induced kidney injury by mitigating oxidative stress through the restoration of mitochondrial fatty acid oxidation

Affiliations

ZLN005 protects against ischemia-reperfusion-induced kidney injury by mitigating oxidative stress through the restoration of mitochondrial fatty acid oxidation

Zhiyu Wang et al. Am J Transl Res. .

Abstract

To date, the treatment of acute kidney injury (AKI) remains a difficult problem for clinicians. In the present study, we assessed whether ZLN005, a novel peroxisome proliferator-activated receptor-γ coactivator-1α (PGC-1α) agonist, can protect against ischemic AKI in vivo and in vitro. Notably, ZLN005 treatment significantly alleviated Ischemia-reperfusion (I/R)-induced tubular injury and reversed the decrease in hypoxia-reoxygenation-induced cell viability by restoring PGC-1α expression in a dose-dependent manner. This beneficial effect of ZLN005 was associated with the preservation of mitochondrial fatty acid oxidation (MitoFAO) and the alleviation of oxidative stress. Cotreatment with etomoxir, a specific inhibitor of carnitine palmitoyltransferase-1α (CPT-1α) activity, or CPT-1α siRNA abrogated ZLN005-induced antistress responses by mitigating reactive oxygen species production and decreasing apoptosis under ischemia-hypoxia conditions by suppressing MitoFAO. Further studies revealed that activation of endoplasmic reticulum (ER) stress may be involved in the effect of CPT-1α inhibition observed in vivo and in vitro. Collectively, our results suggest that ZLN005 confers a protective effect on I/R-induced kidney injury by mitigating ER stress through the restoration of MitoFAO by targeting PGC-1α.

Keywords: Acute kidney injury; ZLN005; apoptosis; carnitine palmitoyl transferase-1α; oxidative stress; peroxisome proliferator-activated receptor-γ coactivator-1α.


Conflict of interest statement

None.

Figures

Figure 1
Figure 1
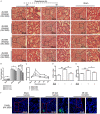
I/R induced kidney injury. A. Timeline scheme showing the procedures for I/R. Mice were subjected to 30 minutes of bilateral renal pedicles clamping followed by reperfusion for different periods of time (0, 2, 6, 12, 16, 24 or 48 h). Mice that received the same treatment without renal pedicle clamping were used as controls. B. Representative renal H&E staining images under an optical microscope (magnification of the upper panel, 200×; scale bar, 100 μm; the lower panel shows magnified images of the boxed areas in the upper panel). Yellow arrows, suspected lipid droplets. C. Summarized SCr levels. D. Summarized tubular damage scores. E. Representative TEM images (magnification of the left panel, 7000×; scale bar, 4 μm; the right panel shows magnified images of the boxed areas in the left panel left panel) of kidney tissues in the mice with or without I/R (24 or 48 h). White arrows, lipid droplets. n=6.
Figure 2
Figure 2
Changes in PGC-1α and CPT-1α in the renal cortex during I/R-induced kidney injury. (A) Representative Western blot images and (B) summarized data showing the time-dependent effect of reperfusion on PGC-1α protein levels. (C) Representative IHC staining image showing PGC-1α protein localization (magnification under an optical microscope, 200×; scale bar, 100 μm). (D) Summarized qRT-PCR data of PGC-1α mRNA expression in the renal cortex. (E) Representative Western blot images and (F) summarized data showing the time-dependent effect of reperfusion on CPT-1α protein expression. (G) Representative IHC staining image showing CPT-1α protein localization (magnification under an optical microscope, 200×; scale bar, 100 μm). (H) Summarized qRT-PCR data of CPT-1α mRNA expression in the renal cortex. n=6. *P<0.05, **P<0.01, ***P<0.001 vs. the control for PGC-1α and CPT-1α. #P<0.05, ###P<0.001 vs. the I/R 24 h group.
Figure 3
Figure 3
ZLN005 upregulated PGC-1α and CPT-1α expression in a dose-dependent manner. (A) Representative Western blot images and (B, D) summarized data showing the dose-dependent effect of ZLN005 (0, 3, 6, 12 mg/kg) treatment on PGC-1α and CPT-1α protein expression. (C) Summarized data of PGC-1α mRNA expression in the renal cortex of mice intraperitoneally administered 0, 3, 6 or 12 mg/kg ZLN005. (E) Summarized data of CPT-1α mRNA expression in the renal cortex of mice intraperitoneally administered 0, 3, 6 or 12 mg/kg ZLN005. n=4-6. *P<0.05, **P<0.01, ***P<0.001 vs. the control injected with corn oil.
Figure 4
Figure 4
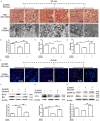
ZLN005 improves renal tubular injury and decreases oxidative stress and apoptosis in I/R-injured kidneys. (A) Representative renal H&E staining images under an optical microscope (magnification of the left panel, 200×; scale bar, 100 μm; the right panel shows magnified images of the boxed areas in the left panel) showing the dose-dependent effect of ZLN005 treatment (0, 3, 6, 12 mg/kg) on I/R induced renal tubular injury. (B) Summarized tubular damage scores. (C) Summarized SCr levels. (D) Summarized levels of H2O2 and (E) MDA extracted from the mouse renal cortex. (F) Representative images of cell apoptosis detected by TUNEL assay under a fluorescence microscope (magnification of the left panel, 200×; scale bar, 100 μm; the right panel shows magnified images of the boxed areas in the left panel). n=4-6. #P<0.05, ##P<0.01, ###P<0.001.
Figure 5
Figure 5
Inhibition of CPT-1α negates ZLN005-mediated changes in oxidative stress and apoptosis in I/R-injured kidneys. (A) Representative renal H&E staining images under an optical microscope (magnification of the left panel, 200×; scale bar, 100 μm; the right panel shows magnified images of the boxed areas in the left panel) and representative TEM images (magnification of the left panel, 15000×; scale bar, 2 μm; the right panel shows magnified images of the boxed areas in the left panel left panel) of kidney tissues in the I/R 24 h groups treated with ZLN005, ZLN005+etomoxir or neither. White arrows show lipid droplets. (B) Summarized tubular damage scores. (C) Summarized levels of H2O2 and (D) MDA extracted from the mouse renal cortex. (E) Representative images of cell apoptosis detected by TUNEL assays under a fluorescence microscope (magnification of the left panel, 200×; scale bar, 100 μm; the right panel shows magnified images of the boxed areas in the left panel). (F) Representative Western blot images and summarized data showing Bcl-2 and Bax expression and the ratio of Bcl-2 to Bax. (G) Representative Western blot images and summarized data showing CC3 expression. (H) Representative Western blot images and summarized data showing p-Erk1/2 levels. n=4-6. #P<0.05, ##P<0.01, ###P<0.001.
Figure 6
Figure 6
Changes in PGC-1α and CPT-1α expression in HK2 cells during H/R. (A) Representative Western blot images and (B) summarized data showing the time-dependent effect of H/R on PGC-1α protein expression. (C) Summarized qRT-PCR data of PGC-1α mRNA expression in H/R-stimulated HK2 cells. (D) Representative Western blot images and (E) summarized data showing the time-dependent effect of H/R on CPT-1α protein expression. (F) Summarized qRT-PCR data of CPT-1α mRNA expression in H/R-stimulated HK2 cells. (G) Summarized OCR data of HK2 cells in the control and H/R 24 h groups. (H) Representative images of lipid droplets detected with Lipi-Red in HK2 cells cultured under normoxia or H/R for 24 h (magnification under a confocal microscope, 630×2.5; scale bar, 10 μm). n=8-9. *P<0.05, **P<0.01, ***P<0.001 vs. the control for PGC-1α and CPT-1α. #P<0.05, ##P<0.01, ###P<0.001 vs. the H/R 24 h group.
Figure 7
Figure 7
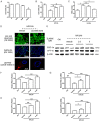
Effects of ZLN005 treatment on H/R-induced HK2 cell injury. (A) Summarized data of the viability of HK2 cells treated with 0, 5, 10 or 20 μM ZLN005 under normoxia to identify safe treatment concentrations. (B) Summarized data of the viability of HK2 cells cultured under normoxia or treated with 0, 2.5, or 5 μM ZLN005 under H/R conditions for 24 h. (C) Summary of MDA levels in HK2 cells cultured under normoxia or treated with 0, 2.5, or 5 μM ZLN005 under H/R for 24 h. (D) Representative images used to assess cell viability detected with a Live/Dead Cell Kit (magnification under fluorescence microscope, 200×; scale bar, 100 μm), ROS production detected by DAFH-DA (magnification under fluorescence microscope, 200×; scale bar, 100 μm) and lipid droplets detected by Lipi-Red (magnification under confocal microscope, 630×2.5; scale bar, 10 μm) of HK2 cells treated with or without 5 μM ZLN005 under H/R for 24 h. (E) Representative Western blot images and (F) summarized data showing the dose-dependent effect of ZLN005 on the H/R-induced decrease in PGC-1α protein expression. (G) Summarized data of relative PGC-1α mRNA levels in HK2 cells cultured under normoxia or treated with 0, 2.5, or 5 μM ZLN005 under H/R for 24 h. (H) Summarized data of CPT-1α protein levels in HK2 cells cultured under normoxia or treated with 0, 2.5, or 5 μM ZLN005 under H/R conditions for 24 h. (I) Summarized data of the relative CPT-1α mRNA levels in HK2 cells cultured under normoxia or treated with 0, 2.5, or 5 μM ZLN005 under H/R for 24 h. n=8-9, NSP≥0.05, #P<0.05, ##P<0.01, ###P<0.001.
Figure 8
Figure 8
Inhibition of CPT-1α decreases the ZLN005-mediated benefits on oxidative stress in H/R-injured HK2 cells. (A) Levels of OCR in H/R-injured HK2 cells treated with ZLN005 with or without CPT-1α inhibition. (B) Representative Western blot images and (C) summarized data showing CPT-1α protein levels in HK2 cells treated with CPT-1α siRNA. (D) Summarized data of the viability of H/R-injured HK2 cells treated with ZLN005 with or without CPT-1α inhibition. (E) Summarized MDA levels in H/R-injured HK2 cells treated with ZLN005 with or without CPT-1α inhibition. (F) Representative images used to assess ROS production detected by DAFH-DA (magnification under a fluorescence microscope, 200×; scale bar, 100 μm), mitochondrial membrane potential detected by MitoTracker Red CMXRos (magnification under a fluorescence microscope, 200×; scale bar, 100 μm) and lipid droplets detected by Lipi Red (magnification under a confocal microscope, 630×2.5; scale bar, 10 μm) in H/R-injured HK2 cells treated with ZLN005 with or without CPT-1α inhibition. n=8-9, NSP≥0.05, #P<0.05, ##P<0.01, ###P<0.001.
Figure 9
Figure 9
Inhibition of CPT-1α decreases the ZLN005-mediated benefits on apoptosis by activating ER stress in H/R-injured HK2 cells. (A) Representative Western blot images and (B-D) summarized data showing PGC-1α, Bcl-2, Bax and CC3 expression in HK2 cells with or without ZLN005 treatment and/or CPT-1α inhibition under H/R conditions for 24 h. (E) Representative Western blot images and (F) summarized data showing p-Erk1/2 levels in HK2 cells with or without ZLN005 treatment and/or CPT-1α inhibition under H/R conditions for 24 h. n=8-9, NSP≥0.05, #P<0.05, ##P<0.01, ###P<0.001.
Figure 10
Figure 10
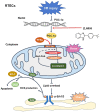
Diagram showing PGC-1α agonist ZLN005 restores MitoFAO to attenuate I/R-induced kidney injury by inhibiting oxidative stress and apoptosis.

Similar articles

Cited by

References

    1. Zuk A, Bonventre JV. Acute kidney injury. Annu Rev Med. 2016;67:293–307. - PMC - PubMed
    1. Bellomo R, Kellum JA, Ronco C. Acute kidney injury. Lancet. 2012;380:756–766. - PubMed
    1. Mayeux PR, MacMillan-Crow LA. Pharmacological targets in the renal peritubular microenvironment: implications for therapy for sepsis-induced acute kidney injury. Pharmacol Ther. 2012;134:139–155. - PMC - PubMed
    1. Liao W, Fu Z, Zou Y, Wen D, Ma H, Zhou F, Chen Y, Zhang M, Zhang W. MicroRNA-140-5p attenuated oxidative stress in cisplatin induced acute kidney injury by activating Nrf2/ARE pathway through a Keap1-independent mechanism. Exp Cell Res. 2017;360:292–302. - PubMed
    1. Gorin Y. The kidney: an organ in the front line of oxidative stress-associated pathologies. Antioxid Redox Signal. 2016;25:639–641. - PMC - PubMed

LinkOut - more resources