. 2021 Sep 15;13(9):10155-10162.
eCollection 2021.

The correlation of the miR-29a/MMP9 axis with Helicobacter pylori infection in gastric cancer

Affiliations

The correlation of the miR-29a/MMP9 axis with Helicobacter pylori infection in gastric cancer

Lunqin Liu et al. Am J Transl Res. .

Abstract

Objective: This study was designed to investigate the association between the miR-29a/MMP9 axis expression levels and Helicobacter pylori (HP) infection in gastric cancer patients.

Methods: A total of 100 gastric cancer patients referred to our hospital from June 2017 to June 2019 were recruited as the study cohort. Among them, 50 HP-positive patients were included in the experimental group and 50 HP-negative patients were included in the control group. The changes in the patients' conditions were compared, the miR-29a/MMP9 axis expression levels were recorded, and the correlation between the miR-29a/MMP9 axis and the HP infections was analyzed. All the discharged patients were followed up for one year to analyze the correlation between the HP infections and the serum miR-29a and MMP9 expression levels with the disease progression.

Results: The experimental group had higher miR-29a expression levels and higher MMP9 chromogenic scores than the control group (P<0.05). A negative correlation was found between the miR-29 expression level and the MMP9 expression level (r=-5.369, P<0.05). One year after discharge, there were 27 patients with severe disease in the experimental group and 6 in the control group, with a significant difference between the two groups. Moreover, the expression levels of the miR-29a/MMP9 axis were significantly higher in the discharged patients than in the patients with severe disease (P<0.05). A receiver operating characteristic (ROC) curve was used to analyze the predictive value of miR-29/MMP9 in the diagnosis of gastric cancer, and the area under the curve was found to be 0.97.

Conclusion: The miR-29a/MMP9 axis levels were increased in the HP positive patients but not in the HP negative patients. HP infection is considered to be closely related to gastric cancer cell spread, disease relapse, and high miR-29a/MMP9 axis expression levels.

Keywords: Helicobacter pylori; gastric cancer; miR-29a/MMP9 axis.


Conflict of interest statement

None.

Figures

Figure 1
Figure 1
Comparison of the miR-29a expression levels. Notes: The abscissa indicates before the surgeries and after the surgeries from left to right, and the ordinate indicates the patients’ serum miR-29a expression levels. The preoperative miR-29a expression levels in the experimental group were significantly higher than they were in the control group (7.01±1.97 vs 3.56±1.21; t=10.55). ***P<0.001. The postoperative miR-29a expression levels in the experimental group were significantly higher than they were was in the control group (5.21±1.63 vs 3.03±1.66; t=6.63); ***P<0.001. In the experimen- tal group, the preoperative miR-29a expression le- vels were significantly higher than the postoperative levels (7.01±1.97 vs 5.21±1.63; t=4.98); ***P<0.001.
Figure 2
Figure 2
A comparison of the miR-29a expression levels in the MMP-positive and MMP-negative patients. Note: ***P<0.001.
Figure 3
Figure 3
The correlation between the miR-29 and the MMP9 expression levels.
Figure 4
Figure 4
A comparison of the MMP9 expression levels. Note: The abscissa represents the score range of the MMP9 expression levels before and after the tumor resections, and the ordinate represents the number of patients. The number of patients with preoperative low MMP9 expressions in the experimental group was significantly less than the number in the control group (10 vs 43, X2=43.71); ***P<0.001; The number of patients with preoperative high MMP9 expressions in the experimental group was significantly greater than the number in the control group (40 vs 7, X2=43.71); ***P<0.001; The number of patients with postoperative low MMP9 expressions in the experimental group was significantly less than the number in the control group (25 vs 44, X2=16.88); ***P<0.001; The number of patients with postoperative high MMP9 expression in the experimental group was significantly greater than that in the control group; 25 vs 6, X2=16.88); ***P<0.001; In the experimental group, the number of patients with low MMP9 expression before surgery was significantly less than that after surgery (10 vs 25, X2=9.89), *P=0.002. In the experimental group, the number of patients with high MMP9 expressions before surgery was significantly greater than the number after surgery (40 vs 25, X2=9.89); *P=0.002.
Figure 5
Figure 5
Comparison of the cancer cell spread and metastasis and the disease recurrence. Note: The abscissa indicates the disease progression of patients during follow-up, which was specifically classified as cancer cell spread, cancer cell metastasis, and gastric cancer recurrence from left to right, and the ordinate indicates the number of patients. The number of patients with cancer cell spread in the experimental group was significantly less than the number in the control group (11 vs 3, X2=5.32), *P=0.021; The number of patients with cancer cell metastasis in the experimental group was significantly less than the number in the control group (8 vs 1, X2=5.98), *P=0.014. The number of patients with gastric cancer recurrence in the experimental group was significantly less than the number in the control group (8 vs 2, X2=5.83), *P=0.016. Additionally, it was found that all the patients with disease recurrence developed HP infections, and their expression levels of miR-29a and MMP9 were remarkably higher than those at discharge 1 year earlier. P values <0.05 were considered statistically significant.
Figure 6
Figure 6
Symptom-free survival times of the two groups. Note: The symptom-free survival times we- re (17.35±3.57) months in the control group and (14.57±3.18) months in the experimental group. ***P<0.001.
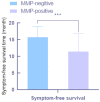
Figure 7
Figure 7
The symptom-free survival times of the MMP-negative and MMP-positive patients. Note: The symptom-free survival times of the MMP-negative patients were 15.75±3.25 m, and the symptom-free survival times of the MMP-positive patients were 11.48±5.32 m. ***P<0.001.
Figure 8
Figure 8
An ROC curve analysis of miR-29/MMP9 in predicting gastric cancer.

References

    1. Yang J, Liu Z, Zeng B, Hu G, Gan R. Epstein-Barr virus-associated gastric cancer: a distinct subtype. Cancer Lett. 2020;495:191–199. - PubMed
    1. Yan Y, Fang L, Li Y, Yu Y, Li Y, Cheng JC, Sun YP. Association of MMP2 and MMP9 gene polymorphisms with the recurrent spontaneous abortion: a meta-analysis. Gene. 2021;767:145173. - PubMed
    1. Liu Y, Xu XY, Shen Y, Ye CF, Hu N, Yao Q, Lv XZ, Long SL, Ren C, Lang YY, Liu YL. Ghrelin protects against obesity-induced myocardial injury by regulating the lncRNA H19/miR-29a/IGF-1 signalling axis. Exp Mol Pathol. 2020;114:104405. - PubMed
    1. Czerw A, Religioni U, Banaś T. Perception of cancer in patients diagnosed with the most common gastrointestinal cancers. BMC Palliat Care. 2020;19:144. - PMC - PubMed
    1. Xu G, Wei J, Huangfu B, Gao J, Wang X, Xiao L, Xuan R, Chen Z, Song G. Animal model and bioinformatics analyses suggest the TIMP1/MMP9 axis as a potential biomarker in oral squamous cell carcinoma. Mol Carcinog. 2020;59:1302–1316. - PubMed

LinkOut - more resources