

Promotion of chemerin in rat diabetic kidney disease through enhancement of TGF-β1/Smads/CTGF pathway
- PMID: 34650691
- PMCID: PMC8507004
Promotion of chemerin in rat diabetic kidney disease through enhancement of TGF-β1/Smads/CTGF pathway
Abstract
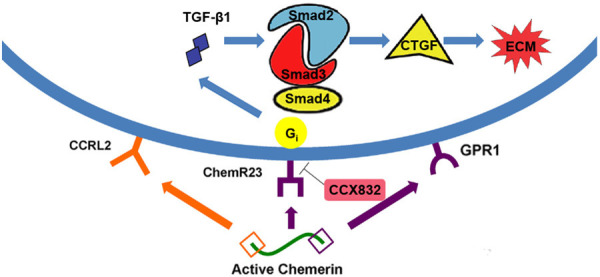
Objective: Although increasing evidence shows that the adipokine chemerin is involved in diabetic kidney disease (DKD), it is still unclear whether the chemerin acts as a critical element in renal function through the signaling pathways of transforming growth factor β1/Smads/connective tissue growth factor (TGF-β1/Smads/CTGF) in the context of DKD. Therefore, we sought to determine the role of chemerin and TGF-β1/Smads/CTGF signaling pathway in the development and/or progression of DKD.
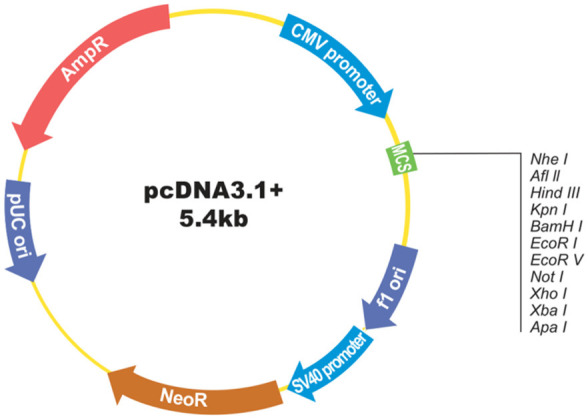
Methods: We used rat renal mesangial cells (RMCs) and a DKD rat model as study subjects. RMCs and rats were randomly separated into different groups and transfected with the constructed chemerin expression vector pcDNA™ 3.1 (+)-chemerin. Rat renal function and inflammatory cytokines were assessed after treatment with chemerin or CCX832 (ChemR23 antagonist). Real time polymerase chain reverse transcription (RT-QPCR) was used to detect the mRNA expressions of TGF-β1, Smad2, Smad4, and CTGF. Western blot was performed to determine protein expression for semiquantitative analysis.
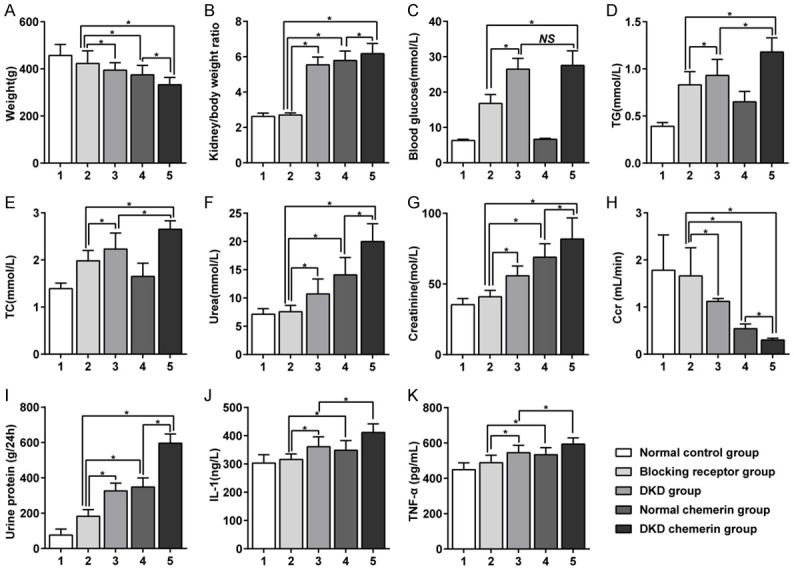
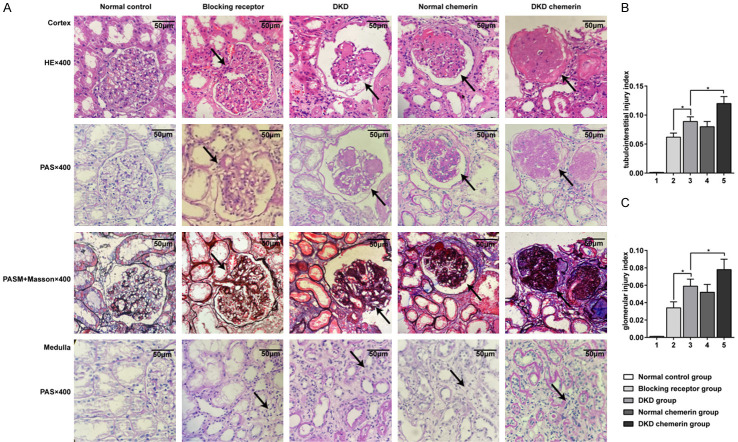
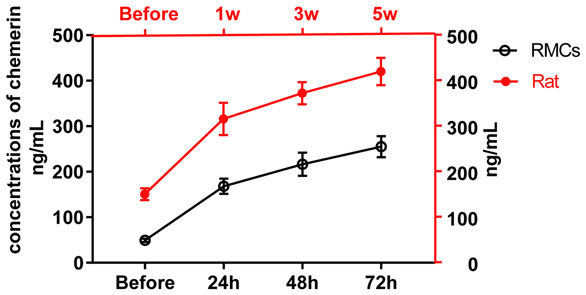
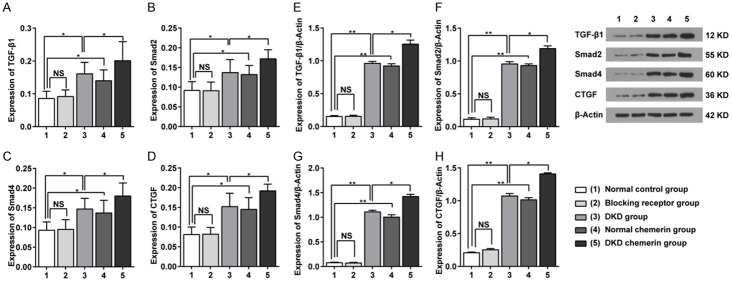
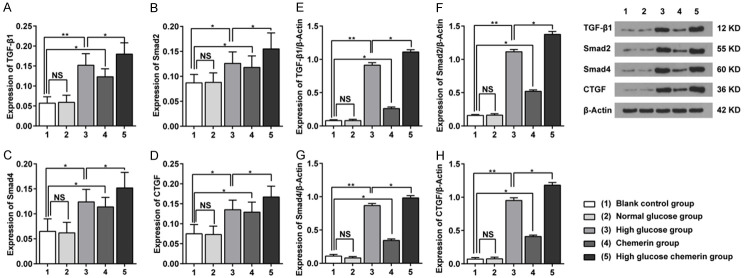
Results: In in vitro studies, the mRNA and protein levels of TGF-β1, Smad2, Smad4, and CTGF were significantly increased in the groups of high glucose and chemerin as compared to the normal control and normal glucose groups, most notably in the high glucose chemerin group (all P<0.05). In vivo studies revealed that the mRNA and protein levels of TGF-β1, Smad2, Smad4, and CTGF were higher in the DKD group and the normal chemerin group than in the normal control group and the blocking receptor group, while appearing the highest in the DKD chemerin group (all P<0.05). Moreover, kidney/body weight ratio, urea, creatinine, and urine protein were increased, and the weight and endogenous creatinine clearance rate decreased in the DKD group and the normal chemerin group (all P<0.05). These changes were more pronounced in the DKD chemerin group. At the same time, blood glucose, triglycerides (TGs), and total cholesterol (TC) in the blocked receptor group was lower than those in the DKD group and the DKD chemerin group (all P<0.05). In contrast to those in the normal control group and blocked receptor group, tumor necrosis factor alpha (TNF-α) and interleukin (IL)-1 showed higher concentrations in the DKD group and the normal chemerin group. This result was more pronounced in the DKD chemerin group (all P<0.05).
Conclusion: Chemerin may play a role in DKD by enhancing the signaling pathways of TGF-β1/Smads/CTGF transduction either in vitro or in vivo. Moreover, high glucose accelerates kidney injury by activating fibrotic pathways.
Keywords: Diabetic kidney disease; chemerin; connective tissue growth factor; transforming growth factor β1/Smads.
AJTR Copyright © 2021.
Conflict of interest statement
None.
Figures
Similar articles
-
Influence of glucose and inflammatory cytokines on TGF-beta1 and CTGF mRNA expressions in human peritoneal mesothelial cells.Int J Mol Med. 2005 Jun;15(6):907-11. Int J Mol Med. 2005. PMID: 15870892
-
Osthole ameliorates early diabetic kidney damage by suppressing oxidative stress, inflammation and inhibiting TGF-β1/Smads signaling pathway.Int Immunopharmacol. 2024 May 30;133:112131. doi: 10.1016/j.intimp.2024.112131. Epub 2024 Apr 25. Int Immunopharmacol. 2024. PMID: 38669945
-
Metformin regulates inflammation and fibrosis in diabetic kidney disease through TNC/TLR4/NF-κB/miR-155-5p inflammatory loop.World J Diabetes. 2021 Jan 15;12(1):19-46. doi: 10.4239/wjd.v12.i1.19. World J Diabetes. 2021. PMID: 33520106 Free PMC article.
-
Transforming Growth Factor-Beta1 in Diabetic Kidney Disease.Front Cell Dev Biol. 2020 Mar 24;8:187. doi: 10.3389/fcell.2020.00187. eCollection 2020. Front Cell Dev Biol. 2020. PMID: 32266267 Free PMC article. Review.
-
Preclinical Evidence of Mulberry Leaf Polysaccharides on Diabetic Kidney Disease: a Systematic Review and Meta-Analysis.Planta Med. 2024 Dec;90(15):1100-1114. doi: 10.1055/a-2432-2732. Epub 2024 Oct 2. Planta Med. 2024. PMID: 39357843 Free PMC article.
Cited by
-
The Importance of M1-and M2-Polarized Macrophages in Glioma and as Potential Treatment Targets.Brain Sci. 2023 Aug 31;13(9):1269. doi: 10.3390/brainsci13091269. Brain Sci. 2023. PMID: 37759870 Free PMC article. Review.
-
Recent Advances in the Emerging Therapeutic Strategies for Diabetic Kidney Diseases.Int J Mol Sci. 2022 Sep 17;23(18):10882. doi: 10.3390/ijms231810882. Int J Mol Sci. 2022. PMID: 36142794 Free PMC article. Review.
-
Biological properties and diverse cytokine profiles followed by in vitro and in vivo infections with LSDV strain isolated in first outbreaks in Vietnam.Vet Res Commun. 2023 Dec;47(4):2005-2016. doi: 10.1007/s11259-023-10158-2. Epub 2023 Jun 29. Vet Res Commun. 2023. PMID: 37382734
-
Neuroprotective effect of Withania somnifera leaves extract nanoemulsion against penconazole-induced neurotoxicity in albino rats via modulating TGF-β1/Smad2 signaling pathway.Inflammopharmacology. 2024 Jun;32(3):1903-1928. doi: 10.1007/s10787-024-01461-8. Epub 2024 Apr 17. Inflammopharmacology. 2024. PMID: 38630361 Free PMC article.
References
-
- Tung CW, Hsu YC, Shih YH, Chang PJ, Lin CL. Glomerular mesangial cell and podocyte injuries in diabetic nephropathy. Nephrology (Carlton) 2018;23(Suppl 4):32–37. - PubMed
-
- Pugliese G, Penno G, Natali A, Barutta F, Di Paolo S, Reboldi G, Gesualdo L, De Nicola L. Diabetic kidney disease: new clinical and therapeutic issues. Joint position statement of the Italian Diabetes Society and the Italian Society of Nephrology on “The natural history of diabetic kidney disease and treatment of hyperglycemia in patients with type 2 diabetes and impaired renal function”. Nutr Metab Cardiovasc Dis. 2019;29:1127–1150. - PubMed
LinkOut - more resources
Full Text Sources
Miscellaneous