

Identification of Key Genes Related to CD8+ T-Cell Infiltration as Prognostic Biomarkers for Lung Adenocarcinoma
- PMID: 34650911
- PMCID: PMC8505972
- DOI: 10.3389/fonc.2021.693353
Identification of Key Genes Related to CD8+ T-Cell Infiltration as Prognostic Biomarkers for Lung Adenocarcinoma
Abstract
Background: CD8+ T cells are one of the central effector cells in the immune microenvironment. CD8+ T cells play a vital role in the development and progression of lung adenocarcinoma (LUAD). This study aimed to explore the key genes related to CD8+ T-cell infiltration in LUAD and to develop a novel prognosis model based on these genes.
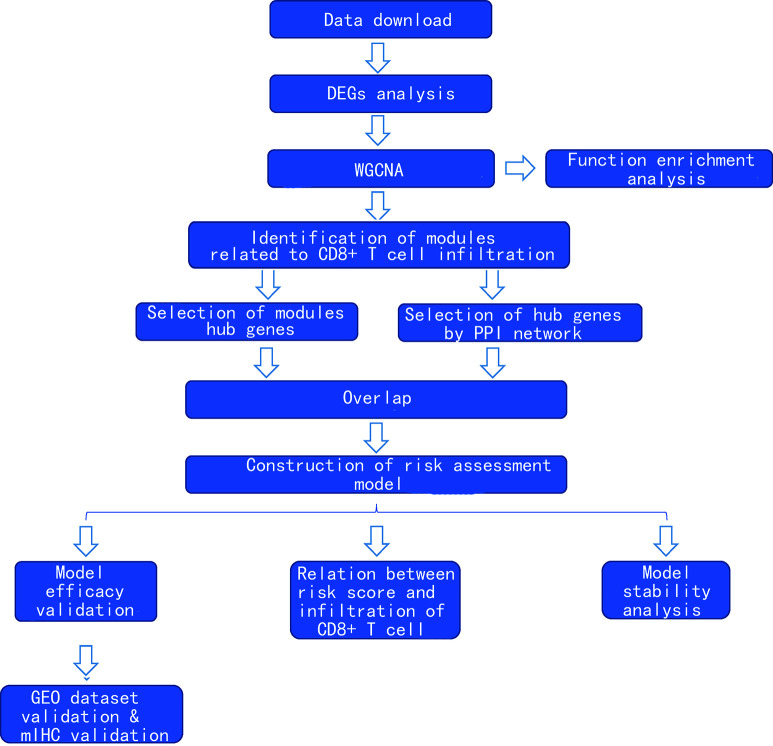
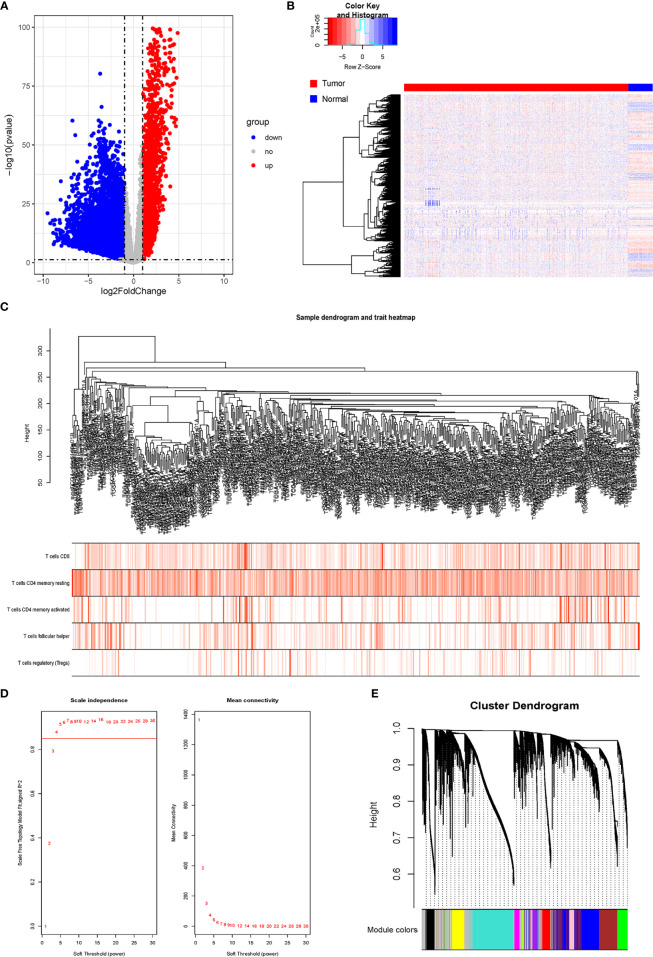
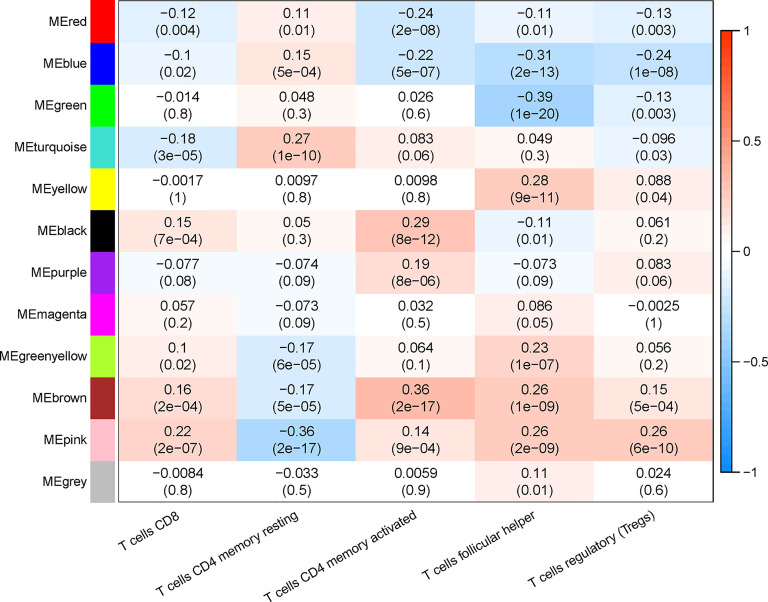
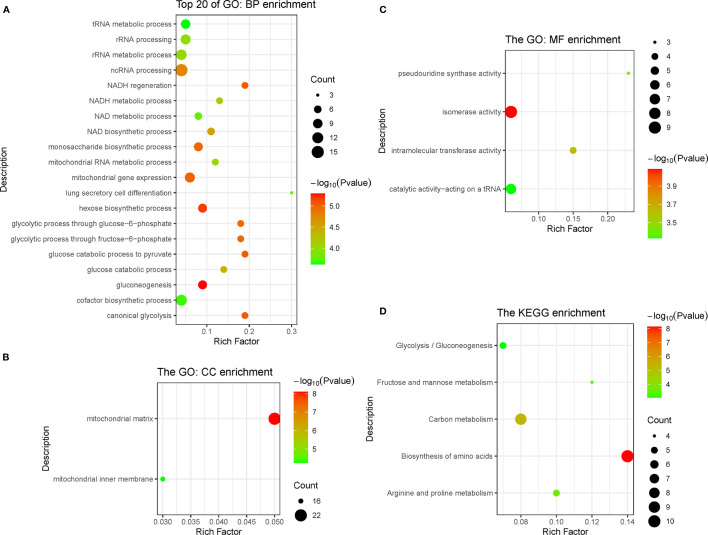
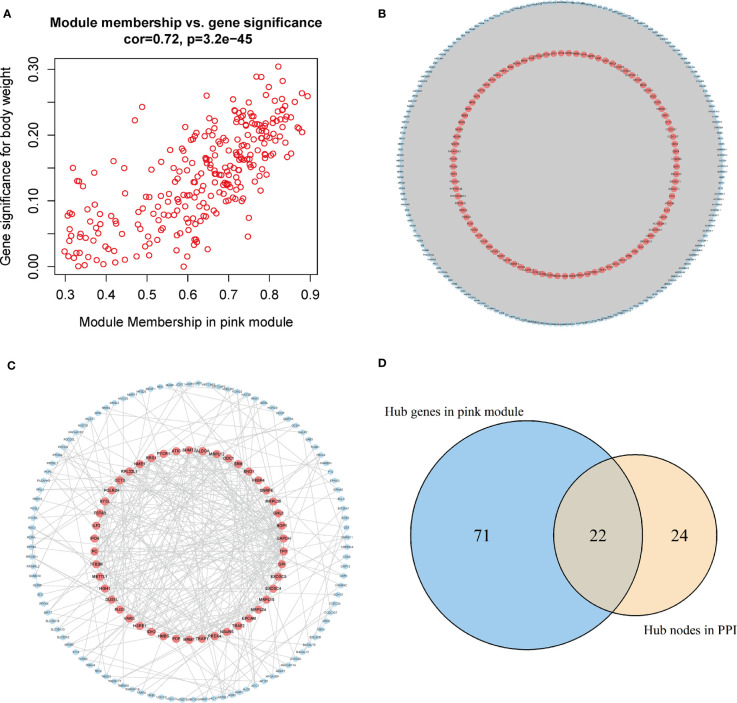
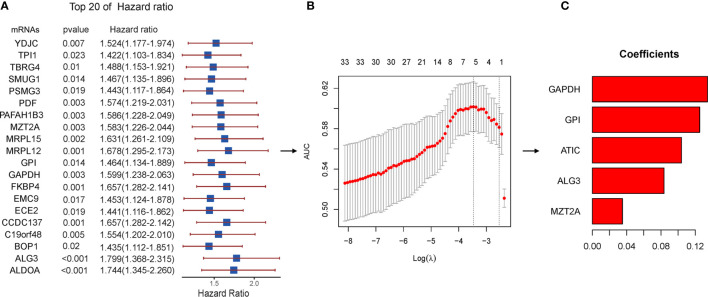
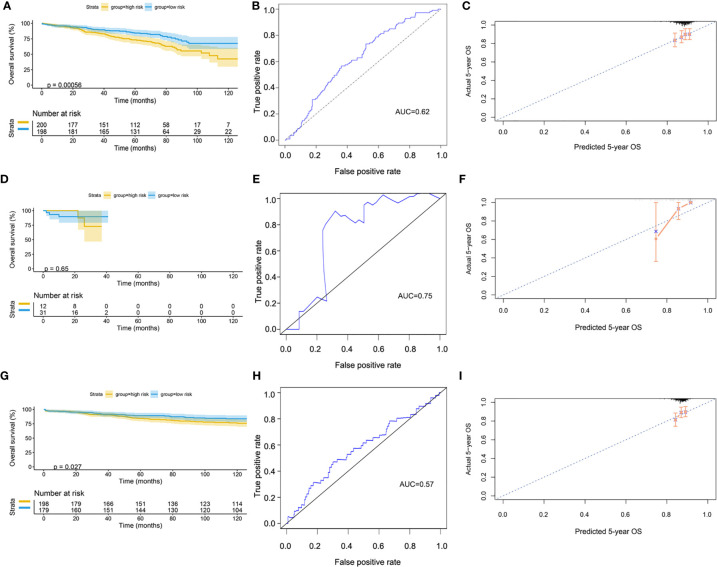
Methods: With the use of the LUAD dataset from The Cancer Genome Atlas (TCGA), the differentially expressed genes (DEGs) were analyzed, and a co-expression network was constructed by weighted gene co-expression network analysis (WGCNA). Combined with the CIBERSORT algorithm, the gene module in WGCNA, which was the most significantly correlated with CD8+ T cells, was selected for the subsequent analyses. Key genes were then identified by co-expression network analysis, protein-protein interactions network analysis, and least absolute shrinkage and selection operator (Lasso)-penalized Cox regression analysis. A risk assessment model was built based on these key genes and then validated by the dataset from the Gene Expression Omnibus (GEO) database and multiple fluorescence in situ hybridization experiments of a tissue microarray.
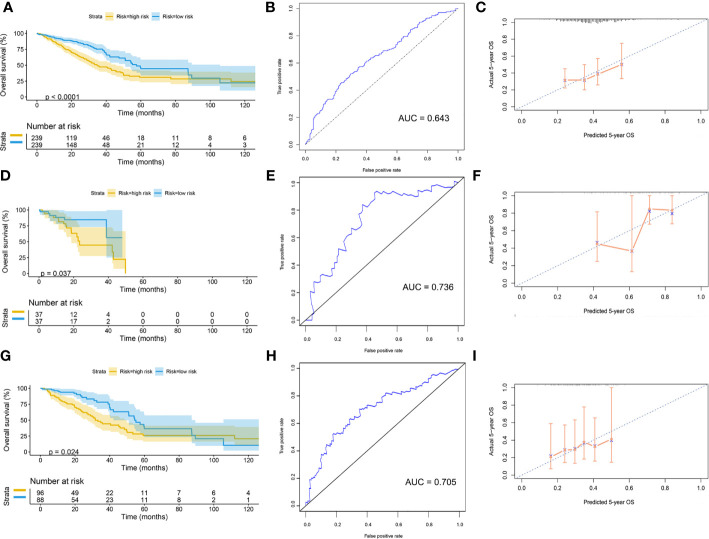
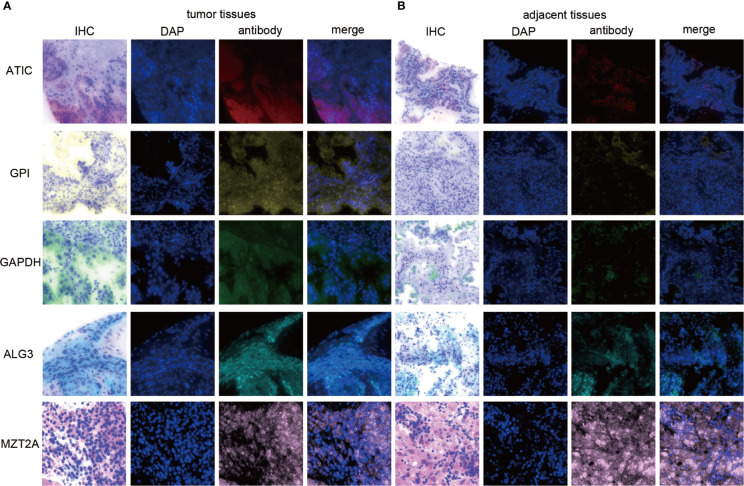
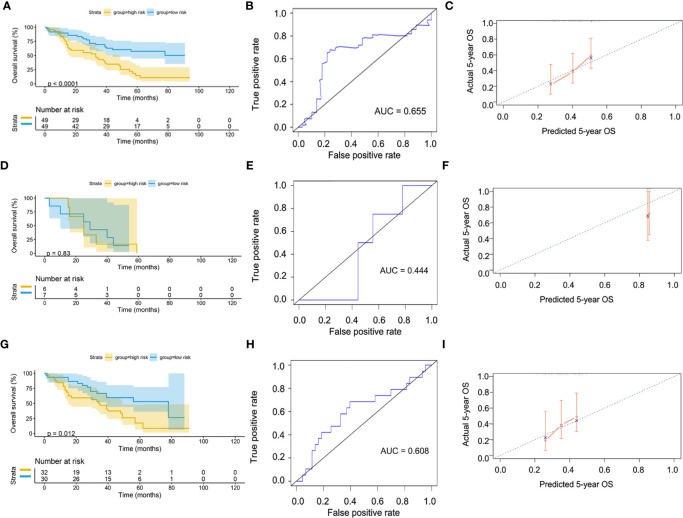
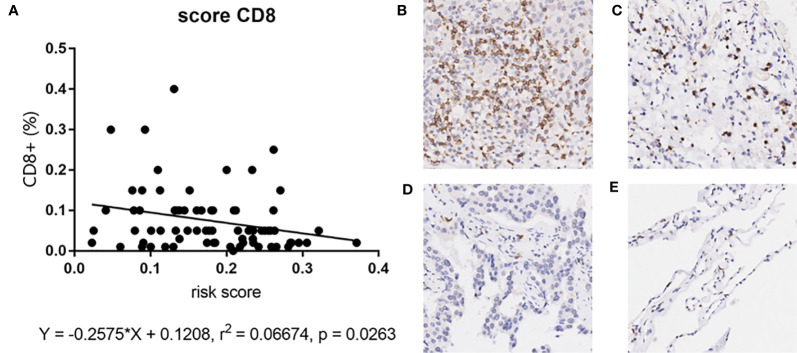
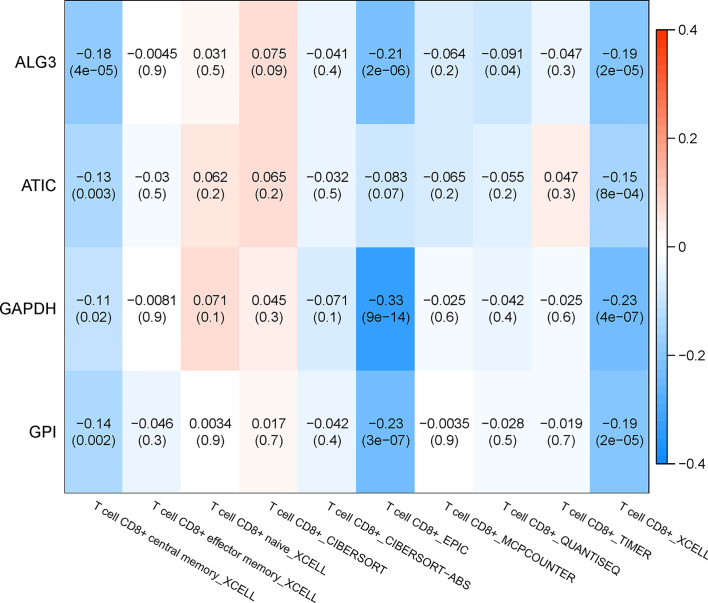
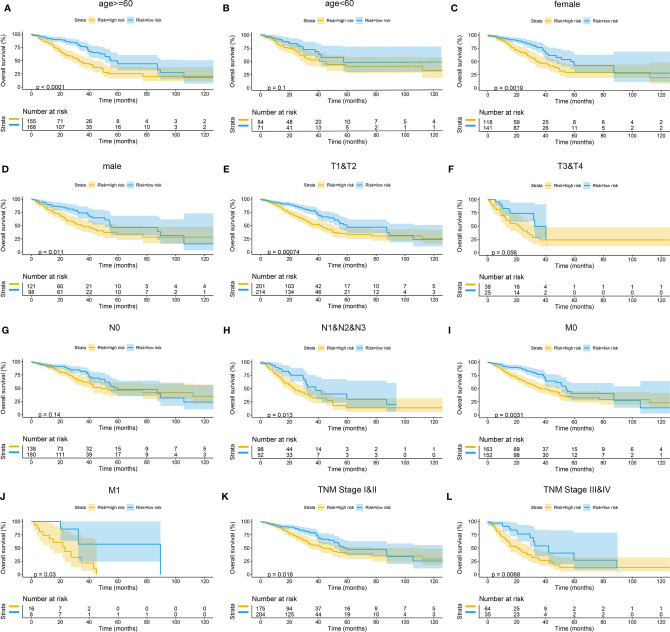
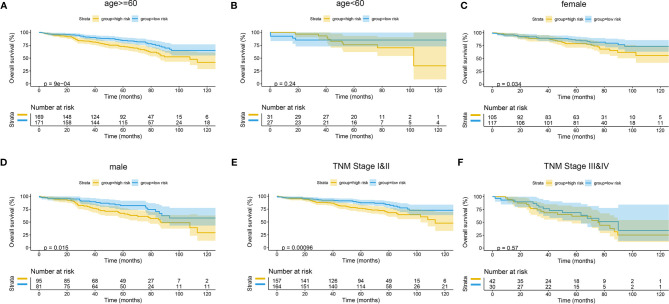
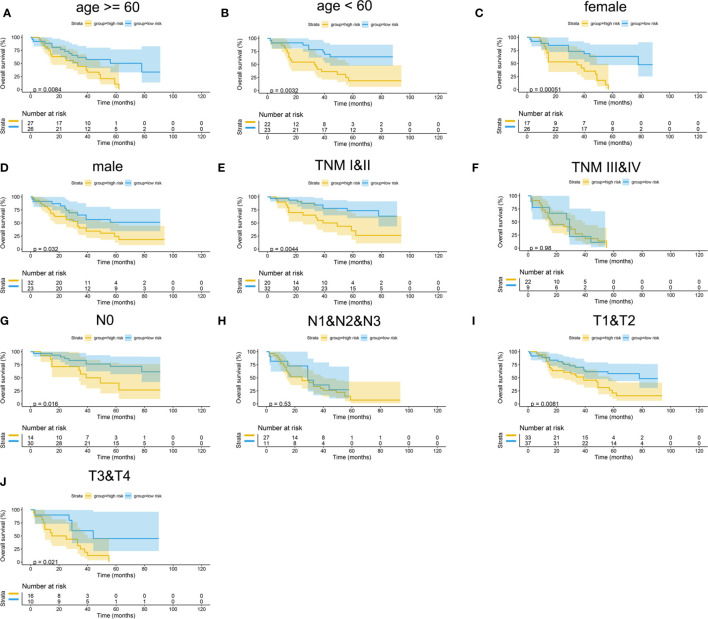
Results: Five key genes (MZT2A, ALG3, ATIC, GPI, and GAPDH) related to prognosis and CD8+ T-cell infiltration were identified, and a risk assessment model was established based on them. We found that the risk score could well predict the prognosis of LUAD, and the risk score was negatively related to CD8+ T-cell infiltration and correlated with the advanced tumor stage. The results of the GEO database and tissue microarray were consistent with those of TCGA. Furthermore, the risk score was higher significantly in tumor tissues than in adjacent lung tissues and was correlated with the advanced tumor stage.
Conclusions: This study may provide a novel risk assessment model for prognosis prediction and a new perspective to explore the mechanism of tumor immune microenvironment related to CD8+ T-cell infiltration in LUAD.
Keywords: CD8+ T cell; bioinformatics analysis; immune microenvironment; lung adenocarcinoma; multiplex immunohistochemistry.
Copyright © 2021 Du, Liang, Liu, Li, Liang, Zhou and Gao.
Conflict of interest statement
The authors declare that the research was conducted in the absence of any commercial or financial relationships that could be construed as a potential conflict of interest.
Figures
Similar articles
-
Evaluation of vital genes correlated with CD8 + T cell infiltration as prognostic biomarkers in stomach adenocarcinoma.BMC Gastroenterol. 2023 Nov 17;23(1):399. doi: 10.1186/s12876-023-03003-y. BMC Gastroenterol. 2023. PMID: 37978443 Free PMC article.
-
The prognostic value of immune escape-related genes in lung adenocarcinoma.Transl Cancer Res. 2024 Jun 30;13(6):2647-2661. doi: 10.21037/tcr-23-2295. Epub 2024 Jun 25. Transl Cancer Res. 2024. PMID: 38988926 Free PMC article.
-
Development of a ferroptosis-based model to predict prognosis, tumor microenvironment, and drug response for lung adenocarcinoma with weighted genes co-expression network analysis.Front Pharmacol. 2022 Nov 17;13:1072589. doi: 10.3389/fphar.2022.1072589. eCollection 2022. Front Pharmacol. 2022. PMID: 36467089 Free PMC article.
-
Analysis of prognostic genes in the tumor microenvironment of lung adenocarcinoma.PeerJ. 2020 Jul 23;8:e9530. doi: 10.7717/peerj.9530. eCollection 2020. PeerJ. 2020. PMID: 32775050 Free PMC article.
-
The Effect of GLUT1 on the Survival Rate and Immune Cell Infiltration of Lung Adenocarcinoma and Squamous Cell Carcinoma: A Meta and Bioinformatics Analysis.Anticancer Agents Med Chem. 2022;22(2):223-238. doi: 10.2174/1871520621666210708115406. Anticancer Agents Med Chem. 2022. PMID: 34238200 Review.
Cited by
-
Global Characterization of Metabolic Genes Regulating Survival and Immune Infiltration in Osteosarcoma.Front Genet. 2022 Jan 13;12:814843. doi: 10.3389/fgene.2021.814843. eCollection 2021. Front Genet. 2022. PMID: 35096022 Free PMC article.
-
Multi-omic and machine learning analysis of mitochondrial RNA modification genes in lung adenocarcinoma for prognostic and therapeutic implications.Transl Oncol. 2025 Mar;53:102306. doi: 10.1016/j.tranon.2025.102306. Epub 2025 Feb 4. Transl Oncol. 2025. PMID: 39908965 Free PMC article.
-
ITGA5 is an independent prognostic biomarker and potential therapeutic target for laryngeal squamous cell carcinoma.J Clin Lab Anal. 2022 Feb;36(2):e24228. doi: 10.1002/jcla.24228. Epub 2022 Jan 7. J Clin Lab Anal. 2022. PMID: 34994984 Free PMC article.
-
RASAL3 predicts overall survival and CD8+ T lymphocyte infiltration in lung adenocarcinoma.J Cell Mol Med. 2022 Dec;26(24):6056-6065. doi: 10.1111/jcmm.17625. Epub 2022 Nov 24. J Cell Mol Med. 2022. PMID: 36420686 Free PMC article.
-
Screening and identifying a novel M-MDSCs-related gene signature for predicting prognostic risk and immunotherapeutic responses in patients with lung adenocarcinoma.Front Genet. 2023 Jan 4;13:989141. doi: 10.3389/fgene.2022.989141. eCollection 2022. Front Genet. 2023. PMID: 36699465 Free PMC article.
References
LinkOut - more resources
Full Text Sources
Research Materials
Miscellaneous