A Systematic Analysis Identifies Key Regulators Involved in Cell Proliferation and Potential Drugs for the Treatment of Human Lung Adenocarcinoma
- PMID: 34650921
- PMCID: PMC8505978
- DOI: 10.3389/fonc.2021.737152
A Systematic Analysis Identifies Key Regulators Involved in Cell Proliferation and Potential Drugs for the Treatment of Human Lung Adenocarcinoma
Abstract
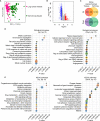
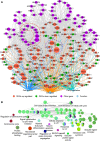
Lung adenocarcinoma (LUAD) is one of the most common and malignant cancer types. Abnormal cell proliferation, exemplified by cell cycle and cell division dysregulation, is one of the most prominent hallmarks of cancer and is responsible for recurrence, metastasis, and resistance to cancer therapy. However, LUAD-specific gene regulation and clinical significance remain obscure. Here, by using both tissues and cells from LUAD and normal lung samples, 434 increased and 828 decreased genes of biological significance were detected, including 127 cell cycle-associated genes (95 increased and 32 decreased), 66 cell division-associated genes (56 increased and 10 decreased), and 81 cell proliferation-associated genes (34 increased and 47 decreased). Among them, 12 increased genes (TPX2, CENPF, BUB1, PLK1, KIF2C, AURKB, CDKN3, BUB1B, HMGA2, CDK1, ASPM, and CKS1B) and 2 decreased genes (TACC1 and MYH10) were associated with all the three above processes. Importantly, 2 (CDKN3 and CKS1B) out of the 11 increased genes (except HMGA2) are previously uncharacterized ones in LUAD and can potentially be prognostic markers. Moreover, PLK1 could be a promising therapeutic target for LUAD. Besides, protein-protein interaction network analysis showed that CDK1 and CDC20 were the hub genes, which might play crucial roles in cell proliferation of LUAD. Furthermore, transcriptional regulatory network analysis suggested that the transcription factor E2F1 could be a key regulator in controlling cell proliferation of LUAD via expression modulation of most cell cycle-, cell division-, and cell proliferation-related DEGs. Finally, trichostatin A, hycanthone, vorinostat, and mebeverine were identified as four potential therapeutic agents for LUAD. This work revealed key regulators contributing to cell proliferation in human LUAD and identified four potential therapeutic agents for treatment strategy.
Keywords: cell proliferation; lung adenocarcinoma; prognosis; protein–protein interaction; transcriptional regulation.
Copyright © 2021 Wang, Zhang, Wang, Sun, Luo, Jin, Li, Pan and Lu.
Conflict of interest statement
The authors declare that the research was conducted in the absence of any commercial or financial relationships that could be construed as a potential conflict of interest.
Figures


Similar articles
-
The identification of key biomarkers in patients with lung adenocarcinoma based on bioinformatics.Math Biosci Eng. 2019 Aug 21;16(6):7671-7687. doi: 10.3934/mbe.2019384. Math Biosci Eng. 2019. PMID: 31698633
-
Comprehensive analysis of TPX2-related ceRNA network as prognostic biomarkers in lung adenocarcinoma.Int J Med Sci. 2020 Sep 1;17(16):2427-2439. doi: 10.7150/ijms.49053. eCollection 2020. Int J Med Sci. 2020. PMID: 33029085 Free PMC article.
-
Identification of key candidate genes associated with prognosis of lung adenocarcinoma by integrated bioinformatical analysis.Transl Cancer Res. 2020 Nov;9(11):6841-6856. doi: 10.21037/tcr-20-2110. Transl Cancer Res. 2020. PMID: 35117293 Free PMC article.
-
Co-expression network analysis identified KIF2C in association with progression and prognosis in lung adenocarcinoma.Cancer Biomark. 2019;24(3):371-382. doi: 10.3233/CBM-181512. Cancer Biomark. 2019. PMID: 30883337
-
Transcriptomic analysis of tumor tissues and organoids reveals the crucial genes regulating the proliferation of lung adenocarcinoma.J Transl Med. 2021 Aug 26;19(1):368. doi: 10.1186/s12967-021-03043-6. J Transl Med. 2021. PMID: 34446056 Free PMC article.
Cited by
-
An in-silico approach leads to explore six genes as a molecular signatures of lung adenocarcinoma.Am J Cancer Res. 2023 Mar 15;13(3):727-757. eCollection 2023. Am J Cancer Res. 2023. PMID: 37034228 Free PMC article.
-
Integrated bulk and single-cell RNA sequencing identifies an aneuploidy-based gene signature to predict sensitivity of lung adenocarcinoma to traditional chemotherapy drugs and patients' prognosis.PeerJ. 2024 Jun 24;12:e17545. doi: 10.7717/peerj.17545. eCollection 2024. PeerJ. 2024. PMID: 38938612 Free PMC article.
-
Transmission of Exosomal TPX2 Promotes Metastasis and Resistance of NSCLC Cells to Docetaxel.Onco Targets Ther. 2023 Mar 27;16:197-210. doi: 10.2147/OTT.S401454. eCollection 2023. Onco Targets Ther. 2023. PMID: 37009264 Free PMC article.
-
The role of Cyclin Dependent Kinase Inhibitor 3 (CDKN3) in promoting human tumors: Literature review and pan-cancer analysis.Heliyon. 2024 Feb 8;10(4):e26061. doi: 10.1016/j.heliyon.2024.e26061. eCollection 2024 Feb 29. Heliyon. 2024. PMID: 38380029 Free PMC article. Review.
-
In situ tailored confining microenvironment for lung cancer spheroids.Mater Today Bio. 2025 Feb 19;31:101602. doi: 10.1016/j.mtbio.2025.101602. eCollection 2025 Apr. Mater Today Bio. 2025. PMID: 40070872 Free PMC article.
References
LinkOut - more resources
Full Text Sources
Research Materials
Miscellaneous

