. 2021 Sep 28:9:735518.
doi: 10.3389/fcell.2021.735518. eCollection 2021.

Advanced Flow Cytometry Analysis Algorithms for Optimizing the Detection of "Different From Normal" Immunophenotypes in Acute Myeloid Blasts

Affiliations

Advanced Flow Cytometry Analysis Algorithms for Optimizing the Detection of "Different From Normal" Immunophenotypes in Acute Myeloid Blasts

Carmen-Mariana Aanei et al. Front Cell Dev Biol. .

Abstract

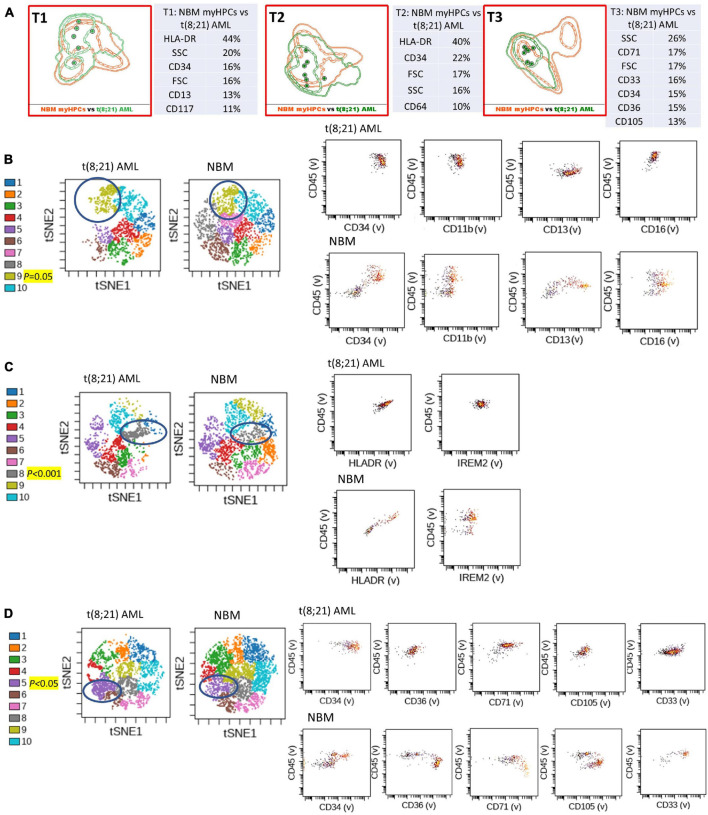
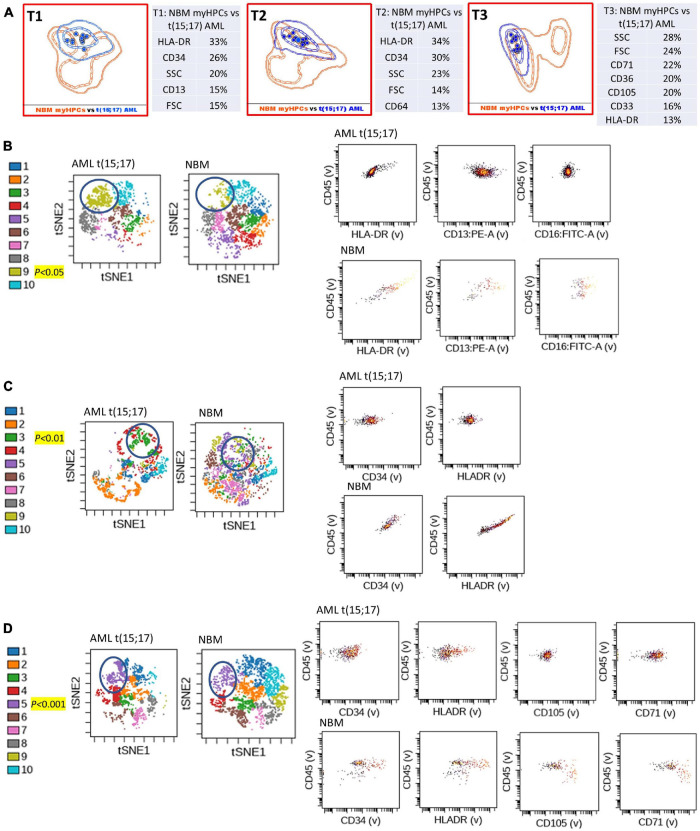
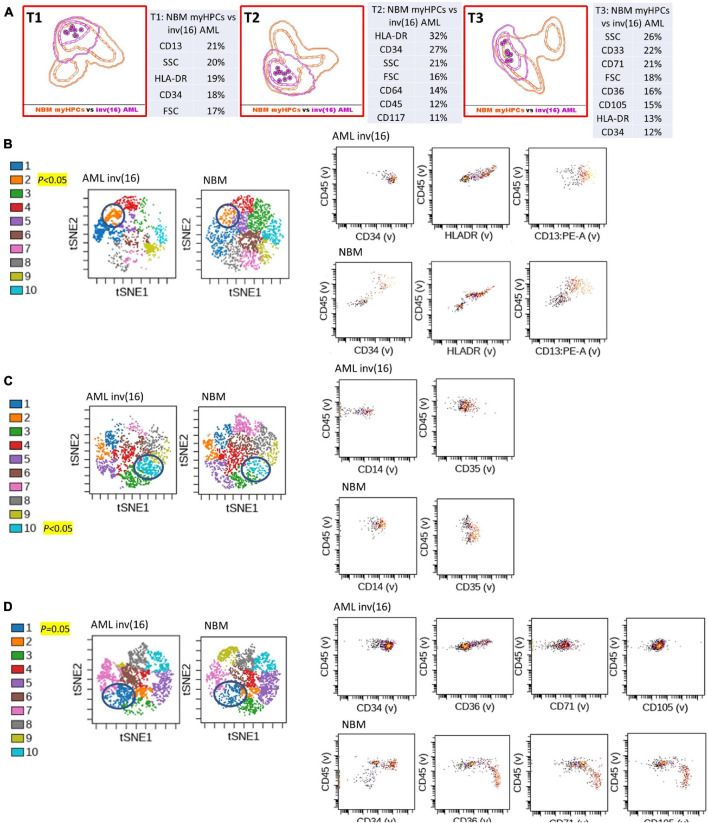
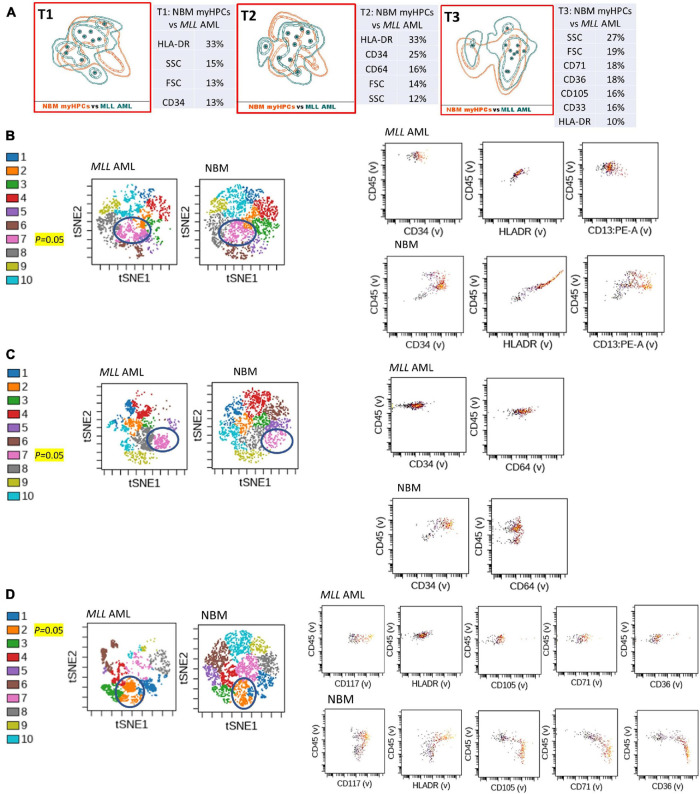
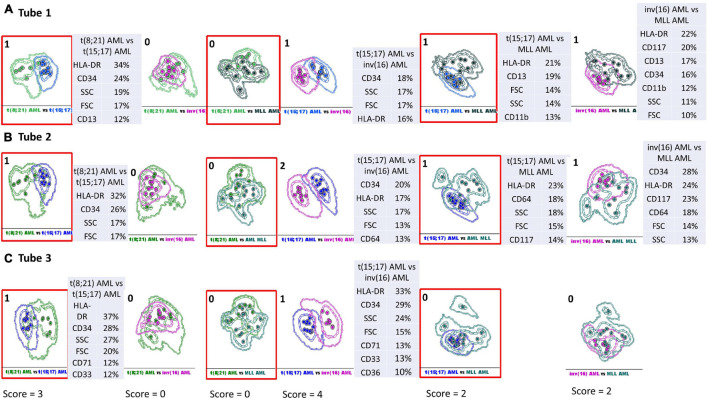
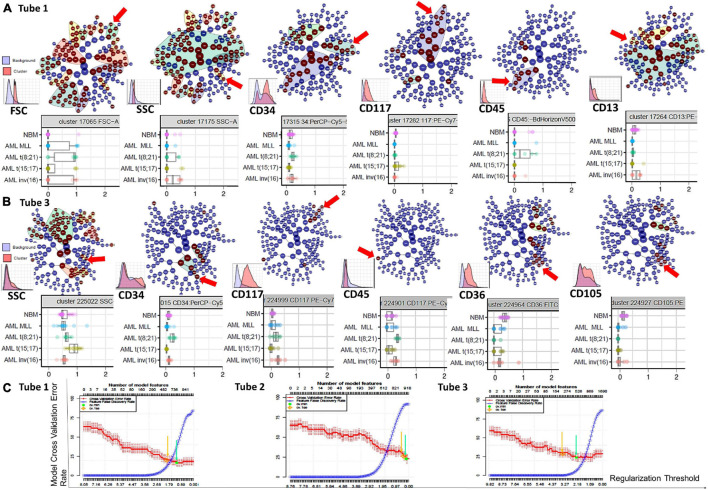
Acute myeloid leukemias (AMLs) are a group of hematologic malignancies that are heterogeneous in their molecular and immunophenotypic profiles. Identification of the immunophenotypic differences between AML blasts and normal myeloid hematopoietic precursors (myHPCs) is a prerequisite to achieving better performance in AML measurable residual disease follow-ups. In the present study, we applied high-dimensional analysis algorithms provided by the Infinicyt 2.0 and Cytobank software to evaluate the efficacy of antibody combinations of the EuroFlow AML/myelodysplastic syndrome panel to distinguish AML blasts with recurrent genetic abnormalities (n = 39 AML samples) from normal CD45low CD117+ myHPCs (n = 23 normal bone marrow samples). Two types of scores were established to evaluate the abilities of the various methods to identify the most useful parameters/markers for distinguishing between AML blasts and normal myHPCs, as well as to distinguish between different AML groups. The Infinicyt Compass database-guided analysis was found to be a more user-friendly tool than other analysis methods implemented in the Cytobank software. According to the developed scoring systems, the principal component analysis based algorithms resulted in better discrimination between AML blasts and myHPCs, as well as between blasts from different AML groups. The most informative markers for the discrimination between myHPCs and AML blasts were CD34, CD36, human leukocyte antigen-DR (HLA-DR), CD13, CD105, CD71, and SSC, which were highly rated by all evaluated analysis algorithms. The HLA-DR, CD34, CD13, CD64, CD33, CD117, CD71, CD36, CD11b, SSC, and FSC were found to be useful for the distinction between blasts from different AML groups associated with recurrent genetic abnormalities. This study identified both benefits and the drawbacks of integrating multiple high-dimensional algorithms to gain complementary insights into the flow-cytometry data.

Keywords: AML with recurrent genetic abnormalities; Citrus; Infinicyt; SPADE; different-from-normal (DfN); viSNE.


Conflict of interest statement

The authors declare that the research was conducted in the absence of any commercial or financial relationships that could be construed as a potential conflict of interest.

Figures

FIGURE 1
FIGURE 1
Phenotypic differences between t(8;21) AML blasts and the normal myHPCs using Tubes 1–3 of the EF AML/MDS panel and analysis with viSNE algorithms or Infinicyt analysis. (A) Tube 1 (T1) of the EuroFlow (EF) acute myeloid leukemia (AML)/myelodysplastic syndrome (MDS) panel. Tube 2 (T2), EF AML/MDS panel. Tube 3 (T3), EF AML/MDS panel. Automated population separator (APS) views of illustrating principal component analyses (PCA; using Infinicyt software) of t(8;21) AML (green) and normal myeloid hematopoietic precursor (myHPCs, orange) samples, based on the expression of the eight markers included in the T1, and FSC, SSC parameters (left panel), T2 (middle panel), and T3 (right panel). Tube 1: 6 t(8;21) AML, 19 normal myHPCs; Tube 2: 7 t(8;21) AML, 19 normal myHPCs; Tube 3: 7 t(8;21) AML, 21 normal myHPCs. Dots represent the median values of individual cases, the dotted line represents the 1 SD curve of the group and the solid line represents the 2 SD curve. The table shows the contribution of each parameter to the first (PC1, x-axis) or second (PC2, y-axis) principal component reflected as percent values. (B–D left panel) Representative viSNE diagrams showing the nodes with a significant difference between t(8;21) AML and normal bone marrow (NBM) cases (node 9 T1, node 8 T2, and node 5 T3 are indicated by blue circles on the plot, and highlighted in yellow with significance level). (B–D right panel) Dot plots also show significant differences in the expression of markers on myHPCs from NBM versus t(8;21) AML blasts.
FIGURE 2
FIGURE 2
Phenotypic differences between t(15;17) AML blasts and the normal myHPCs using Tubes 1–3 of the EF AML/MDS panel and analysis with viSNE algorithms or Infinicyt analysis. (A) Tube 1 (T1) of the EuroFlow (EF) acute myeloid leukemia (AML)/myelodysplastic syndrome (MDS) panel. Tube 2 (T2), EF AML/MDS panel. Tube 3 (T3), EF AML/MDS panel. Automated population separator (APS) views of illustrating principal component analyses (PCA; using Infinicyt software) of t(15;17) AML (blue) and normal myeloid hematopoietic precursor (myHPCs, orange) samples, based on the expression of the eight markers included in the T1, and FSC, SSC parameters (left panel), T2 (middle panel), and T3 (right panel). Tube 1: 12 t(15;17) AML, 19 normal myHPCs; Tube 2: 12 t(15;17) AML, 19 normal myHPCs; Tube 3: 12 t(15;17) AML, 21 normal myHPCs. Dots represent the median values of individual cases, the dotted line represents the 1 SD curve of the group and the solid line represents the 2 SD curve. The table shows the contribution of each parameter to the first (PC1, x-axis) or second (PC2, y-axis) principal component reflected as percent values. (B–D left panel) Representative viSNE diagrams showing the nodes with a significant difference between t(15;17) AML and normal bone marrow (NBM) cases (node 9 T1, node 3 T2, and node 5 T3 are indicated by blue circles on the plot, and highlighted in yellow with significance level). (B–D right panel) Dot plots also show significant differences in the expression of markers on myHPCs from NBM versus t(15;17) AML blasts.
FIGURE 3
FIGURE 3
Phenotypic differences between inv(16) AML blasts and the normal myHPCs using tubes 1–3 of the EF AML/MDS panel and analysis with viSNE algorithms or Infinicyt analysis. (A) Tube 1 (T1) of the EuroFlow (EF) acute myeloid leukemia (AML)/myelodysplastic syndrome (MDS) panel. Tube 2 (T2), EF AML/MDS panel. Tube 3 (T3), EF AML/MDS panel. Automated population separator (APS) views of illustrating principal component analyses (PCA; using Infinicyt software) of inv(16) AML (violet) and normal myeloid hematopoietic precursor (myHPCs, orange) samples, based on the expression of the eight markers included in the T1, and FSC, SSC parameters (left panel), T2 (middle panel), and T3 (right panel). Tube 1: 8 inv(16) AML, 19 normal myHPCs; Tube 2: 8 inv(16) AML, 19 normal myHPCs; Tube 3: 8 inv(16) AML, 21 normal myHPCs. Dots represent the median values of individual cases, the dotted line represents the 1 SD curve of the group and the solid line represents the 2 SD curve. The table shows the contribution of each parameter to the first (PC1, x-axis) or second (PC2, y-axis) principal component reflected as percent values. (B–D left panel) Representative viSNE diagrams showing the nodes with a significant difference between inv(16) AML and normal bone marrow (NBM) cases (node 2 T1, node 10 T2, and node 1 T3 are indicated by blue circles on the plot, and highlighted in yellow with significance level). (B–D right panel) Dot plots also show significant differences in the expression of markers on myHPCs from NBM versus inv(16) AML blasts.
FIGURE 4
FIGURE 4
Phenotypic differences between MLL AML blasts and the normal myHPCs using Tubes 1–3 of the EF AML/MDS panel and analysis with viSNE algorithms or Infinicyt analysis. (A) Tube 1 (T1) of the EuroFlow (EF) acute myeloid leukemia (AML)/myelodysplastic syndrome (MDS) panel. Tube 2 (T2), EF AML/MDS panel. Tube 3 (T3), EF AML/MDS panel. Automated population separator (APS) views of illustrating principal component analyses (PCA; using Infinicyt software) of MLL AML (turquoise) and normal myeloid hematopoietic precursor (myHPCs, orange) samples, based on the expression of the eight markers included in the T1, and FSC, SSC parameters (left panel), T2 (middle panel), and T3 (right panel). Tube 1: 10 MLL AML, 19 normal myHPCs; Tube 2: 10 MLL AML, 19 normal myHPCs; Tube 3: 11 MLL AML, 21 normal myHPCs. Dots represent the median values of individual cases, the dotted line represents the 1 SD curve of the group and the solid line represents the 2 SD curve. The table shows the contribution of each parameter to the first (PC1, x-axis) or second (PC2, y-axis) principal component reflected as percent values. (B–D left panel) Representative viSNE diagrams showing the nodes with a significant difference between MLL AML and normal bone marrow (NBM) cases (node 7 T1, node 7 T2, and node 2 T3 are indicated by blue circles on the plot, and highlighted in yellow with significance level). (B–D right panel) Dot plots also show significant differences in the expression of markers on myHPCs from NBM versus MLL AML blasts.
FIGURE 5
FIGURE 5
Infinicyt database-guided analyses aid identification of phenotypic differences between AML groups with different genetic abnormalities. Samples were stained with antibodies from Tube 1–3 of the EuroFlow (EF) acute myeloid leukemia (AML)/myelodysplastic syndrome (MDS) panel. Sample groups: t(8;21) acute myeloid leukemia (green), t(15;17) AML (blue), inv(16) AML (violet), MLL AML (turquoise). Dots represent the median values of individual cases; the dotted line represents the 1 SD curve of the group and the solid line represents the 2 SD curve. The tables show the contribution of each parameter to the first (PC1, x-axis) or second (PC2, y-axis) principal component reflected as percent values. The separation between different AML groups was scored based on an overlap of the 2 SD curves: no overlap between 2 SD curves (2 points); overlap of the 2 SD and the 1 SD curve: 1 point; overlap of both 1 SD curves: 0 points. The total score to evaluate the discriminative capacity between the AML blasts from different AML groups was obtained by summing the values obtained in tubes 1–3 EF AML/MDS for each two-by-two paired group [t(8;21) AML versus t(15;17) AML, t(8;21) AML versus inv(16) AML, t(8;21) AML versus MLL AML, t(15;17) AML versus inv(16) AML, t(15;17) AML versus MLL AML, and inv(16) AML versus MLL AML]. (A) Phenotypic differences between AML groups with different genetic abnormalities observed with Tube 1 EF AML/MDS panel. (B) Phenotypic differences between AML groups with different genetic abnormalities observed with Tube 2 EF AML/MDS panel. (C) Phenotypic differences between AML groups with different genetic abnormalities observed with Tube 3 EF AML/MDS panel.
FIGURE 6
FIGURE 6
Phenotypic differences identified by the Citrus algorithms between AML blasts and normal myHPCs using Tubes 1–3 of the EF AML/MDS panel. Citrus-defined radial hierarchical plots (A) colored by FSC, SSC, CD34, CD117, CD45, and CD13 expression (Tube 1 of the EF AML/MDS panel), and (B) colored by SSC, CD34, CD117, CD45, CD36, and CD105 expression (Tube 3 of the EF AML/MDS panel). CITRUS trees in which each node denotes different cell clusters. The red arrow illustrate cell clusters were the median marker intensities differed statistically significantly between the five groups [NBM, MLL AML, t(8;21) AML, t(15;17) AML, and inv(16) AML] as determined by PAMR analysis (R implementation of Prediction Analysis for Microarrays). No clusters were identified in the Citrus trees when using the markers form the Tube 2 of the EF AML/MDS panel and the software default settings. Boxplots below Citrus-defined radial hierarchical plots reveals the differences of parameter expression among the different groups of cases. Box plots shows the median marker intensities for the various markers [expressing interquartile range (IQR) and median values] and values for each individual within the groups of cases. The nodes chosen to be shown in boxplots represent the parent clusters (the “highest in the hierarchy” significant node). CITRUS histograms for the parent clusters are illustrated on the top of each marker. For each marker, the histogram shows the marker expression on the cells of interest in the specific cluster (red) against the marker expression on all other cells (blue). (C) Citrus-generated model error rate plots. Cv_1se was used with a 5 fold cross validation and a false discovery rate of 0.01 was applied. Each plot displays the cross-validation (CV) error rate (red line) and the false discovery rate (blue line) for the CV constrained models corresponding to each tube (from left to right: Tubes 1 to 3 of EF AML/MDS panel). Vertical arrows indicate the features of two predictive CV-constrained models with varying stringency: 1 standard error CV (cv_1se), yellow arrow; minimum CV (cv.min), green arrow.

Similar articles

Cited by

References

    1. Abel A., Steeg C., Aminkiah F., Addai-Mensah O., Addo M., Gagliani N., et al. (2018). Differential expression pattern of co-inhibitory molecules on CD4+ T cells in uncomplicated versus complicated malaria. Sci. Rep. 8:4789. 10.1038/s41598-018-22659-1 - DOI - PMC - PubMed
    1. Amir el A. D., Davis K. L., Tadmor M. D., Simonds E. F., Levine J. H., Bendall S. C., et al. (2013). viSNE enables visualization of high dimensional single-cell data and reveals phenotypic heterogeneity of leukemia. Nat. Biotechnol. 31 545–552. 10.1038/nbt.2594 - DOI - PMC - PubMed
    1. Brooimansa R. A., van der Velden V. H. J., Boeckx N., Slomp J., Preijers F., te Marvelde J. G., et al. (2019). Immunophenotypic measurable residual disease (MRD) in acute myeloid leukemia: is multicentric MRD assessment feasible? Leuk. Res. 76 39–47. 10.1016/j.leukres.2018.11.014 - DOI - PubMed
    1. Byford E. T., Carr M., Ladikou E., Ahearne M. J., Wagner S. D. (2018). Circulating Tfh1 (cTfh1) cell numbers and PD1 expression are elevated in low-grade B-cell non-Hodgkin’s lymphoma and cTfh gene expression is perturbed in marginal zone lymphoma. PLoS One 13:e0190468. 10.1371/journal.pone.0190468 - DOI - PMC - PubMed
    1. Chester C., Maecker H. T. (2015). Algorithmic tools for mining high-dimensional cytometry data. J. Immunol. 195 773–779. 10.4049/jimmunol.1500633 - DOI - PMC - PubMed