. 2021 Oct;10(12):e12158.
doi: 10.1002/jev2.12158.

Urinary extracellular vesicles: Assessment of pre-analytical variables and development of a quality control with focus on transcriptomic biomarker research

Affiliations

Urinary extracellular vesicles: Assessment of pre-analytical variables and development of a quality control with focus on transcriptomic biomarker research

Karina Barreiro et al. J Extracell Vesicles. 2021 Oct.

Abstract

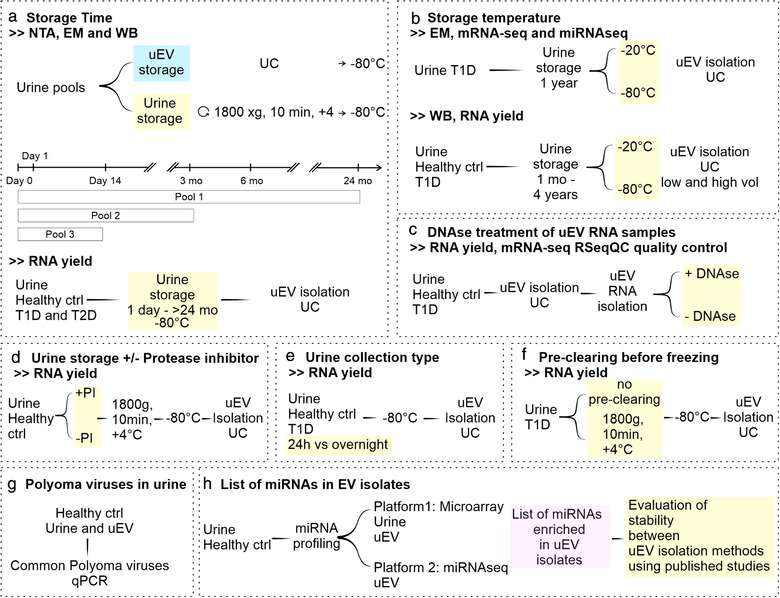
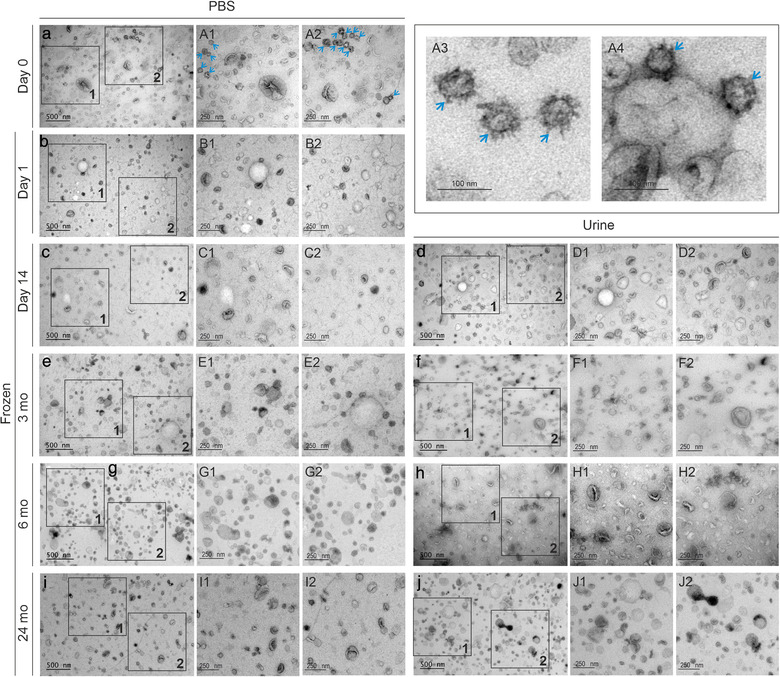
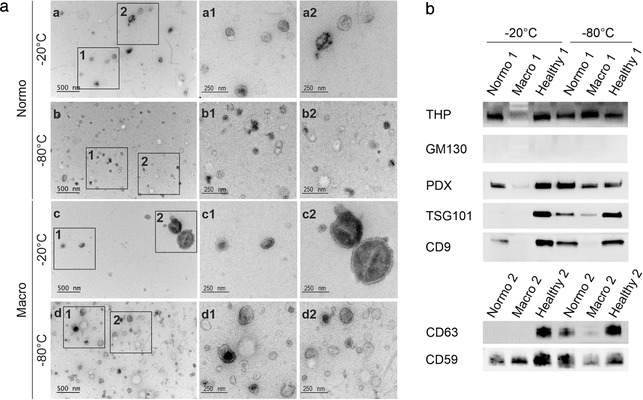
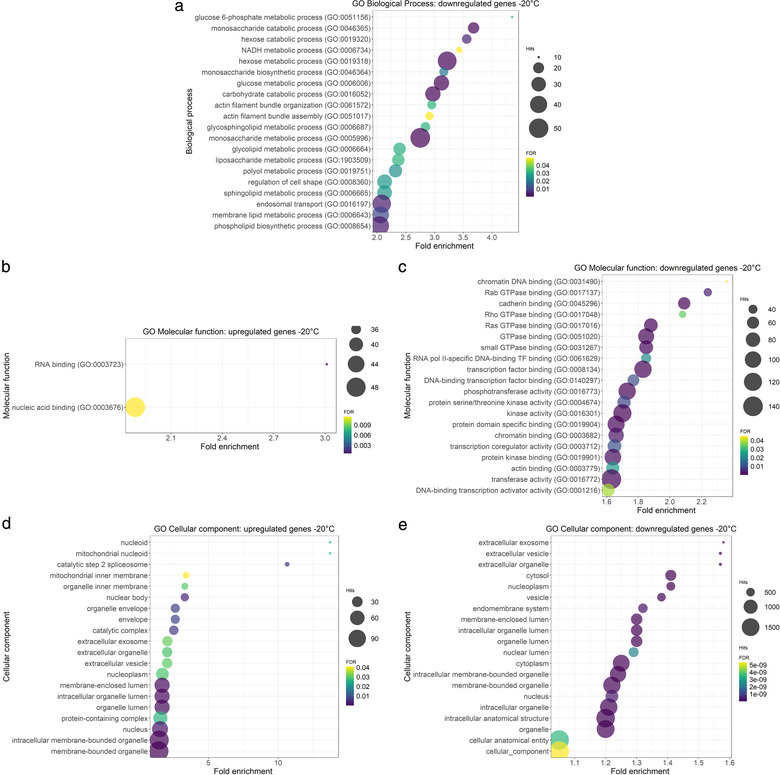
Urinary extracellular vesicles (uEV) are a topical source of non-invasive biomarkers for health and diseases of the urogenital system. However, several challenges have become evident in the standardization of uEV pipelines from collection of urine to biomarker analysis. Here, we studied the effect of pre-analytical variables and developed means of quality control for uEV isolates to be used in transcriptomic biomarker research. We included urine samples from healthy controls and individuals with type 1 or type 2 diabetes and normo-, micro- or macroalbuminuria and isolated uEV by ultracentrifugation. We studied the effect of storage temperature (-20°C vs. -80°C), time (up to 4 years) and storage format (urine or isolated uEV) on quality of uEV by nanoparticle tracking analysis, electron microscopy, Western blotting and qPCR. Urinary EV RNA was compared in terms of quantity, quality, and by mRNA or miRNA sequencing. To study the stability of miRNA levels in samples isolated by different methods, we created and tested a list of miRNAs commonly enriched in uEV isolates. uEV and their transcriptome were preserved in urine or as isolated uEV even after long-term storage at -80°C. However, storage at -20°C degraded particularly the GC-rich part of the transcriptome and EV protein markers. Transcriptome was preserved in RNA samples extracted with and without DNAse, but read distributions still showed some differences in e.g. intergenic and intronic reads. MiRNAs commonly enriched in uEV isolates were stable and concordant between different EV isolation methods. Analysis of never frozen uEV helped to identify surface characteristics of particles by EM. In addition to uEV, qPCR assays demonstrated that uEV isolates commonly contained polyoma viruses. Based on our results, we present recommendations how to store and handle uEV isolates for transcriptomics studies that may help to expedite standardization of the EV biomarker field.

Keywords: DNAse; biomarkers; mRNA; microRNA; storage temperature; storage time; transcriptomics; urinary exosomes; urinary extracellular vesicles; virus.


Conflict of interest statement

KB, OPD, SV, CF, PG, TT, HH, MY, PS, ES, TH, SL, AR, LG, MP, have no conflict of interest to declare.

Figures

FIGURE 1
FIGURE 1
Experimental workflows employed in this study to evaluate the effects of pre‐analytical variables on uEV quality and transcriptomics: a. Effect of storage time on the uEV particle number, size distribution, morphology, protein markers and RNA yield. b. Effect of storage temperature on the uEV morphology, protein markers, RNA yield, miRNA‐seq and mRNA‐seq. c. Effect of DNAse treatment on uEV RNA yield and quality of mRNA‐seq alignment as evaluated with RSeqQC. d. Effect of urine storage with or without protease inhibitors on uEV RNA yield. e. Effect of urine collection type (24 h vs. overnight) on uEV RNA yield. f. Effect of pre‐clearing urine before freezing on uEV RNA yield. g. Co‐isolation of common polyoma viruses present in urine and uEV isolates. h. Analysis of miRNAs enriched in the uEV isolates and testing the list to evaluate stability of the miRNA between isolation methods using published datasets. Healthy control individuals (Healthy ctrl), messenger RNA sequencing (mRNA‐seq), micro RNA sequencing (miRNA‐seq), months (mo), individuals with type 1 diabetes (T1D) or type 2 diabetes (T2D), ultracentrifugation (UC), urinary extracellular vesicles (uEV), volume (vol)
FIGURE 2
FIGURE 2
Effect of storage time (‐80°C) and storage medium on uEV morphology. Transmission electron micrographs of fresh uEV (day 0) or ‐80°C stored uEV divided based on storage medium i.e. uEV were isolated from urine stored at ‐80°C or uEV were isolated from fresh urine and then stored in PBS at ‐80°C for 1 day, 14 days and 3, 6, or 24 months. uEV derived from equal volumes of urine were loaded to grids from each time point. Blue arrowheads: particles with spikes visible in fresh samples. Months (mo), phosphate buffered saline (PBS), urinary extracellular vesicles (uEV)
FIGURE 3
FIGURE 3
Effect of storage time (‐80°C) and storage medium on uEV protein profile and markers. Data is from fresh uEV (day 0) or ‐80°C stored uEV divided based on storage medium i.e. uEV were isolated from urine stored at ‐80°C or uEV were isolated from fresh urine and then stored in PBS at ‐80°C for 1 day, 14 days and 3, 6, or 24 months. uEV derived from equal volumes of urine were loaded from each time point. At each time point, medium was run as three or two technical replicates. a. SDS‐PAGE protein profiles of uEV detected in stain free‐gels (day 0 and 1) or in coomassie blue ‐stained gels (day 14 and 3, 6, or 24 months). b. Western blotting of uEV enriched markers. Immunodetection of EV markers TSG101, HSP70 and CD9 is shown. Months (mo), phosphate buffered saline (PBS), urinary extracellular vesicles (uEV)
FIGURE 4
FIGURE 4
Effect of freezing (‐80°C) on particle surface spikes. Transmission electron micrographs of fresh and frozen (‐80°C) uEV from the same sample. Vesicles from equal volume of urine were loaded onto grids. a and b. Negative staining. c and d. Immunodetection of CD59. Blue arrows: vesicles with spikes, back arrows: gold particles indicating presence of CD59. Urinary extracellular vesicles (uEV)
FIGURE 5
FIGURE 5
Effect of urine storage temperature (‐20°C vs. ‐80°C) on uEV morphology and protein markers. a. Transmission electron micrographs of frozen uEV from donors with type 1 diabetes and normo‐ or macroalbuminuria. Urine samples were stored at ‐20°C or ‐80°C for 1 year before uEV isolation. b. Western blotting of uEV isolated from urine stored at ‐20°C or ‐80°C for 1.5 months (healthy) or longer, up to 4 years (normo and macro). Here, uEV were isolated from low urine volume, 7.8 ml (uEV isolated from high urine volumes in Supplementary Figure 3). uEV derived from equal volumes of urine were loaded for each sample. Immunodetection of EV markers (PDX, TSG101, CD9, CD63 and CD59), a common protein that co‐isolates with uEV (THP) and a Golgi marker (GM130). Healthy control (Healthy), macroalbuminuria (macro), normoalbuminuria (normo), podocalyxin (PDX), Tamm–Horsfall protein (THP), urinary extracellular vesicles (uEV)
FIGURE 6
FIGURE 6
Effect of storage time, storage temperature and DNAse treatment on RNA or DNA yield from uEV. Total RNA yield (expressed as pg/ml of urine) was quantified using pico 6000 RNA chip in Agilent 2100 Bioanalyzer. DNA content was quantified using Qubit dsDNA HS Assay kit. a. RNA yield and urine storage time. uEV were isolated from urines stored for up to 4 years at ‐80°C including samples from healthy controls and donors with T1D or T2D and normo‐ micro‐ or macroalbuminuria. Differences in the RNA yield between time points were tested using One‐way ANOVA and Bonferroni Post‐Hoc test. b. RNA yield and urine storage temperature (‐20°C, ‐80°C). uEV were isolated from healthy controls and donors with T1D and normo‐ or macroalbuminuria including urines stored for up to 4 years. T‐test for paired samples was used to assess the difference between groups. c and d. DNAse treatment. RNA yield (C) and DNA concentration (D) of uEV‐RNA treated with and without DNAse during RNA isolation. uEV were isolated from healthy control samples. T‐test for paired samples was used to assess difference between groups. Months (mo), type 1 diabetes (T1D), type 2 diabetes (T2D), urinary extracellular vesicles (uEV), with DNAse treatment (+DNAse), without DNAse treatment (‐DNAse)
FIGURE 7
FIGURE 7
Effect of urine storage temperature (‐20°C versus ‐80°C) on mRNA sequencing of uEV. Results depict 24 uEV‐mRNA samples including 4 pairs of urine samples stored in ‐20°C versus ‐80°C (pairs 1–4) and 16 more samples stored at –80°C. All samples were stored for 1 year at the indicated temperatures. Data was TMM normalized and analysed using edgeR. a. Alignment of raw sequencing reads to human genome using STAR. b. Sample to sample correlation heatmap (10136 genes, with > 1 raw count in at least 90% of the samples). c. Principal component analysis (10136 genes, with > 1 raw count in at least 90% of the samples). d. Heatmap of 22 kidney‐enriched genes (www.proteinatlas.org). e. Differential expression analysis of the ‐20°C versus ‐80°C pairs (4 pairs) (12642 genes, with > 5 raw counts in at least 50% of the samples). Volcano plot depicts differentially expressed genes. Adjusted p‐values lower than 0.05 and log2 fold change ≥ 0.75 or ≤ ‐0.75 are highlighted in red. Principal component analysis (PCA), urinary extracellular vesicle (uEV)
FIGURE 8
FIGURE 8
Gene length, GC content and overlap with P‐body transcripts of up‐ and down‐regulated genes in uEV isolated from urines stored at ‐20°C versus ‐80°C. a. Transcript length (if several transcripts were retrieved, the average length was calculated). b. Gene %GC content. c. Distribution of gene %GC content in ‐20°C and ‐80°C samples. Genes with raw counts ≥ 5 were selected for the analysis. T‐test for four paired samples (Type 1 Diabetes) was used to assess differences between groups per percentage category. Urinary extracellular vesicles (uEV). d. Venn diagram of P‐body enriched transcripts and transcripts upregulated or downregulated in uEV by urine storage at ‐20°C versus ‐80°C
FIGURE 9
FIGURE 9
Gene ontology enrichment analysis of differentially expressed genes in uEV isolated from urine stored at ‐20°C versus ‐80°C. a. Top 20 GO biological process of downregulated genes in the ‐20°C group. No significant biological processes were found for upregulated genes. b. GO molecular function of upregulated genes in the ‐20°C group. c. Top 20 GO molecular function of downregulated genes in the ‐20°C group. d. Top 20 GO cellular component of upregulated genes in the ‐20°C group. e. Top 20 GO cellular component of downregulated genes in the ‐20°C group. Gene ontology (GO), Urinary extracellular vesicles (uEV)
FIGURE 10
FIGURE 10
Effect of urine storage temperature (‐20°C vs. ‐80°C) on uEV miRNA sequencing. Results depict 24 uEV miRNA samples including 4 pairs of urine samples stored in ‐20°C versus ‐80°C (pairs 1–4) and 16 more samples stored at –80°C. All samples were stored for 1 year at the indicated temperatures. Data was TMM normalized and analysed using edgeR. a. miRNA raw sequencing reads. b. Sample‐to‐sample correlation heatmap (623 miRNAs, with > 1 raw count in at least one sample). c. Principal component analysis (623 miRNAs, with > 1 raw count in at least one sample). d. Differential expression analysis of ‐20°C versus ‐80°C pairs (4 pairs) (183 miRNAs, with > 1 raw count in at least 50% of the samples). Heatmap showing the 33 differentially expressed miRNAs (4 upregulated and 29 downregulated in ‐20°C samples). MicroRNAs with adjusted p‐values lower than 0.05 and a log2 fold change ≥ 0.75 or ≤ ‐0.75 were considered differentially expressed between groups. Principal component analysis (PCA), urinary extracellular vesicles (uEV)
FIGURE 11
FIGURE 11
Comparison of miRNAs enriched in the uEV isolates from this study or in previous publications evaluating uEV isolation methods. The list of miRNA enriched in uEV isolates was build based on healthy male ‐derived data from two different miRNA platforms and Vesiclepedia. The plots show the miRNA expression levels from different miRNA‐seq studies including only men. a. Barreiro et al., . uEV were isolated from healthy controls and individuals with type 1 diabetes and macroalbuminuria. Raw counts were TMM normalized using edgeR. b. Mussack et al., . uEV were isolated from healthy controls. Trimmed sequences were aligned using Chimira and counts were TMM normalized using edgeR. c. Srinivasan et al., . Data selected for our analysis is derived from uEV or exRNA isolated from pooled urines of healthy controls (technical replicates). RPMSmiR counts were log2 transformed. d. uEV isolated by UC from urine sample pairs (4 pairs) stored at ‐20°C and ‐80°C. Urine samples included were from individuals with type 1 diabetes and micro‐ or macroalbuminuria. Hsa‐miR‐10a‐5p was found to be upregulated in ‐20°C group (figure 9). Counts per million (CPM), exosome Isolation Kit Pan, human (Exosome isolation kit), false discovery rate (FDR), hydrostatic filtration dialysis (HFD), ultracentrifugation (UC), reads per million scaled miRNA (RPMSmiR), urinary extracellular vesicles (uEV), urine Exosome Purification and RNA Isolation Midi Kit (NG)
FIGURE 12
FIGURE 12
Summary of results and recommendations. Never frozen refers to uEV isolated from fresh urine and kept at +4°C for a maximum of 1 day. Electron microscopy (EM), not applicable (NA), not determined (ND), not compared but data presented in the manuscript supports the statement (No difference)*, overnight (ON), principal component analysis (PCA), sequencing (seq), urinary extracellular vesicles (uEV), with DNAse treatment (+DNAse), with pre‐clearing before freezing (+pre‐clearing), with protease inhibitor (+PI), without DNAse treatment (‐DNAse), without pre‐clearing before freezing (‐pre‐clearing), without protease inhibitor (‐PI).

References

    1. Adiconis, X. , Borges‐Rivera, D. , Satija, R. , Deluca, D. S. , Busby, M. A. , Berlin, A. M. , Sivachenko, A. , Thompson, D. A. , Wysoker, A. , Fennell, T. , Gnirke, A. , Pochet, N. , Regev, A. , & Levin, J. Z. (2013). Comparative analysis of RNA sequencing methods for degraded or low‐input samples. Nature Methods, 10(7), 623–629. 10.1038/nmeth.2483 - DOI - PMC - PubMed
    1. Akiyama, B. M. , Eiler, D. , & Kieft, J. S. (2016). Structured RNAs that evade or confound exonucleases: Function follows form. Current Opinion in Structural Biology, 36, 40–47. 10.1016/j.sbi.2015.12.006 - DOI - PMC - PubMed
    1. Anders, S. , Pyl, P. T. , & Huber, W. (2015). HTSeq–a Python framework to work with high‐throughput sequencing data. Bioinformatics, 31(2), 166–169. 10.1093/bioinformatics/btu638 - DOI - PMC - PubMed
    1. Andrzejewska, A. , Zawadzka, M. , & Pachulska‐Wieczorek, K. (2020). On the way to understanding the interplay between the RNA structure and functions in cells: A genome‐wide perspective. International Journal of Molecular Sciences, 21(18), 6770. 10.3390/ijms21186770 - DOI - PMC - PubMed
    1. Armstrong, D. A. , Dessaint, J. A. , Ringelberg, C. S. , Hazlett, H. F. , Howard, L. , Abdalla, M. A.K. , Barnaby, R. L. , Stanton, B. A. , Cervinski, M. A. , & Ashare, A. (2018). Pre‐analytical handling conditions and small RNA recovery from urine for miRNA profiling. The Journal of Molecular Diagnostics, 20(5), 565–571. 10.1016/j.jmoldx.2018.04.003 - DOI - PMC - PubMed

Publication types