. 2021 Oct 15;131(20):e136329.
doi: 10.1172/JCI136329.

The key role of NLRP3 and STING in APOL1-associated podocytopathy

Affiliations

The key role of NLRP3 and STING in APOL1-associated podocytopathy

Junnan Wu et al. J Clin Invest. .

Abstract

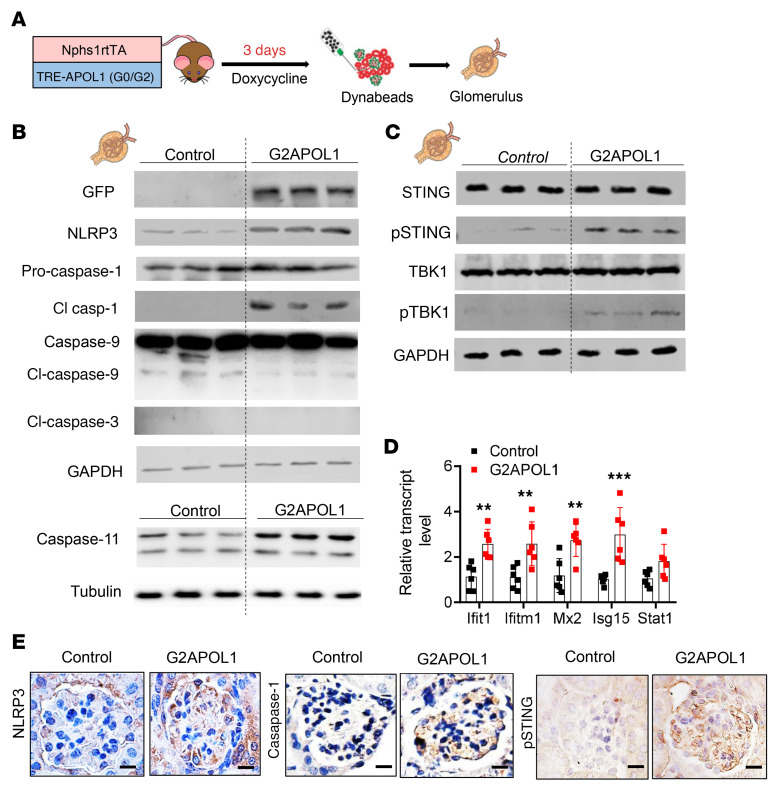
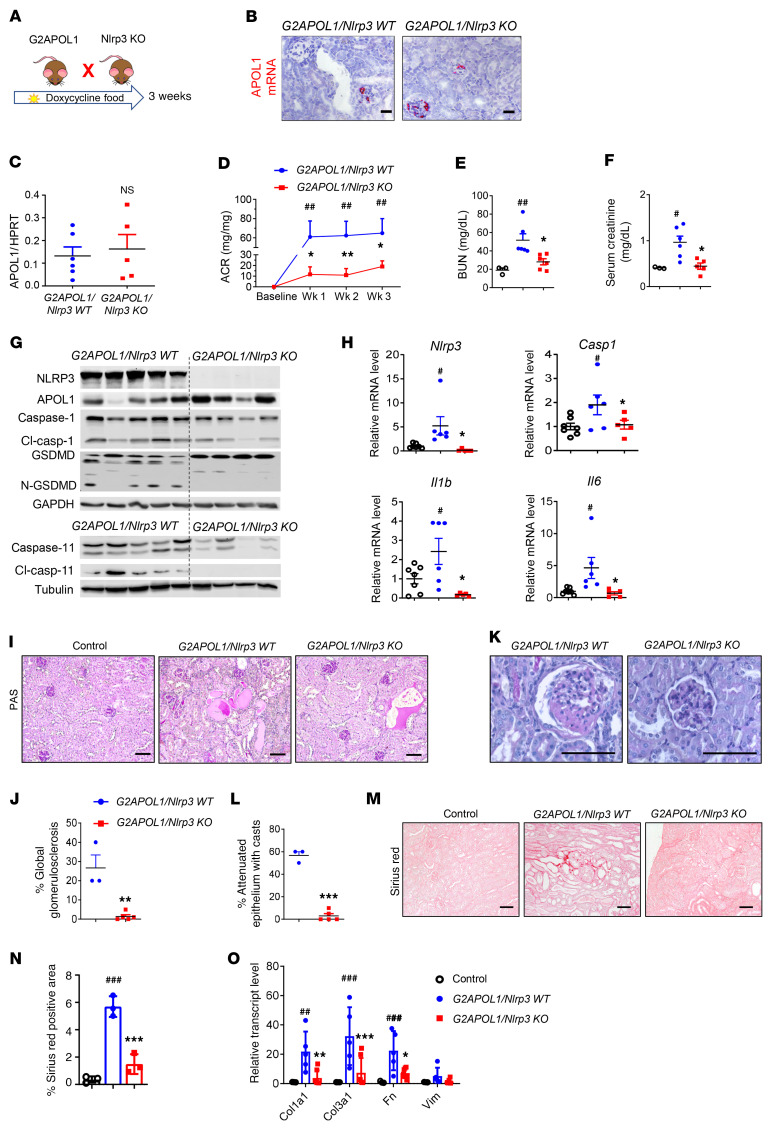
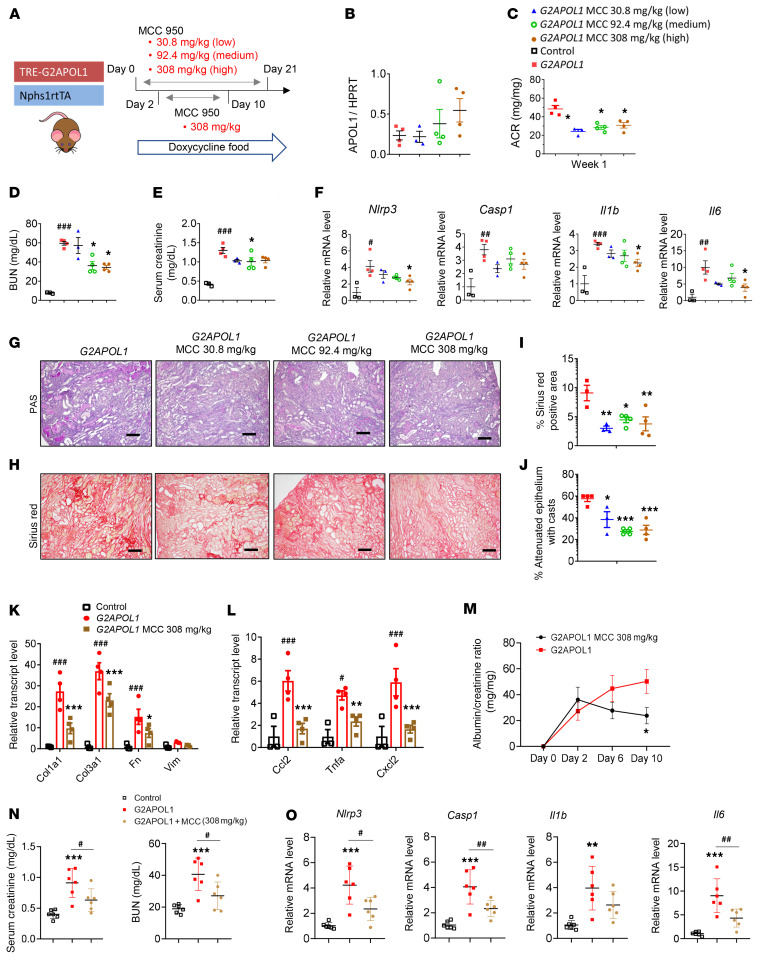
Coding variants in apolipoprotein L1 (APOL1), termed G1 and G2, can explain most excess kidney disease risk in African Americans; however, the molecular pathways of APOL1-induced kidney dysfunction remain poorly understood. Here, we report that expression of G2 APOL1 in the podocytes of Nphs1rtTA/TRE-G2APOL1 (G2APOL1) mice leads to early activation of the cytosolic nucleotide sensor, stimulator of interferon genes (STING), and the NLR family pyrin domain-containing 3 (NLRP3) inflammasome. STING and NLRP3 expression was increased in podocytes from patients with high-risk APOL1 genotypes, and expression of APOL1 correlated with caspase-1 and gasdermin D (GSDMD) levels. To demonstrate the role of NLRP3 and STING in APOL1-associated kidney disease, we generated transgenic mice with the G2 APOL1 risk variant and genetic deletion of Nlrp3 (G2APOL1/Nlrp3 KO), Gsdmd (G2APOL1/Gsdmd KO), and STING (G2APOL1/STING KO). Knockout mice displayed marked reduction in albuminuria, azotemia, and kidney fibrosis compared with G2APOL1 mice. To evaluate the therapeutic potential of targeting NLRP3, GSDMD, and STING, we treated mice with MCC950, disulfiram, and C176, potent and selective inhibitors of NLRP3, GSDMD, and STING, respectively. G2APOL1 mice treated with MCC950, disulfiram, and C176 showed lower albuminuria and improved kidney function even when inhibitor treatment was initiated after the development of albuminuria.

Keywords: Cell Biology; Chronic kidney disease; Nephrology.


Figures

Figure 1
Figure 1. Podocyte-specific APOL1 risk allele expression induced activation of cell death and signaling pathways in mouse kidneys.
(A) Experimental design: Nphs1-rtTA/TREG0APOL1-GFP (G0APOL1) and Npsh1-rtTA/TREG2APOL1-GFP (G2APOL1) mice were generated and placed on a doxycycline-containing diet for 3 weeks to induce kidney disease. (B) Albumin/creatinine ratio (ACR) of urine samples of G0APOL1 and G2APOL1 mice (n = 3). ***P < 0.001 vs. G0APOL1. (C) Representative PAS-stained sections of G0APOL1 and G2APOL1 mice. Scale bars: 30 μm (top) and 10 μm (bottom). (D) Representative Western blots of whole-kidney lysates of G0APOL1 and G2APOL1 mice. Immunoblots indicate markers of inflammasome activation (NLRP3, caspase-1, cleaved caspase-1 [cl-Casp1]), apoptosis (cleaved caspase-9 and cleaved caspase-3), and pyroptosis (caspase-11, gasdermin D [GSDMD], and cleaved N-terminal GSDMD [N-GSDMD]). GAPDH was used as a loading control. (E) Immunoblots indicate markers of STING activation (STING, phosphorylated STING, TBK1, phosphorylated TBK1, IRF3, phosphorylated IRF3). (F) Relative transcript levels of Ifit1, Ifitm1, Mx2, Isg15, and Stat1 in whole-kidney lysates of G20POL1 (n = 6) and G2APOL1 (n = 6) mice. *P < 0.05, ***P < 0.001 vs. G0APOL1. Significance was determined by Student’s 2-tailed t test (B) or 1-way ANOVA and SNK post hoc test (F). Data are expressed as the mean ± SEM.
Figure 2
Figure 2. STING and inflammasome activation in glomeruli of G2APOL1 mice.
(A) Experimental design: Control and G2APOL1 mice were generated and placed on doxycycline diet for 3 days to induce APOL1 expression. Glomeruli were isolated using Dynabeads. (B) Representative Western blots from glomerular lysates of control or G2APOL1 mice. Immunoblots indicate markers of inflammasome activation (NLRP3, caspase-1, cleaved caspase-1, caspase-11) and apoptosis (cleaved caspase-9, cleaved caspase-3). GAPDH was used as a loading control. (C) Immunoblots indicate markers of STING activation (STING, phosphorylated STING, TBK1, and phosphorylated TBK1). (D) Relative transcript levels of Ifit1, Ifitm1, Mx2, Isg15, and Stat1 in kidneys of control (n = 6) and G2APOL1 (n = 6) mice. **P < 0.01, ***P < 0.001 vs. control. (E) Immunostaining analysis of NLRP3, caspase-1, and phosphorylated STING (pSTING) in control and G2APOL1 mice. Scale bars: 10 μm. Full images of NLRP3 and caspase-1 staining are shown in Supplemental Figure 6. Significance was determined by 1-way ANOVA and SNK post hoc test. Data are expressed as the mean ± SEM.
Figure 3
Figure 3. APOL1-induced cytotoxicity of high-risk human podocytes is inflammasome and STING dependent.
(A) Experimental design: Low- (G0/G0) and high-risk (G1/G2) HUPECs treated with IFN-γ. (B) Representative Western blots and (C) densitometric quantification of APOL1, NLRP3, cleaved caspase-1, STING, phosphorylated STING, and actin of G0/G0 and G1/G2 cells treated with vehicle or 2 ng/mL IFN-γ for 24 hours (n = 3). *P < 0.05, **P < 0.01, ***P < 0.001. (D) Cytotoxicity, measured by LDH release, was normalized to calcein absorbance as an indicator of live cell count. G0/G0 and G1/G2 cells were treated for 24 hours with vehicle (n = 5), 0.2 ng/mL IFN-γ (n = 6), or 2 ng/mL IFN-γ (n = 6). ***P < 0.001 vs. control. (E) Cytotoxicity in G1/G2 HUPECs. G1/G2 HUPECs were treated with 2 ng/mL IFN-γ for 24 hours in the presence of inhibitors of NLRP3 (MCC950 [MCC]), caspase-1 (Ac-YVAD-CHO [Cho] and VX765 [VX]), caspase-9 (LEHD [Leh]), necroptosis (NEC1s [Nec]), ferroptosis (Liproxstatin [Lip]), p38 MAPK (SB 203580 [p38]), autophagy (choloroquine [CQ]), and inducers of autophagy (STF66247 [STF] and rapamycin [Rapa]). n = 3. ###P < 0.001 vs. control; **P < 0.01, ***P < 0.001 vs. IFN-γ. (F) Change in intracellular Ca2+ (measured by FURA-2 AM fluorescence) presented as percentage change from baseline. Cells were treated with 0.2 ng/mL, 2 ng/mL, or 20 ng/mL IFN-γ for 8 hours (n = 3). *P < 0.05 vs. control-treated cells. (G) Relative calcineurin activity of G0/G0 and G1/G2 HUPECs treated with sham or the indicated concentrations of IFN-γ. **P < 0.01, ***P < 0.001 vs. control (n = 6); ###P < 0.001 vs. indicated group. (H) Cytotoxicity of G1/G2 HUPECs. G1/G2 cells were treated for 24 hours with 2 ng/mL or 20 ng/mL IFN-γ with or without pretreatment with 0.5 μM BAPTA in Ca2+-free HBSS for 2 hours (n = 6). ***P < 0.001 vs. control-treated cells; red-colored, *P < 0.05 vs. indicated group. Significance was determined by 1-way ANOVA and SNK post hoc test. Data are expressed as the mean ± SEM.
Figure 4
Figure 4. Genetic deletion of Nlrp3 in G2APOL1-transgenic mice markedly improves kidney function.
(A) Experimental design for the generation of G2APOL1/Nlpr3-KO mice. (B) Representative images of APOL1 in situ hybridization. (C) Relative APOL1 transcript levels in kidneys of G2APOL1/Nlrp3-WT (n = 6) and G2APOL1/Nlrp3-KO (n = 5) mice. (D) ACR of G2APOL1/Nlpr3-KO (n = 6) and G2APOL1/Nlrp3-KO mice (n = 5) at baseline, 1, 2, and 3 weeks on doxycycline diet. ##P < 0.01 vs. baseline; *P < 0.05, **P < 0.01 vs. G2APOL1/Nlrp3-KO mice at the same time points. (E) BUN and (F) serum creatinine levels of control (n = 3), G2APOL1/Nlrp3-WT (n = 6), and G2APOL1/Nlrp3-KO mice (n = 5). *P < 0.05 vs. G2APOL1/Nlrp3-WT; #P < 0.05, ##P < 0.01 vs. control. (G) Western blots of whole-kidney lysates. (H) Relative transcript levels of Nlrp3, Casp1, Il1b, and Il6 in control (n = 7), G2APOL1/ Nlrp3-WT (n = 6), and G2APOL1/Nlrp3-KO (n = 5) mice. #P < 0.05 vs. control; *P < 0.05 vs. G2APOL1/Nlrp3-WT. (I) PAS-stained kidney sections. (J) Semiquantitative analysis of percentage of globally sclerotic glomeruli in G2APOL1/Nlrp3-WT (n = 3) and G2APOL1/NLRP3-KO (n = 5) mice. **P < 0.01 vs. G2APOL1/NLRP3-WT. (K) Representative images of glomeruli. (L) Percentage of attenuated epithelium with casts in G2APOL1/Nlrp3-WT (n = 3) and G2APOL1/NLRP3-KO (n = 5) mice. ***P < 0.001 vs. G2APOL1/NLRP3-WT. (M) Sirius red–stained kidney sections. (N) Quantification of Sirius red–positive area. ###P < 0.001 vs. control; ***P < 0.001 vs. G2APOL1/NLRP3-WT. (O) Relative mRNA levels of Col1a1, Col3a1, Fn1, and Vim in the kidneys of control (n = 3), G2APOL1/NLRP3-WT (n = 5), and G2APOL1/NLRP3-KO (n = 7) mice. ##P < 0.01, ###P < 0.001 vs. control; **P < 0.01, ***P < 0.001 vs. G2APOL1/NLRP3-WT. Scale bars: 30 μm. Significance was determined by 1-way ANOVA and SNK post hoc test. Data are expressed as the mean ± SEM.
Figure 5
Figure 5. Genetic deletion of STING in G2APOL1-transgenic mice markedly improves kidney function.
(A) Experimental design for the generation of Nphs1rtTA/TREG2APOL1/STING-KO (G2APOL1/STING-KO) mice. (B) Western blots of whole-kidney lysates from G2APOL1/STING-WT and G2APOL1/STING-KO mice showing levels of STING and GAPDH. (C) Relative STING transcript levels in kidneys of G2APOL1/STING-WT (n = 5) and 2APOL1/STING-KO mice (n = 5). ***P < 0.01 vs. G2APOL1/STING-WT. (D) Albuminuria (ACR) of G2APOL1/STING-WT (n = 5) and G2APOL1/STING-KO mice (n = 5) at baseline, 1, 2, and 3 weeks on doxycycline diet. *P < 0.05, **P < 0.01, ***P < 0.001, comparing G2APOL1/STING-WT mice at the same time points. (E) Serum creatinine levels in control (n = 5), G2APOL1/STING-WT (n = 5), and G2APOL1/STING-KO mice (n = 5). ***P < 0.001 vs. control; #P < 0.05 vs. indicated group. (F) Serum urea nitrogen (BUN) levels in control, G2APOL1/ STING-WT, and G2APOL1/STING-KO mice. ***P < 0.001 vs. control; #P < 0.05 vs. indicated group. (G)PAS-stained and Sirius red–stained kidney sections of control, G2APOL1/STING-WT, and G2APOL1/STING-KO mice. Scale bars: 30 μm. (H) Quantification of globally sclerotic glomeruli and Sirius red–positive area of control, G2APOL1/STING-WT, and G2APOL1/STING-KO mice. n = 6 mice per group. ***P < 0.001 vs. control; ##P < 0.01, ###P < 0.001 vs. indicated group. (I) Relative mRNA levels of profibrotic genes Col1a1 (collagen type I α1 chain), Col3a1 (collagen type III α1 chain), Fn1 (fibronectin 1), and Vim (vimentin); and markers of inflammation Ccl2 (chemokine ligand 2), Tnfa (TNF-α), and Cxcl2 (CXC ligand 2) were evaluated in the kidneys of control, G2APOL1/STING-WT, and G2APOL1/STING-KO mice. n = 6 mice. ***P < 0.001 vs. control; #P < 0.05, ###P < 0.001 vs. indicated group. Significance was determined by 1-way ANOVA and SNK post hoc test. Data are expressed as the mean ± SEM.
Figure 6
Figure 6. Pharmacological inhibition of GSDMD and STING improves kidney disease in G2APOL1 mice.
(A) Experimental design: G2APOL1 mice were placed on doxycycline diet and treated with GSDMD inhibitor (disulfiram) or STING inhibitor (C176) or sham for 10 days. (B) Relative APOL1 transcript levels in whole-kidney tissue of G2APOL1 sham (only doxycycline diet; n = 6), disulfiram (n = 6), and C176 (n = 6). (C) Albuminuria (ACR) levels of control (n = 6), G2APOL1 (n = 6), disulfiram-treated (n = 6), and C176-treated (n = 6) G2APOL1 mice. ***P < 0.001 vs. control; #P < 0.05 vs. G2APOL1. (D) Serum creatinine levels of control (n = 6), G2APOL1 (n = 6), disulfiram-treated (n = 6), and C176-treated (n = 6) G2APOL1 mice. ***P < 0.001 vs. control; #P < 0.05, ##P < 0.01 vs. G2APOL1. (E) BUN levels of control (n = 6), G2APOL1 (n = 6), disulfiram-treated (n = 6), and C176-treated (n = 6) G2APOL1 mice. ***P < 0.001 vs. control; #P < 0.05, ##P < 0.01 vs. G2APOL1. (F) PAS-stained and Sirius red–stained kidney sections of control, G2APOL1, disulfiram-, and C176-treated G2APOL1 mice. Scale bars: 30 μm. (G) Quantification of Sirius red–positive area of control, G2APOL1, disulfiram-, and C176-treated G2APOL1 mice. n = 6 mice per group. ***P < 0.001 vs. control; ###P < 0.001 vs. indicated group. (H) Relative mRNA levels of profibrotic genes Col1a1, Col3a1, Fn1, and Vim; and markers of inflammation Ccl2, Tnfa, and Cxcl2 were evaluated in the kidneys of control, G2APOL1, disulfiram-, and C176-treated G2APOL1 mice. n = 6 mice. **P < 0.01, ***P < 0.001 vs. control; #P < 0.05, ##P < 0.05, ###P < 0.001 vs. indicated group. Significance was determined by 1-way ANOVA and SNK post hoc test. Data are expressed as the mean ± SEM.
Figure 7
Figure 7. Pharmacological inhibition of NLRP3 reduces inflammasome signaling and improves kidney disease in G2APOL1 mice.
(A) Experimental design: G2APOL1 mice were placed on doxycycline diet with or without 30.8 mg/kg (low), 92.4 mg/kg (medium), or 308 mg/kg (high) MCC950 for 3 weeks. (B) Relative APOL1 transcript levels in whole kidney, n = 4. (C) ACR at 1 week on doxycycline, n = 4. *P < 0.05 vs. G2APOL1 sham. (D) BUN, (E) serum creatinine, and (F) relative transcript levels of Nlrp3, Casp1, Il1b, and Il6 in control (n = 3), G2APOL1 (n = 4), low (n = 4), medium (n = 4), and high dose MCC950 (n = 4). #P < 0.05, ##P < 0.01, ###P < 0.001 vs. control; *P < 0.05 vs. G2APOL1. (G) Representative PAS-stained and (H) Sirius red–stained kidney section. Scale bars: 30 μm. (I) Quantification of Sirius red–positive area, n = 4 mice. *P < 0.05, **P < 0.01 vs. G2APOL1. (J) Percentage of attenuated epithelium with casts in G2APOL1 (n = 4), low (n = 4), medium (n = 4), and high dose MCC950 (n = 4). *P < 0.05, ***P < 0.001 vs. G2APOL1. (K) Relative mRNA levels of Col3a1, Fn1, and Vim, and (L) Ccl2, Tnfa, and Cxcl2 were evaluated in the kidneys of control (n = 3), G2APOL1 (n = 4), medium (n = 4), and high dose MCC950 (n = 4). ###P < 0.001 vs. control; **P < 0.01, ***P < 0.001 vs. G2APOL1 sham. (M) ACR in G2APOL1 mice treated with high dose MCC950 at baseline, 1, 2, 6, and 10 days on doxycycline diet (n = 6). *P < 0.05 vs. G2APOL1. (N) Serum creatinine levels and (O) relative transcript levels of Nlrp3, Casp1, Il1b, and Il6 in control, G2APOL1, and high dose MCC950 (n = 6). **P < 0.01, ***P < 0.001 vs. control; #P < 0.05, ##P < 0.01 vs. indicated group. Significance was determined by 1-way ANOVA and SNK post hoc test. Data are expressed as the mean ± SEM.
Figure 8
Figure 8. Increase in podocyte NLRP3 and inflammasome expression in APOL1 high-risk patients.
(A) We analyzed RNA-sequencing data from 427 microdissected human kidney glomeruli and correlated transcript level with APOL1 expression. (B) Relative APOL1 expression (y axis) and eGFR (x axis) in glomeruli isolated from 427 individual kidney samples (Pearson’s correlation). (CI) Relative transcript expression (y axis) of IFI16 (C), STAT1 (D), CASP1 (E), GSDMD (F), STING (G), cGAS (H), and TBK1 (I) and APOL1 expression (x axis) in glomeruli isolated from 427 individual kidney samples (Pearson’s correlation and P values shown). (J) Representative immunofluorescence staining of NLRP3 (red) and podocalyxin (green), and DAPI staining (blue) in kidney samples of APOL1 high-risk control and CKD patients. Scale bars: 30 μm. (K) Representative images of NLRP3 in situ hybridization in kidney of APOL1 high-risk control and CKD patients. The red arrows indicate the expression of APOL1 mRNA. Scale bars: 30 μm. Student’s t test based on Pearson’s correlation coefficient was used to calculate the statistical significance of the association.

References

    1. Beckerman P, Susztak K. APOL1: the balance imposed by infection, selection, and kidney disease. Trends Mol Med. 2018;24(8):682–695. doi: 10.1016/j.molmed.2018.05.008. - DOI - PMC - PubMed
    1. Norton JM, et al. Social determinants of racial disparities in CKD. J Am Soc Nephrol. 2016;27(9):2576–2595. doi: 10.1681/ASN.2016010027. - DOI - PMC - PubMed
    1. Genovese G, et al. Association of trypanolytic ApoL1 variants with kidney disease in African Americans. Science. 2010;329(5993):841–845. doi: 10.1126/science.1193032. - DOI - PMC - PubMed
    1. Bajaj A, et al. Phenome-wide association analysis suggests the APOL1 linked disease spectrum primarily drives kidney-specific pathways. Kidney Int. 2020;97(5):1032–1041. doi: 10.1016/j.kint.2020.01.027. - DOI - PMC - PubMed
    1. Freedman BI, et al. APOL1 at 10 years: progress and next steps. Kidney Int. 2021;99(6):1296–1302. doi: 10.1016/j.kint.2021.03.013. - DOI - PMC - PubMed

Publication types