. 2021 Oct 15;131(20):e129466.
doi: 10.1172/JCI129466.

Combined presentation and immunogenicity analysis reveals a recurrent RAS.Q61K neoantigen in melanoma

Affiliations

Combined presentation and immunogenicity analysis reveals a recurrent RAS.Q61K neoantigen in melanoma

Aviyah Peri et al. J Clin Invest. .

Abstract

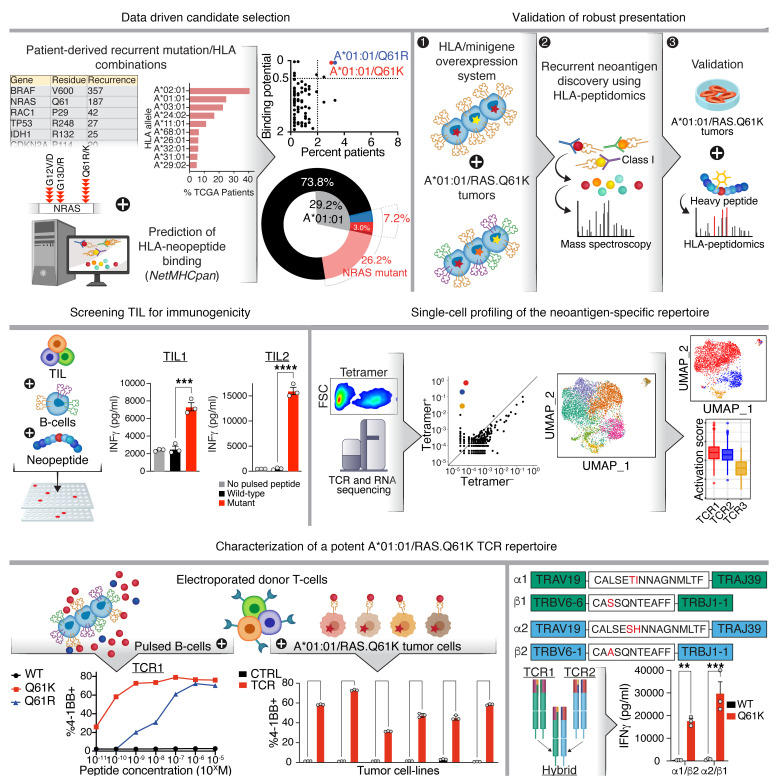
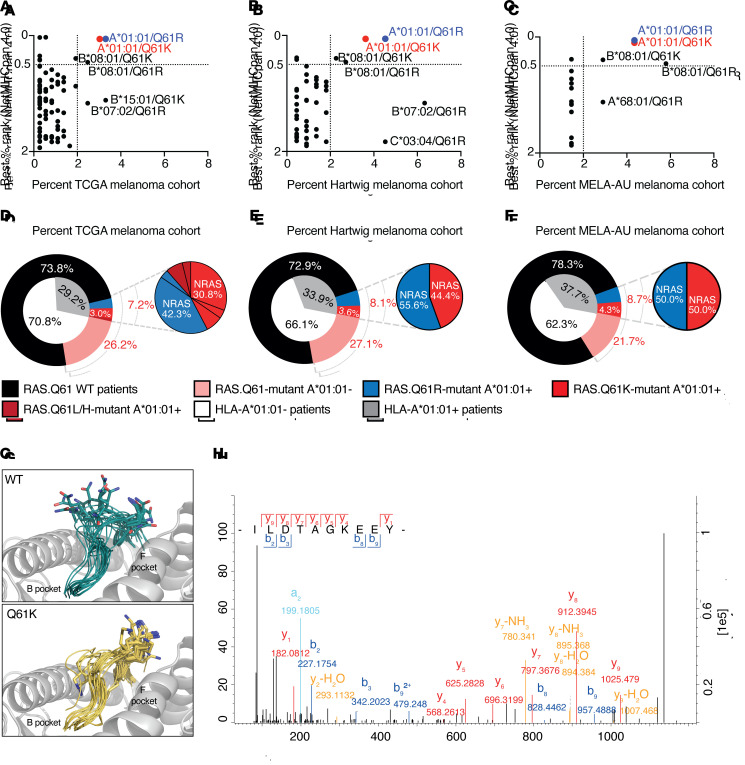
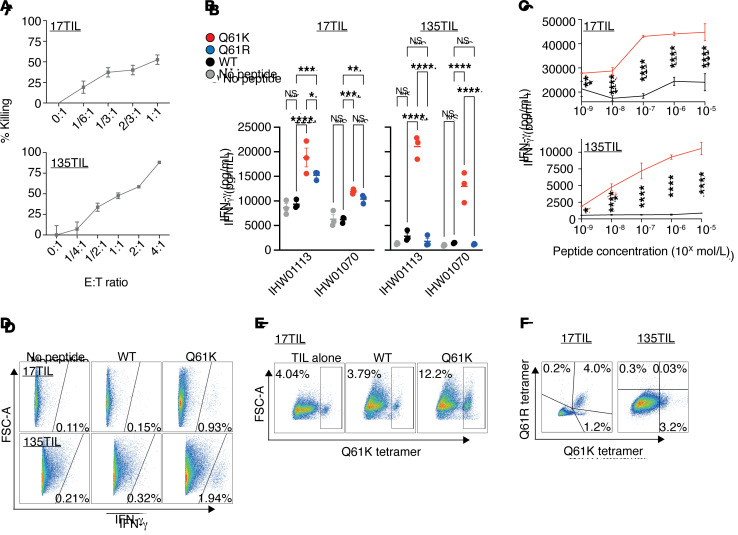
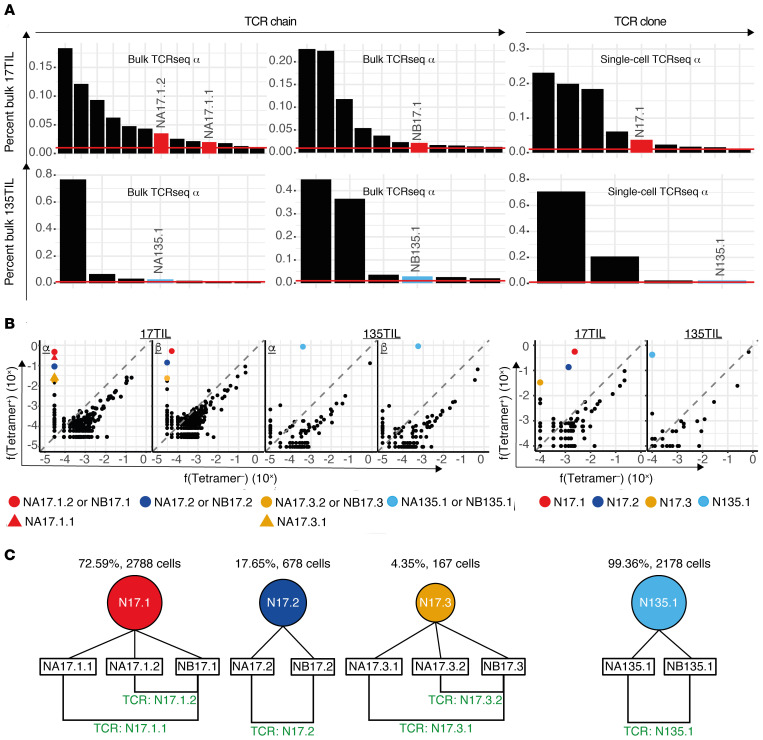
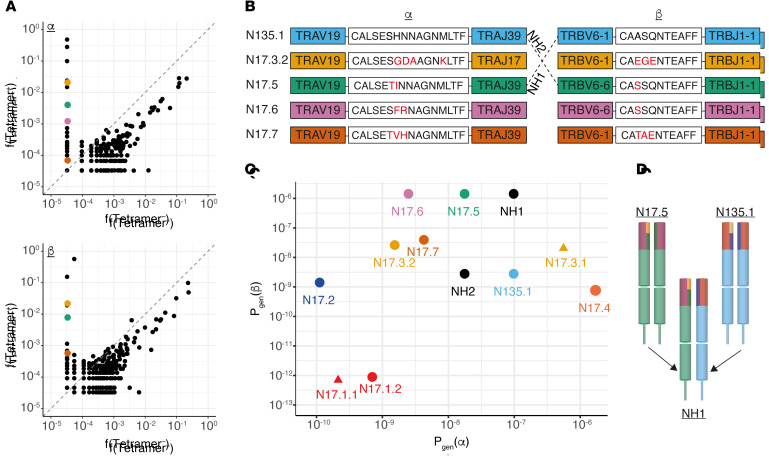
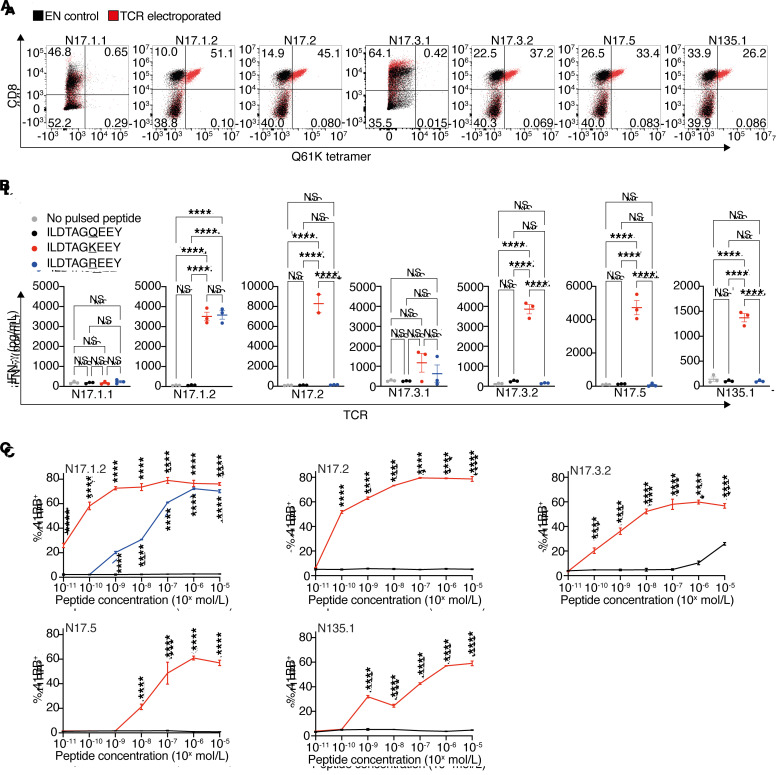
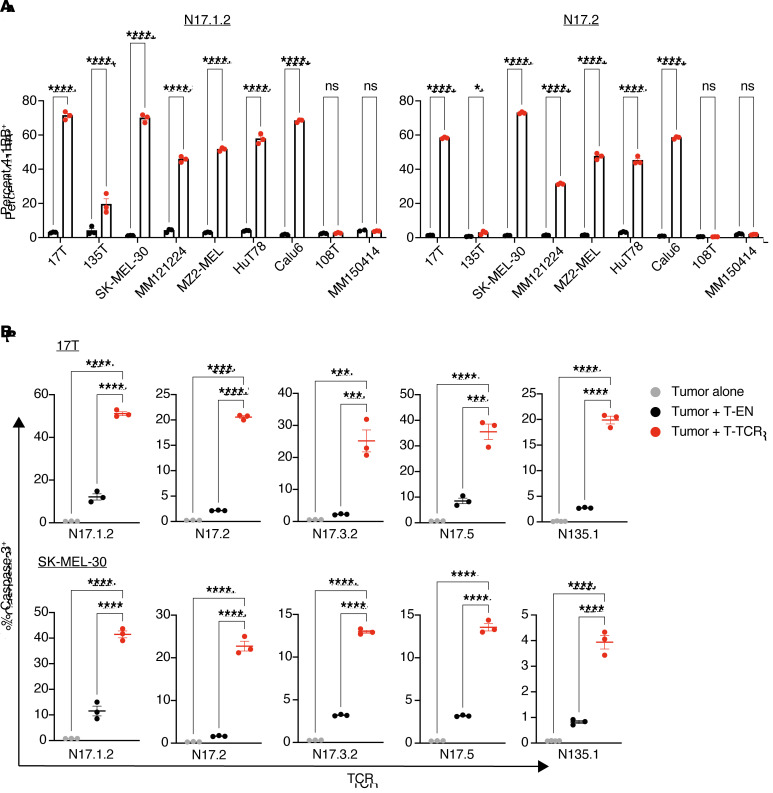
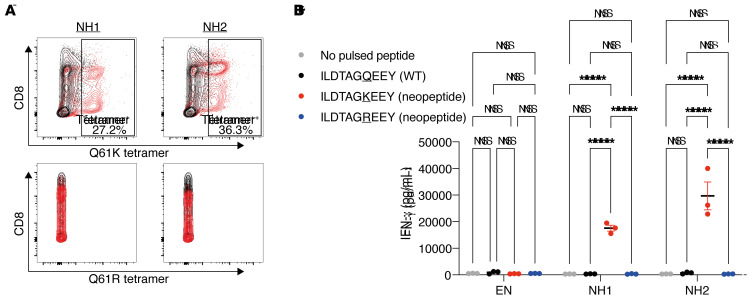
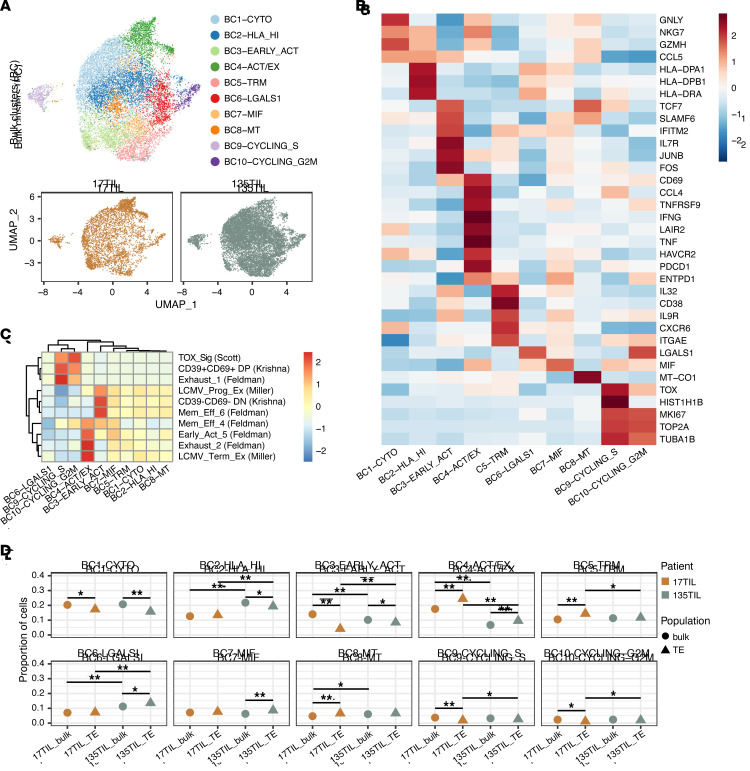
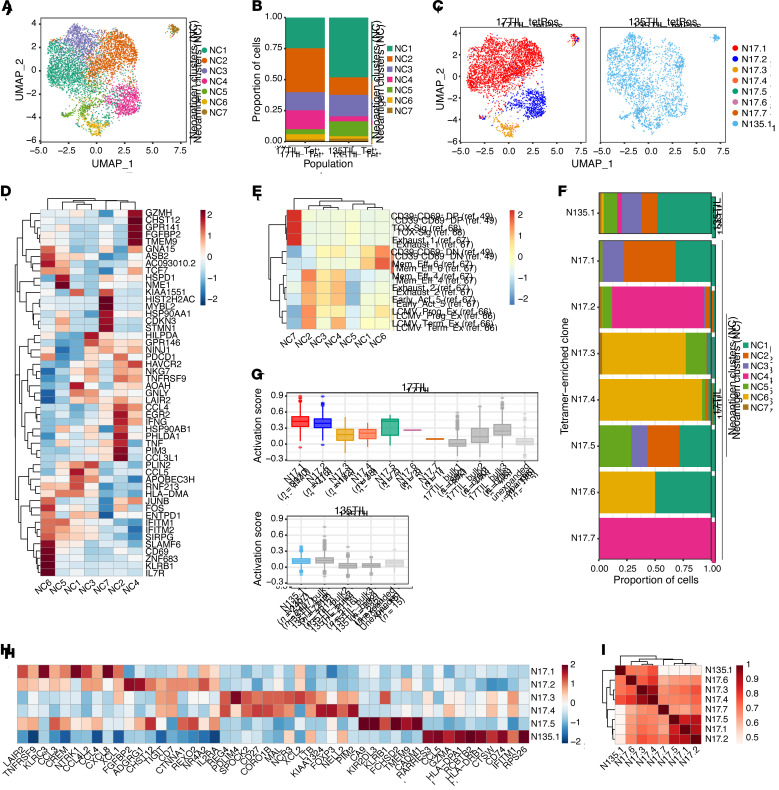
Neoantigens are now recognized drivers of the antitumor immune response. Recurrent neoantigens, shared among groups of patients, have thus become increasingly coveted therapeutic targets. Here, we report on the data-driven identification of a robustly presented, immunogenic neoantigen that is derived from the combination of HLA-A*01:01 and RAS.Q61K. Analysis of large patient cohorts indicated that this combination applies to 3% of patients with melanoma. Using HLA peptidomics, we were able to demonstrate robust endogenous presentation of the neoantigen in 10 tumor samples. We detected specific reactivity to the mutated peptide within tumor-infiltrating lymphocytes (TILs) from 2 unrelated patients, thus confirming its natural immunogenicity. We further investigated the neoantigen-specific clones and their T cell receptors (TCRs) via a combination of TCR sequencing, TCR overexpression, functional assays, and single-cell transcriptomics. Our analysis revealed a diverse repertoire of neoantigen-specific clones with both intra- and interpatient TCR similarities. Moreover, 1 dominant clone proved to cross-react with the highly prevalent RAS.Q61R variant. Transcriptome analysis revealed a high association of TCR clones with specific T cell phenotypes in response to cognate melanoma, with neoantigen-specific cells showing an activated and dysfunctional phenotype. Identification of recurrent neoantigens and their reactive TCRs can promote "off-the-shelf" precision immunotherapies, alleviating limitations of personalized treatments.

Keywords: Antigen; Genetics; MHC class 1; Melanoma; Oncology.


Conflict of interest statement

Conflict of interest: RAS has received fees for professional services from Evaxion, Provectus Biopharmaceuticals Australia, Qbiotics, Novartis, Merck Sharp & Dohme, NeraCare, AMGEN Inc., Bristol-Myers Squibb, Myriad Genetics, and GlaxoSmithKline. YS, AP, EG, MA, SRZ, and NF are inventors on a patent titled “Identification of recurrent mutated neopeptides” (WO2020/234875) and “TCRS directed at RAS-derived recurrent neoantigens” (Israeli patent application no. 282814).

Figures

Figure 1
Figure 1. Recurrent neoantigen discovery pipeline.
Data-driven analysis of cancer patient cohorts was used to select high-recurrence RAS.Q61/HLA allele combinations that were predicted to yield neoantigens, with HLA-A*01:01/RAS.Q61 heading the list. Robust neoantigen presentation was corroborated and quantified via HLA peptidomics using a panel of tumor samples with endogenous expression. Specific reactivity was identified within TILs from 2 unrelated patients, thus validating the immunogenicity of the neoantigen. Tetramer-specific cells were TCR- and RNA-sequenced at the single-cell level, allowing transcriptional profiling of neoantigen-specific clones. A repertoire of sensitive and specific TCRs were characterized, with striking intra- and interpatient TCR sequence similarity between clones. Parts of Figure 1 were created using BioRender.com.
Figure 2
Figure 2. From data-driven candidate selection to verification of presentation.
(AC) Percentage of patients with HLA/RAS.Q61 combination in cohorts of patients with melanoma (x axis) and NetMHCpan 4.0 binding predictions Best%Rank (y axis). %Rank≤0.5 were considered strong binders; 0.5<%Rank≤2 were considered weak binders. (A) TCGA, (B) Hartwig, (C) MELA-AU melanoma cohorts. (DF) Frequency of A*01:01/RAS.Q61-mutant combinations in melanoma cohorts. (D) TCGA, (E) Hartwig, (F) MELA-AU melanoma cohorts. (G) Predicted structures of A*01:01 in complex with RAS peptides. Gray indicates HLA; turquoise indicates ILDTAGQEEY (WT); yellow indicates ILDTAGKEEY (mutant, RAS.Q61K). The peptide backbones are represented as ribbons, with P7 residue (position 61) side-chain atoms shown. Hydrogens were omitted for clarity. (H) Tandem mass spectra of ILDTAGKEEY as it was identified in HLA peptidomics of the melanoma cell line 17T, endogenously expressing HLA-A*01:01/NRAS.Q61K. Method: Fourier transform mass spectrometry (FTMS); higher-energy collisional dissociation (HCD) score: 91.55; m/z: 569.79. Peptide identification was further validated in 2 separate targeted MS repeats.
Figure 3
Figure 3. A*01:01/ILDTAGKEEY is immunogenic.
(A) Bulk TILs were able to kill cognate melanoma in a fluorescent cell in vitro–killing assay. The fluorescently labeled melanoma cell line 17T was coincubated with IHW01161 and the cell line 135T was coincubated with IHW01070. Error bars represent the SEM of biological triplicates. (B and C) Bulk TILs were specifically reactive toward the neoantigen. TILs were coincubated with minimal epitope–pulsed A*01:01+ B-LCLs. (B) IFN-γ ELISA results. Error bars represent the SEM of biological triplicates; 2-way ANOVA with Tukey’s correction for multiple comparisons. (C) IFN-γ ELISA peptide titration assay with 17TIL (IHW0116) and 135TIL (IHW01070). Plots show the mean with SD of biological triplicates; 2-way ANOVA with Sidak’s correction for multiple comparisons. (DF) Delineation of the neoantigen-specific subpopulations. (D) IFN-γ secretion assay of the melanoma cells 17TIL (coincubatad with peptide-pulsed IHW01161 cells) and 135TIL (coincubated with peptide-pulsed IHW01070 cells). P < 0.00001, by χ2 for both. (E) Differential expansion of 17TILs in response to coincubation with B-LCL IHW01161 and either the WT or mutant peptide. P < 0.00001, by χ2 test. (F) CD8+ gated TILs double-stained with the Q61K and Q61R tetramers. FSC-A, forward scatter area. *P < 0.05, **P < 0.01, ***P < 0.001, and ****P < 0.0001.
Figure 4
Figure 4. Combined bulk and single-cell TCR sequencing identifies a repertoire of neoantigen-specific TCRs.
(A) 17TIL and 135TIL had oligoclonal distributions. Frequency distributions for bulk 17TIL (top) and 135TIL (bottom) are shown. Left panel: TCR α and β chain frequencies from bulk TCR sequencing of CD4 bulk populations. Right panel: Single-cell TCR sequencing of CD8+ bulk populations. Only chains/clones with a frequency of at least 1% are depicted. A representative result of 3 replicates is shown for the bulk TCR sequencing. (B) Tetramer+ versus tetramer frequencies (f). Only TCR chains/clones that were enriched in the tetramer+ population (i.e., tetramer+/tetramer >> 1) were considered tetramer specific and potentially neoantigen specific. Left panel: Bulk TCR sequencing α and β chains (a representative result of 3 replicates is shown). Right panel: Single-cell TCR sequencing. For validation, we focused on the TCRs that were greater than 100-fold tetramer+-enriched and made up at least 1% of the tetramer+ repertoire (see colored TCR chains/clones). (C) Nomenclature for the leading neoantigen-specific clones in 17TIL and 135TIL and their derived TCRs.
Figure 5
Figure 5. N135.1 TCR similarity cluster within 17TIL converges on both α and β chains.
Inspection of the 17TIL repertoire revealed a cluster of 4 TCRs that were similar to N135.1: N17.3.2, N17.5, N17.6, and N17.7. The top most frequent TCRs on this list, N17.3.2 and N17.5, were validated as potent and neoantigen specific (see Figures 6 and 7). (A) Both α and β chains for the similarity cluster were enriched in the tetramer+ subpopulation. α/β Pairings were confirmed by single-cell TCR sequencing. Representative data (replicate 1 of 3) from bulk TCR sequencing. (B) Sequence comparison of the TCRs’ variable regions. Note the Hamming distance of up to 4 amino acids and the similarity of the V/J genes. (C) TCRs were plotted according to the Pgen of their α (x axis) and β chains (y axis). NH1 (NRAS hybrid TCR no. 1) combines the most probable α/β within the similarity cluster; it was generated through chain swapping between N135.1 and N17.5. NH2 is the counterpart to NH1, mixing NA17.5 with NB135.1. (D) Illustration of the chain swapping generating NH1, combining NA135.1 with NB17.5.
Figure 6
Figure 6. A repertoire of potent neoantigen-specific TCRs.
Healthy donor T cells were electroporated with in vitro–transcribed TCR α and β chains. (A) Flow cytometric plots of A*01:01/ILDTAGKEEY-tetramer–stained cells. Negative controls were cells electroporated without mRNA (EN, electroporated nothing). (B and C) Electroporated T cells were coincubated overnight with peptide-pulsed IHW01161 cells. (B) IFN-γ ELISA with 10 μM peptide. ****P < 0.0001, by 1-way ANOVA with Tukey’s correction for multiple comparisons. Error bars represent the SEM of biological triplicates. (C) 4-1BB peptide titration assay. Plots show the mean with SD of biological triplicates. ****P < 0.0001, by 2-way ANOVA with Sidak’s correction for multiple comparisons.
Figure 7
Figure 7. Neoantigen-specific TCRs convey reactivity and cytotoxic capacity toward tumor cells that endogenously express the neoantigen.
Healthy donor T cells were electroporated with in vitro–transcribed TCR α and β chains and coincubated with tumor-derived cell lines. Donor cells electroporated without mRNA were used as T cell negative controls. (A) Percentage of T cells expressing the activation marker 4-1BB after an overnight 1:1 coincubation; 17T, 135T, SK-MEL-30, MM121224 and MZ2-MEL are all melanoma cell lines endogenously expressing HLA-A*01:01/NRAS.Q61K. HuT78 is a T cell lymphoma cell line that endogenously expresses HLA-A*01:01/NRAS.Q61K. Calu6 is a lung adenocarcinoma cell line that endogenously expresses HLA-A*01:01/KRAS.Q61K. Negative control cell lines: 108T (A*01:01+/NRAS WT); MM150414 (A*01:01/NRAS.Q61K). See Methods for further information on the cell lines. *P < 0.05 and ****P < 0.0001, by 2-way ANOVA with Sidak’s correction for multiple comparisons. (B) Cleaved caspase-3 killing assay: percentage of 17T (top) and SK-MEL-30 (bottom) tumor cells expressing cleaved caspase-3 after a 3-hour coincubation at a 3:1 effector/target ratio. ***P < 0.001 and ****P < 0.0001, by 1-way ANOVA with Tukey’s correction for multiple comparisons. Error bars represent the SEM of biological triplicates throughout.
Figure 8
Figure 8. α/β Chain-swapping within the TCR similarity cluster perserves neoantigen specificity.
Donor T cells were electroporated with in vitro–transcribed TCR α and β chains to express NH1 and NH2. Donor cells electroporated without mRNA (EN) were used as T cell negative controls. (A) Flow cytometric analysis of anti-CD8– and tetramer-stained cells. (B) IFN-γ ELISA after overnight 1:1 coincubation with IHW01161-presenting cells, pulsed with the WT or mutant peptides. IHW01161 without pulsed peptide (DMSO only) served as a negative control. Error bars represent the SEM of biological triplicates. ****P < 0.0001, by 2-way ANOVA with Tukey’s correction for multiple comparisons.
Figure 9
Figure 9. Unsupervised clustering of bulk TILs.
Tetramer-enriched clones showed increased exhaustion and decreased early-activation proportions compared with bulk TILs. (A) UMAP of cells from bulk-sorted populations colored by phenotype cluster (top). UMAP of cells from each patient sample (bottom). (B) Heatmap depicting gene expression of select cluster markers and canonical T cell subset marker genes across the phenotypic clusters identified. (C) Gene expression module scoring of clusters with previously published CD8+ T cell gene sets (select signatures from ref. 43). (D) Comparison of phenotypic proportions among 17TIL and 135TIL bulk and tetramer+ populations. *P < 0.05 and **P < 0.001, by χ2 test.
Figure 10
Figure 10. Contrasting tetramer-specific clones reveals transcriptional clonal segregation.
(A) UMAP of cells from tetramer+ populations colored by phenotype cluster. (B) Distribution of cells across clusters within each patient sample. Tet+, tetramer+. (C) UMAP of cells from each patient sample colored by tetramer-enriched clone identity. tetPos, tetramer+. (D) Heatmap depicting gene expression of select cluster markers and canonical T cell subset marker genes across the phenotypic clusters identified. (E) Gene expression module scoring of tetramer+ clusters with previously published CD8+ T cell gene sets (select signatures from ref. and refs. –68). (F) Distribution of cells across phenotype clusters within each tetramer-enriched clone. (G) Comparison of T cell activation scores (from ref. 50) between each tetramer-enriched clone, other highly expanded clones in the bulk population, and all other unexpanded clones. The number of cells in each clone or group is indicated. (H) Gene signatures of each tetramer-enriched clone (for clones with >5 cells). (I) Spearman correlation of tetramer-enriched clones based on clone-specific gene signatures as defined in H.

References

    1. Tran E, et al. “Final common pathway” of human cancer immunotherapy: targeting random somatic mutations. Nat Immunol. 2017;18(3):255–262. - PMC - PubMed
    1. Gubin MM, et al. Checkpoint blockade cancer immunotherapy targets tumour-specific mutant antigens. Nature. 2014;515(7528):577–581. - PMC - PubMed
    1. Tumeh PC, et al. PD-1 blockade induces responses by inhibiting adaptive immune resistance. Nature. 2014;515(7528):568–571. - PMC - PubMed
    1. Robbins PF, et al. Mining exomic sequencing data to identify mutated antigens recognized by adoptively transferred tumor-reactive T cells. Nat Med. 2013;19(6):747–752. - PMC - PubMed
    1. Lu YC, et al. Efficient identification of mutated cancer antigens recognized by T cells associated with durable tumor regressions. Clin Cancer Res. 2014;20(13):3401–3410. - PMC - PubMed

Publication types

MeSH terms