. 2021 Oct 15:10:e69056.
doi: 10.7554/eLife.69056.

Regulatory T-cells inhibit microglia-induced pain hypersensitivity in female mice

Affiliations

Regulatory T-cells inhibit microglia-induced pain hypersensitivity in female mice

Julia A Kuhn et al. Elife. .

Abstract

Peripheral nerve injury-induced neuropathic pain is a chronic and debilitating condition characterized by mechanical hypersensitivity. We previously identified microglial activation via release of colony-stimulating factor 1 (CSF1) from injured sensory neurons as a mechanism contributing to nerve injury-induced pain. Here, we show that intrathecal administration of CSF1, even in the absence of injury, is sufficient to induce pain behavior, but only in male mice. Transcriptional profiling and morphologic analyses after intrathecal CSF1 showed robust immune activation in male but not female microglia. CSF1 also induced marked expansion of lymphocytes within the spinal cord meninges, with preferential expansion of regulatory T-cells (Tregs) in female mice. Consistent with the hypothesis that Tregs actively suppress microglial activation in females, Treg deficient (Foxp3DTR) female mice showed increased CSF1-induced microglial activation and pain hypersensitivity equivalent to males. We conclude that sexual dimorphism in the contribution of microglia to pain results from Treg-mediated suppression of microglial activation and pain hypersensitivity in female mice.

Keywords: CSF1; Treg; meninges; microglia; mouse; neuroscience; pain; spinal cord.


Conflict of interest statement

JK Patent approved on use of CSF1 blockade to treat neuropathic pain (Publication Number WO/2016/057800). IV, JB, KH, MB, VC, MD, JO, AM, AM No competing interests declared, AB Reviewing editor, eLife

Figures
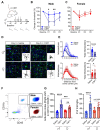
Figure 1.
Figure 1.. CSF1 induces pain hypersensitivity and microglial activation in male but not female mice.
(A) Schematic depicting 3 days of CSF1 intrathecal injection (i.t.) paradigm with von Frey assay. (B, C) Change in mechanical pain threshold in males and females after saline or CSF1 injection. N=5–7 mice per condition, repeated measures ANOVA. (D) Representative immunohistochemistry of lumbar spinal cord sections after 3 days of CSF1 i.t. injection. Insets indicate single microglia and binary images used for subsequent quantifications. Scale bar=50 µm. (E) Ramification calculated by Scholl analysis in males (blue, top) and females (red, bottom). N=3 mice/condition, 25 cells/group; dots represent individual microglia, Student’s t-test. (F) Representative flow cytometry plot demonstrating right-shift of the CD11b+/CD45+ population in lumbar spinal cord. Insets indicate microglia population gated on CD11b+CD45+Ly-6C. (G) Microglial activation index calculated from flow-cytometry data as a sum of mean fluorescence intensity of CD11b and CD45 fluorescence intensity. Dots represent individual mice. One-way ANOVA with Tukey’s multiple comparisons. (H) Microglial numbers calculated by flow cytometry data. Dots represent individual mice. One-way ANOVA with Tukey’s multiple comparisons. *p<0.05, **p<0.01, ***p<0.001, ****p<0.0001. CSF1, colony-stimulating factor 1.
Figure 1—figure supplement 1.
Figure 1—figure supplement 1.. CSF1 deletion in sensory neurons rescues pain in male but not female mice.
(A) Schematic and von Frey assay for AvilCre:Csf1fl/fl at day 7 after peripheral nerve injury. Dots represent individual mice, unpaired Student’s t-test. (B) Full-time course of data summarized in (A). (C) Mechanical hypersensitivity after high dose (30 ng) CSF1 (N=4 mice/group). (D) Flow cytometry plot for CD11b and CD45 highlighting male and female microglia in the naïve and CSF1 group. One representative mouse per condition is shown. N=5 mice per group. CSF1, colony-stimulating factor 1; SNI, spared nerve injury.
Figure 2.
Figure 2.. CSF1 promotes immune activation in male but not female microglia.
(A) Principal component analysis of genes expressed by microglia isolated by flow cytometry from male and female mice after 3 days of saline or CSF1 i.t. Dots represent individual mice. (B) Number of differentially expressed genes (DEGs) per comparison (adjusted p-value<0.01). (C) Heatmap of DEGs in male and female microglia after CSF1 overlaid with microglia activation modules curated by Friedman et al., 2018. (D) Four-way plot depicting DEGs (adjusted p-values<0.01) that are male-specific (blue), female-specific (red), or male-female shared (green). Inset highlights gene ontology terms identified in the respective categories. CSF1, colony-stimulating factor 1; i.t., intrathecal injection.
Figure 2—figure supplement 1.
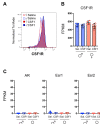
Figure 2—figure supplement 1.. Male and female microglia express equal levels of the CSF1 receptor.
(A) Histogram of CSF1R expression on microglia for each condition by flow cytometry. One representative trace per condition. Original data from n=3 mice per group. (B) CSF1R mRNA expression in microglia as determined by RNA sequencing. Each dot represents one mouse. N=4 mice/group. CSF1, colony-stimulating factor 1; FPKM, fragments per kilobase of transcript per million.
Figure 3.
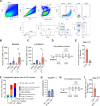
Figure 3.. Regulatory T-cells restrict microglial activation and pain behavior in female mice.
(A) Schematic of spinal cord meninges. (B) UMAP plot of lymphoid, non-myeloid cells (CD45+CD11b) isolated from spinal cord meninges. Image is a pool of all samples colored by cell type specific markers as indicated. Bar graph shows fold-change in indicated populations in males and females after CSF1. Dots in bar graph: individual samples. N=5 mice per group. (C) Quantification of regulatory T-cells (Tregs; CD4+FoxP3+) from (B). (D) Principal component analysis (PCA) of microglial gene expression profiles in select conditions. Red=female, blue=male, green=Treg deficient female (FoxP3DTR). Dots: individual mice. PCA consists of two experiments. The first experiment is depicted in Figure 2A and complemented with a second experiment consisting of WT females with CSF1 and Treg deficient females treated with CSF1. (E) Volcano plot depicting DEGs (adjusted p-values<0.05; green) between female Treg KO mice after CSF1 versus female mice after CSF1. N=4 mice per group. (F) Gene ontology terms for upregulated and downregulated genes from volcano plot in (E). (G) Schematic depicting the approach of using Rag1 KO mice (no T/B cells), antibody against CD4 (aCD4) to deplete T-cells and FoxP3DTR mice, in which Tregs are depleted using diphtheria toxin. (H, I) Change in mechanical hypersensitivity at day 3 after i.t. CSF1 in WT female mice (data from day 3, Figure 1B) or in females lacking regulatory T-cells (FoxP3DTR). Dots: individual mice. (J) Change in mechanical hypersensitivity at day three after CSF1 i.t. in Rag1−/. Dots: individual mice. (K) Change in mechanical hypersensitivity at day 3 after CSF1 in female mice injected with a CD4 blocking antibody 1 day prior to CSF1 injections. Dots: individual mice. In (I–K) unpaired two-tailed t-test and (C) one-way ANOVA with Tukey’s multiple testing correction. *p<0.05, **p<0.01, ****p<0.0001. DEG, differentially expressed gene; WT, wild-type.
Figure 3—figure supplement 1.
Figure 3—figure supplement 1.. Isolation and depletion of meningeal immune cells.
(A) Flow cytometry gating strategy for spinal cord meningeal immune cells. (B, C) Quantification of myeloid and non-myeloid cells after three daily CSF1 i.t or saline injections. N=4–5 mice/group. Numbers: fold expansion in females after CSF1 over females with saline. (D) Schematic depicting the approach to deplete Tregs in combination with CSF1 injections. (E) Tregs in the SC meninges with and without depletion at day 3. Each dot represents one mouse. (F) Results of microglial sequencing, showing the upregulated ‘neurodegeneration’ related genes from per Friedman et al., 2018. Common genes are upregulated in male and female microglia after Treg depletion (red), as well as genes unique to Treg depletion in females (dark blue). (G) Change in mechanical hypersensitivity at day 3 after i.t. CSF1 in WT males and in males lacking regulatory T-cells (FoxP3DTR). Dots: individual mice. (H) Schematic depicting depletion of CD4+ T-cells in combination with CSF1 injections. (I) CD4+ T-cells in the SC meninges after CSF1, with and without CD4+ depletion at day 3. Each dot represents one mouse. CSF1, colony-stimulating factor 1; i.t., intrathecal injection; WT, wild-type.
Figure 3—figure supplement 2.
Figure 3—figure supplement 2.. T-cells are rarely detected 7 days post SNI.
Representative immunohistochemistry of lumbar spinal cord sections for Iba1, CD45, and CD3 showing minimal to no T-cell infiltration 7 days after SNI. Scale bar=100 µm. SNI, spared nerve injury.
Author response image 1.
Author response image 1.. Inducing Treg proliferation with IL2/IL2RA alters mechanical withdrawal thresholds in male mice.
(A:) Schematic showing the timeline to increase Treg proliferation in mice prior to intrathecal CSF1 injections. (B:) Change in mechanical withdrawal threshold in male control and IL2/IL2RA injected mice before and after 3 days of CSF1 i.t. All thresholds are normalized to baseline thresholds prior to IL2/IL2RA treatment.

Comment in

  • Why sex matters.
    Wlaschin JJ, Hareendran S, Le Pichon CE. Wlaschin JJ, et al. Elife. 2021 Dec 2;10:e74935. doi: 10.7554/eLife.74935. Elife. 2021. PMID: 34854810 Free PMC article.

References

    1. Ali N, Zirak B, Rodriguez RS, Pauli ML, Truong HA, Lai K, Ahn R, Corbin K, Lowe MM, Scharschmidt TC, Taravati K, Tan MR, Ricardo-Gonzalez RR, Nosbaum A, Bertolini M, Liao W, Nestle FO, Paus R, Cotsarelis G, Abbas AK, Rosenblum MD. Regulatory T cells in skin facilitate epithelial stem cell differentiation. Cell. 2017;169:1119–1129. doi: 10.1016/j.cell.2017.05.002. - DOI - PMC - PubMed
    1. Alves de Lima K, Rustenhoven J, Kipnis J. Meningeal immunity and its function in maintenance of the central nervous system in health and disease. Annual Review of Immunology. 2020;38:597–620. doi: 10.1146/annurev-immunol-102319-103410. - DOI - PubMed
    1. Anders S, Pyl PT, Huber W. HTSeq--a Python framework to work with high-throughput sequencing data. Bioinformatics. 2015;31:166–169. doi: 10.1093/bioinformatics/btu638. - DOI - PMC - PubMed
    1. Butovsky O, Weiner HL. Microglial signatures and their role in health and disease. Nature Reviews. Neuroscience. 2018;10:622–635. doi: 10.1038/s41583-018-0057-5. - DOI - PMC - PubMed
    1. Costigan M, Moss A, Latremoliere A, Johnston C, Verma-Gandhu M, Herbert TA, Barrett L, Brenner GJ, Vardeh D, Woolf CJ, Fitzgerald M. T-cell infiltration and signaling in the adult dorsal spinal cord is a major contributor to neuropathic pain-like hypersensitivity. The Journal of Neuroscience. 2009;29:14415–14422. doi: 10.1523/JNEUROSCI.4569-09.2009. - DOI - PMC - PubMed

Publication types

Substances

Associated data