. 2021 Oct 15;6(64):eabj2901.
doi: 10.1126/sciimmunol.abj2901. Epub 2021 Oct 15.

Early cross-coronavirus reactive signatures of humoral immunity against COVID-19

Affiliations

Early cross-coronavirus reactive signatures of humoral immunity against COVID-19

Paulina Kaplonek et al. Sci Immunol. .

Abstract

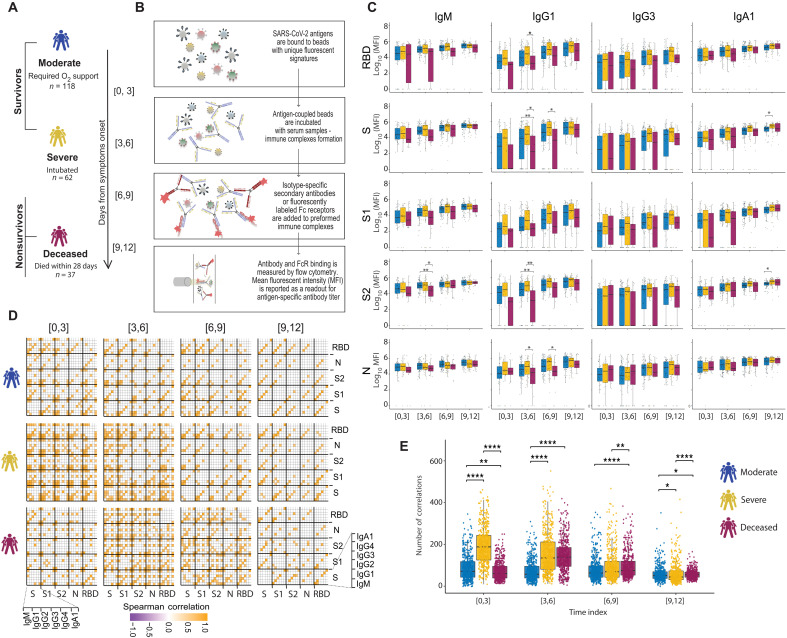
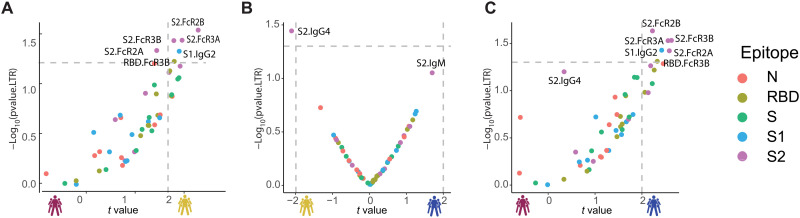
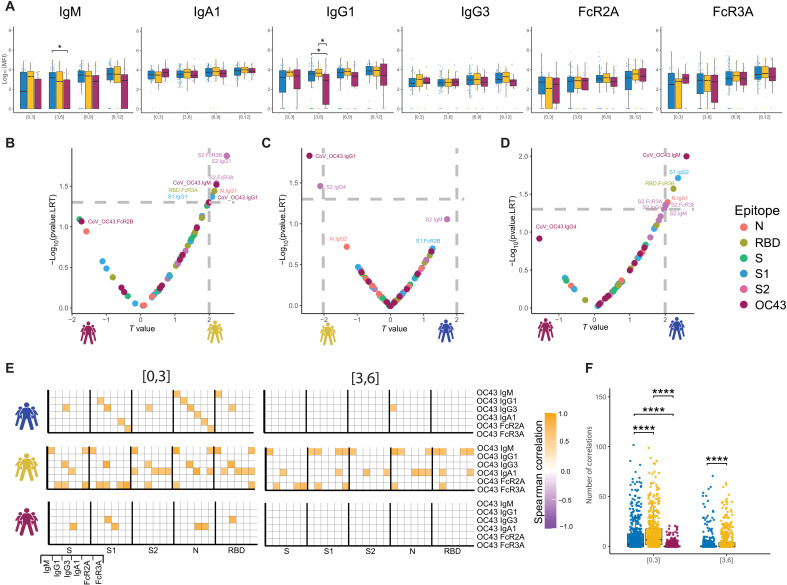
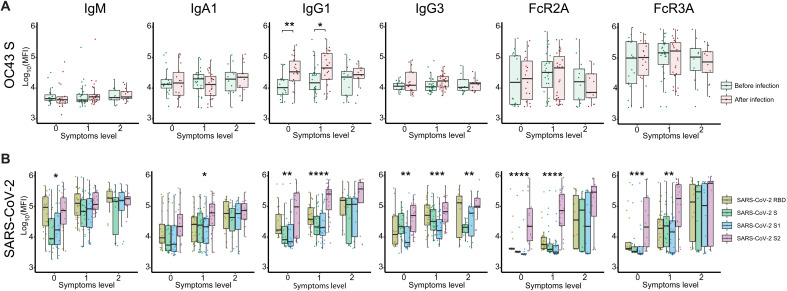
The introduction of vaccines has inspired hope in the battle against SARS-CoV-2. However, the emergence of viral variants, in the absence of potent antivirals, has left the world struggling with the uncertain nature of this disease. Antibodies currently represent the strongest correlate of immunity against SARS-CoV-2, thus we profiled the earliest humoral signatures in a large cohort of acutely ill (survivors and nonsurvivors) and mild or asymptomatic individuals with COVID-19. Although a SARS-CoV-2–specific immune response evolved rapidly in survivors of COVID-19, nonsurvivors exhibited blunted and delayed humoral immune evolution, particularly with respect to S2-specific antibodies. Given the conservation of S2 across β-coronaviruses, we found that the early development of SARS-CoV-2–specific immunity occurred in tandem with preexisting common β-coronavirus OC43 humoral immunity in survivors, which was also selectively expanded in individuals that develop a paucisymptomatic infection. These data point to the importance of cross-coronavirus immunity as a correlate of protection against COVID-19.


Figures

Fig. 1.
Fig. 1.. Evolution of early SARS-CoV-2–specific humoral immune responses after symptom onset across acutely ill patients with COVID-19.
(A) The cartoon shows the study groups on the basis of COVID-19 severity: 217 COVID-19–infected patients were sampled on days 0, 3, and 7 after admission to the hospital. Patients were classified into three groups on the basis of the maximal acuity within 28 days of enrollment. Moderate in blue: Hospitalized that required supplemental oxygen (n = 118). Severe in yellow: Intubation, mechanical ventilation, and survival to 28 days (n = 62). Deceased in purple: Death within 28 days (n = 37). On the basis the day of symptom onset, the samples were divided into four temporal groups: [0, 3], [3, 6], [6, 9], and [9, 12]. (B) A graphical summary of the Luminex assay. (C) The whisker plots show the distribution of antibody titers across moderate (blue), severe (yellow), and deceased (purple) over the study time course. The solid black line represents the median, and the box boundary (top and bottom) represents the first and third quartiles. The dots show the scaled values of each sample. A two-sample Wilcox test was used to evaluate statistical differences across groups for all the intervals and features. The P values were corrected from multiple hypothesis testing using the Benjamini-Hochberg procedure per each interval. Significance corresponds to adjusted P values (*P < 0.05 and **P < 0.01). (D) The correlation heatmap shows pairwise Spearman correlation matrices of SARS-CoV-2–specific antibody response across COVID-19 severity groups (moderate, severe, and deceased) for all four intervals. Correlation coefficients are shown only if they are larger than 0.6 and statistically significant after Benjamini-Hochberg correction for multiple hypothesis testing. Negative correlations are indicated in purple, and positive correlations are shown in orange. (E) The statistical evaluation of the effect of sample size. The Spearman correlation is calculated by randomly selected 10 samples per category for 500 runs. The number of statistically significant correlations (larger than 0.6) is calculated and tested by the Mann-Whitney U test. Significance corresponds to adjusted P values (*P < 0.05, **P < 0.01, and ****P < 0.0001). RBD, receptor binding domain; S, spike; S1 and S2, subunit 1 and 2 of the spike protein; N, nucleocapsid.
Fig. 2.
Fig. 2.. Selective enrichment of S2-specific responses across patients with COVID-19.
(A to C) Volcano plots of pairwise comparisons across pairs of each of the three groups highlight differences across groups controlling for age, body mass index, heart, lung, and kidney diseases. The volcano plots include comparisons of (A) individuals that passed away within 28 days (deceased) versus severe survivors, (B) individuals who experienced moderate disease versus severe survivors, and (C) individuals who ultimately passed away (deceased) versus individuals who developed moderate disease. The x axis represents the t value of the full model, and the y axis denotes the P values by likelihood ratio test comparing the null model and full model. The null/full model represents the association between each individual measurement (response) and all collected clinical information with/without disease severity (see Methods). The horizontal gray dashed line denotes the P value equals 0.05, and the vertical gray dashed line denotes a manually selected threshold (t values = 2).
Fig. 3.
Fig. 3.. The temporal evolution of the human OC43-specific humoral immune response.
(A) The whisker bar graphs show the distribution of human OC43 RBD–specific antibody titers and OC43-specific antibody mediated FcR binding profiles across moderate, severe, and nonsurvivor COVID-19 groups over the study time course. The solid black line represents the median and box boundary (top and bottom). (B to D) The volcano plots show the pairwise comparisons across the three COVID-19 severity groups: (B) individuals that passed away within 28 days (deceased) versus severe survivors, (C) individuals who experienced moderate disease versus severe survivors, and (D) individuals who ultimately passed away (deceased) versus individuals who developed moderate disease, including human OC43 RBD–specific humoral immune data. (E) The correlation heatmap shows the pairwise Spearman correlation matrices between OC43-specific and SARS-CoV-2 antibody levels across three COVID-19 severity groups (moderate, severe, and nonsurvivors) across the study time course. The correlation coefficients were shown only if statistically significant (adjusted P value < 0.05) after Benjamini-Hochberg correction from multiple hypothesis testing. (F) The statistical evaluation of the effect of sample size. The Spearman correlation is calculated by randomly selected 10 samples per category for 500 runs (the deceased group in day interval [3,6] is not included because the number of samples is less than 10). The number of statistically significant correlations (larger than 0.6) is calculated and tested by the Mann-Whitney U test. Significance corresponds to adjusted P values (*P < 0.05, and ****P < 0.0001).
Fig. 4.
Fig. 4.. SARS-CoV-2 S2–specific antibody functionality tracks with asymptomatic SARS-CoV-2 infection.
(A) The whisker box plots show the overall humoral immune response to OC43 RBD–spike titers across a community-based SARS-CoV-2 infection cohort divided by individuals that were asymptomatic (symptoms level 0) or experienced symptoms (symptoms level 1 or level 2, based on degree of symptoms) before and after infection. (B) The bar graphs illustrate the SARS-CoV-2–specific humoral immune response across the RBD, S, S1, and S2 antigens across the same community-based surveillance study divided by the degree of symptoms (symptoms levels). The dots show the scaled values of each sample. A two-sample Wilcox test was used to evaluate statistical differences across different epitopes for all the symptom categories. Significance corresponds to adjusted P values (*P < 0.05, **P < 0.01, ***P < 0.001, and ****P < 0.0001).

Update of

References

    1. Jackson L. A., Anderson E. J., Rouphael N. G., Roberts P. C., Makhene M., Coler R. N., McCullough M., Chappell J. D., Denison M. R., Stevens L. J., Pruijssers A. J., McDermott A., Flach B., Doria-Rose N. A., Corbett K. S., Morabito K. M., O'Dell S., Schmidt S. D., Swanson P. A. II, Padilla M., Mascola J. R., Neuzil K. M., Bennett H., Sun W., Peters E., Makowski M., Albert J., Cross K., Buchanan W., Pikaart-Tautges R., Ledgerwood J. E., Graham B. S., Beigel J. H.; mRNA-1273 Study Group , An mRNA vaccine against SARS-CoV-2 - Preliminary report. N. Engl. J. Med. 383, 1920–1931 (2020). - PMC - PubMed
    1. Knoll M. D., Wonodi C., Oxford-AstraZeneca COVID-19 vaccine efficacy. Lancet 397, 72–74 (2021). - PMC - PubMed
    1. Polack F. P., Thomas S. J., Kitchin N., Absalon J., Gurtman A., Lockhart S., Perez J. L., Pérez Marc G., Moreira E. D., Zerbini C., Bailey R., Swanson K. A., Roychoudhury S., Koury K., Li P., Kalina W. V., Cooper D., Frenck R. W. Jr, Hammitt L. L., Türeci Ö., Nell H., Schaefer A., Ünal S., Tresnan D. B., Mather S., Dormitzer P. R., Şahin U., Jansen K. U., Gruber W. C.; C4591001 Clinical Trial Group , Safety and efficacy of the BNT162b2 mRNA Covid-19 vaccine. N. Engl. J. Med. 383, 2603–2615 (2020). - PMC - PubMed
    1. Klingler J., Lambert G. S., Itri V., Liu S., Bandres J. C., Enyindah-Asonye G., Liu X., Oguntuyo K. Y., Amanat F., Lee B., Zolla-Pazner S., Upadhyay C., Hioe C. E., SARS-CoV-2 mRNA vaccines induce a greater array of spike-specific antibody isotypes with more potent complement binding capacity than natural infection. medRxiv 2021.05.11.21256972 (2021).
    1. Chen R. E., Zhang X., Case J. B., Winkler E. S., Liu Y., VanBlargan L. A., Liu J., Errico J. M., Xie X., Suryadevara N., Gilchuk P., Zost S. J., Tahan S., Droit L., Turner J. S., Kim W., Schmitz A. J., Thapa M., Wang D., Boon A. C. M., Presti R. M., O’Halloran J. A., Kim A. H. J., Deepak P., Pinto D., Fremont D. H., Crowe J. E. Jr., Corti D., Virgin H. W., Ellebedy A. H., Shi P. Y., Diamond M. S., Resistance of SARS-CoV-2 variants to neutralization by monoclonal and serum-derived polyclonal antibodies. Nat. Med. 27, 717–726 (2021). - PMC - PubMed

Publication types

Substances