. 2021 Oct 28;184(22):5635-5652.e29.
doi: 10.1016/j.cell.2021.09.018. Epub 2021 Oct 14.

Enhanced prime editing systems by manipulating cellular determinants of editing outcomes

Affiliations

Enhanced prime editing systems by manipulating cellular determinants of editing outcomes

Peter J Chen et al. Cell. .

Abstract

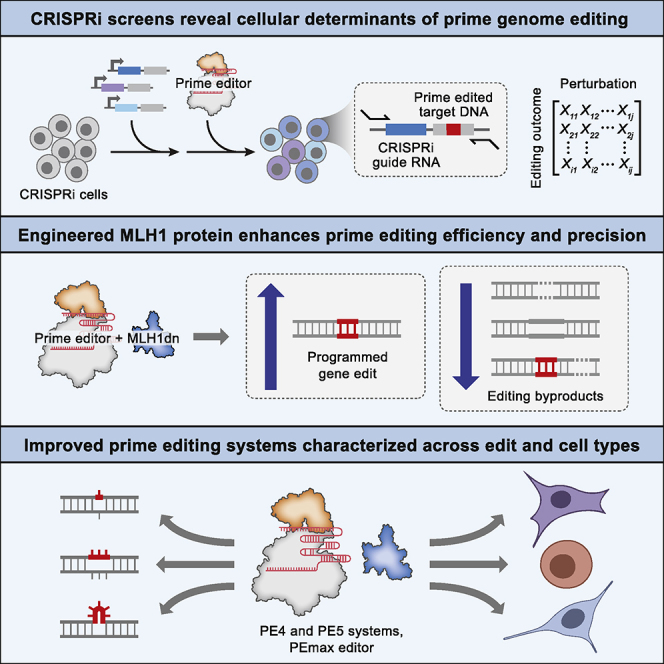
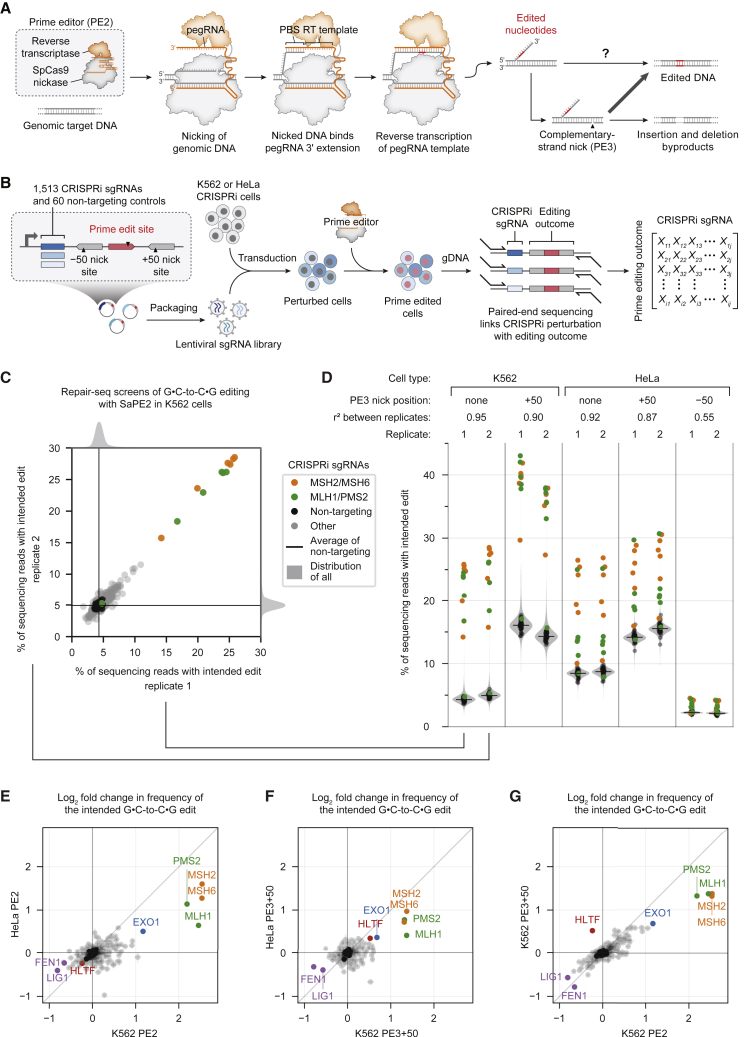
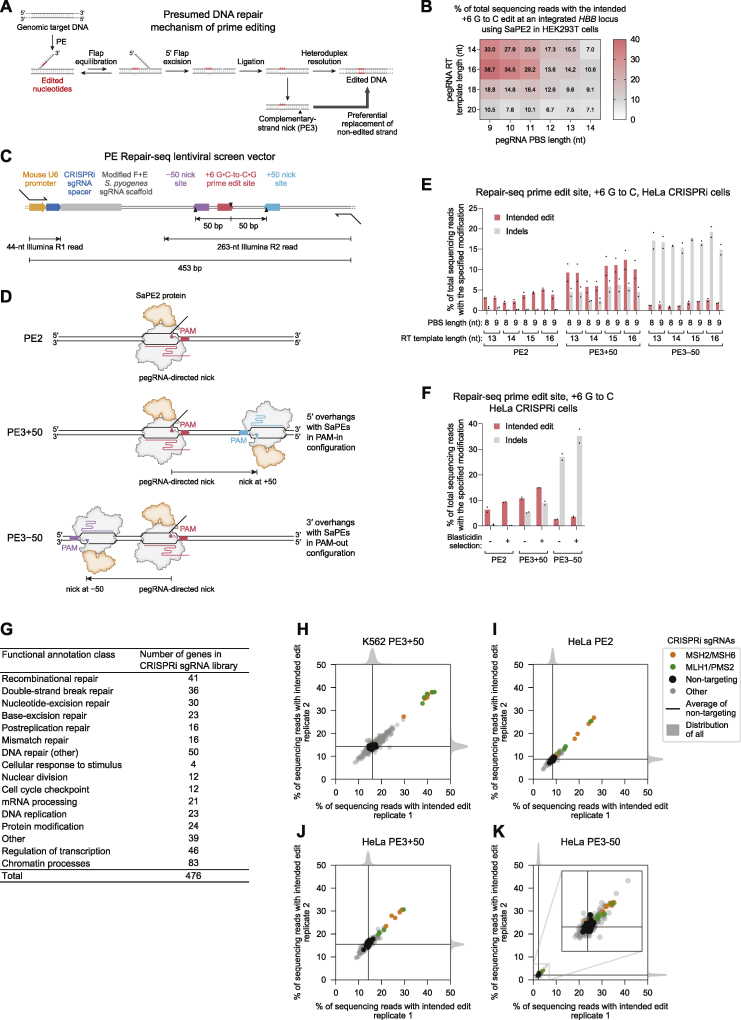
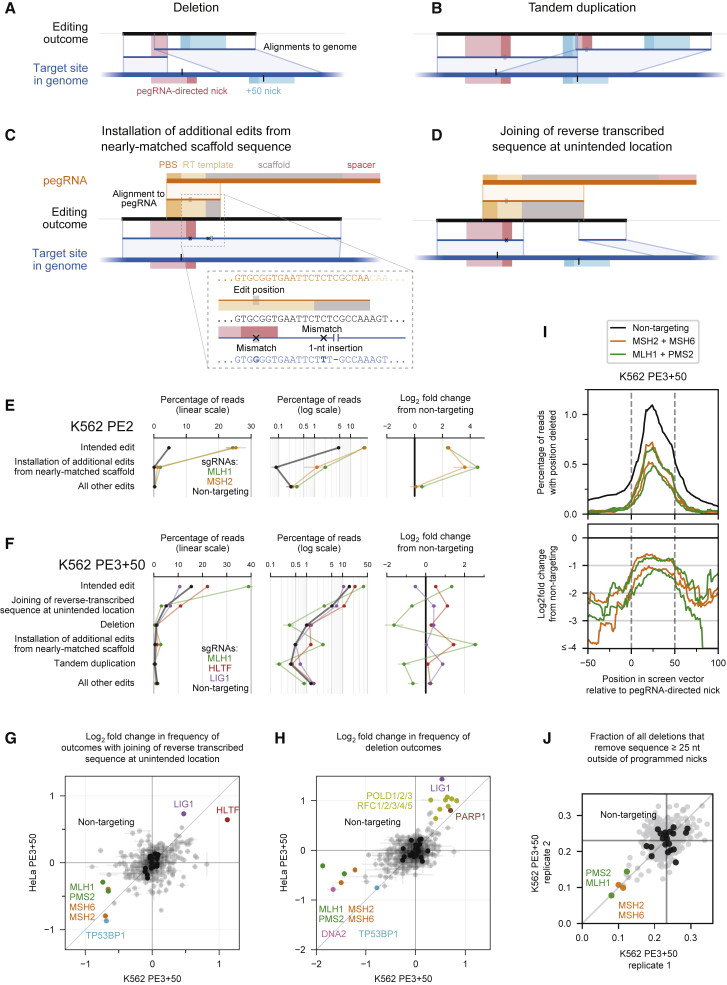
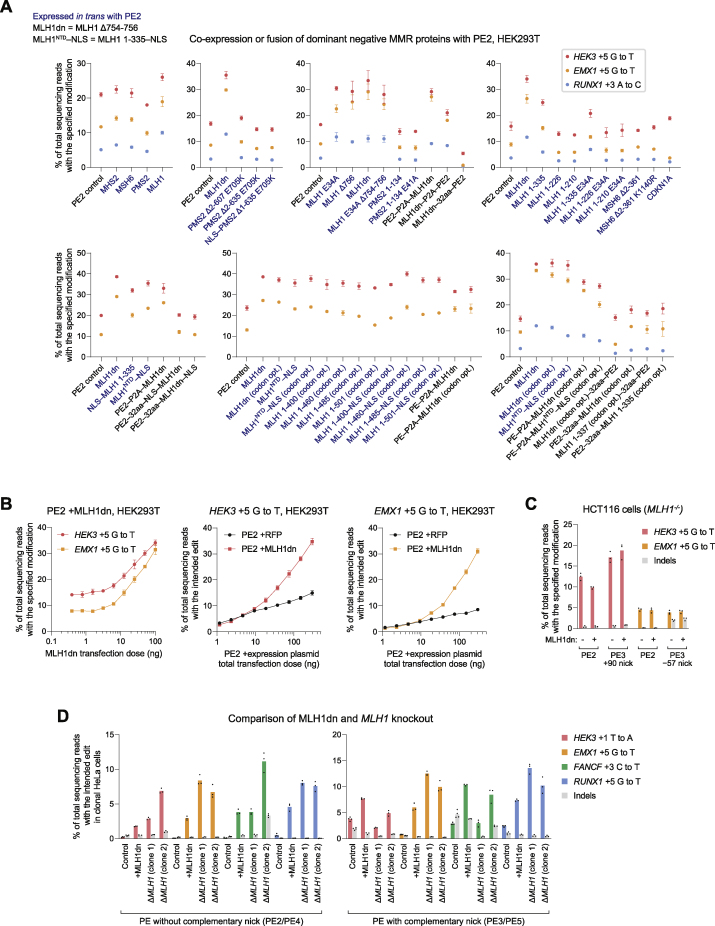
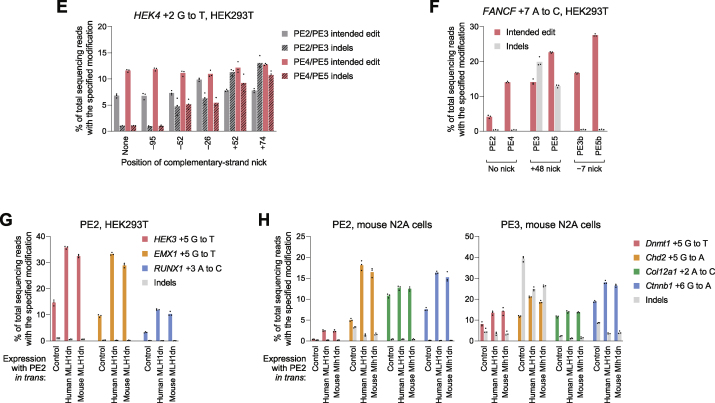
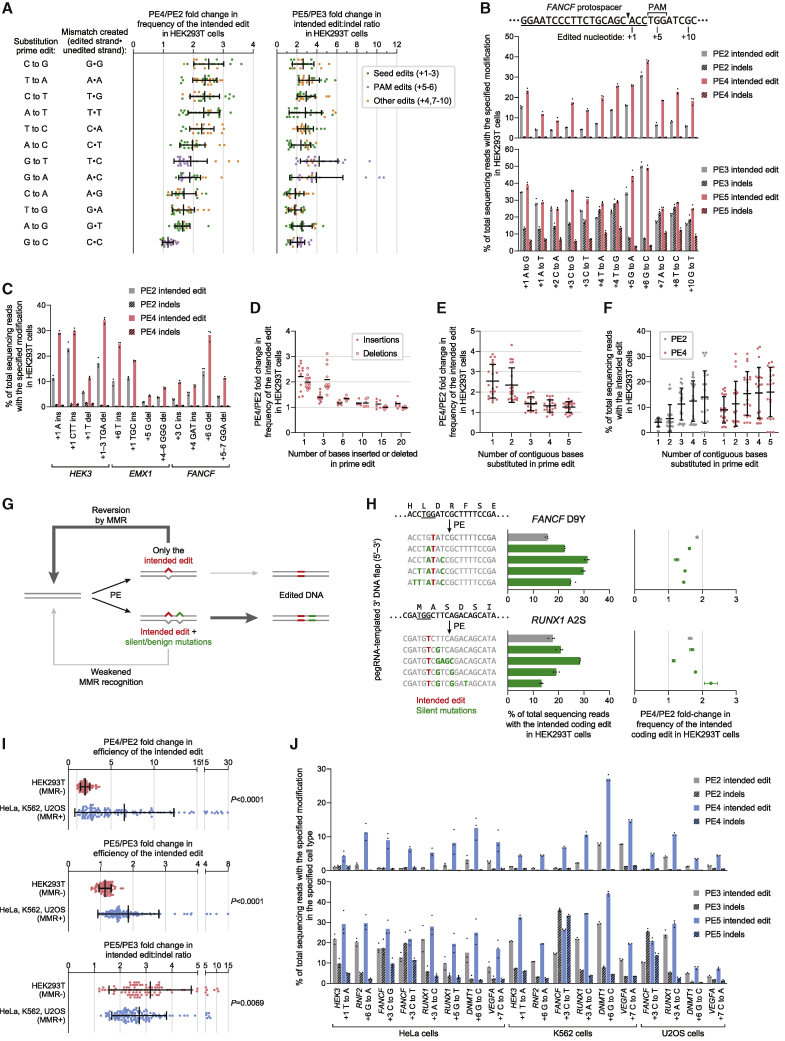
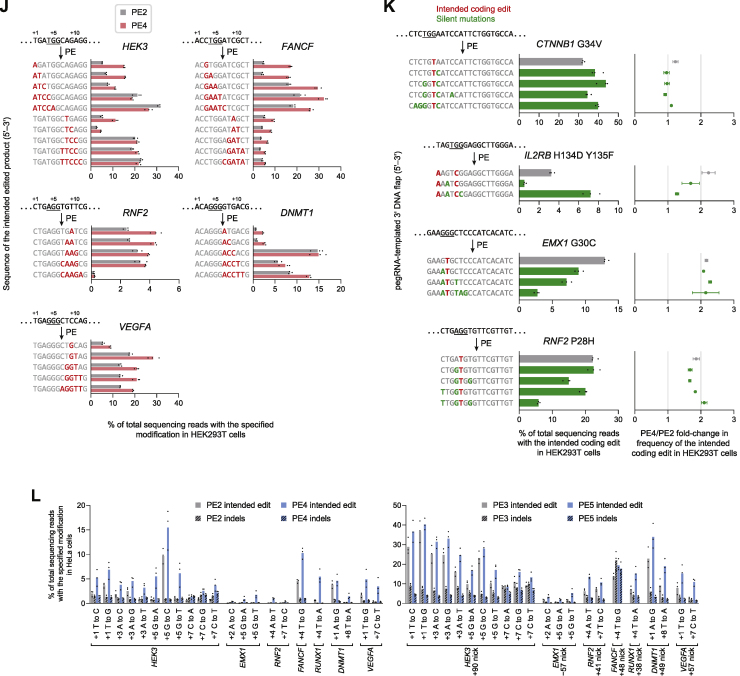
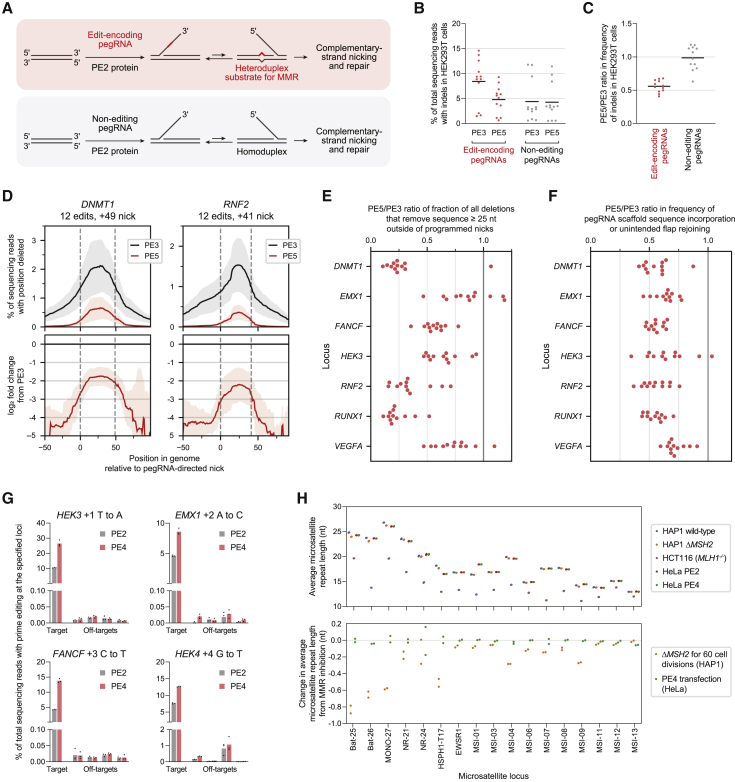
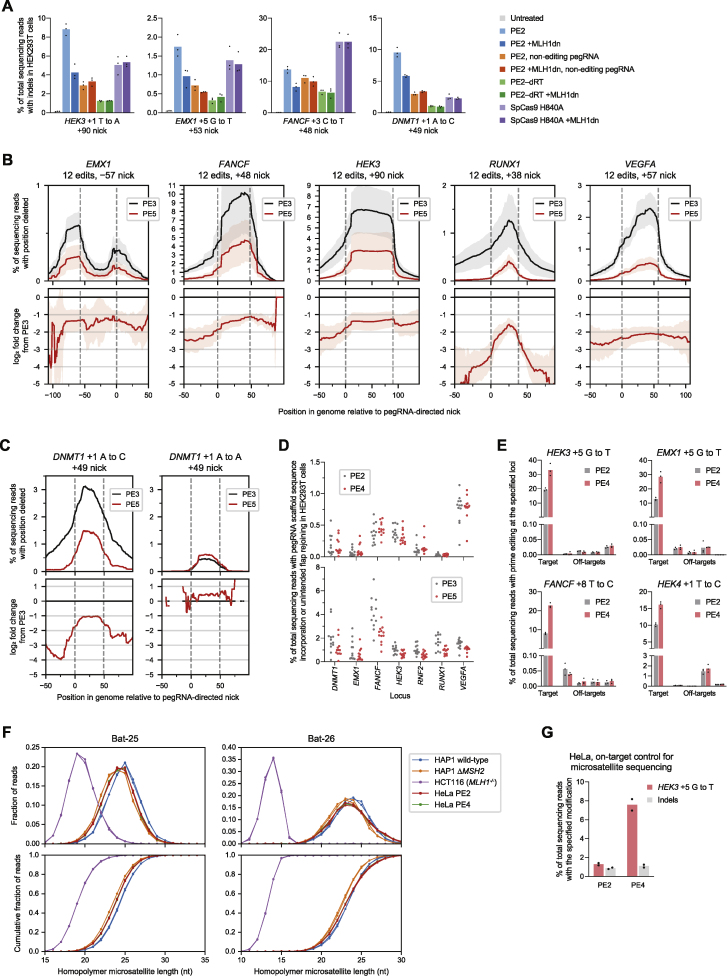
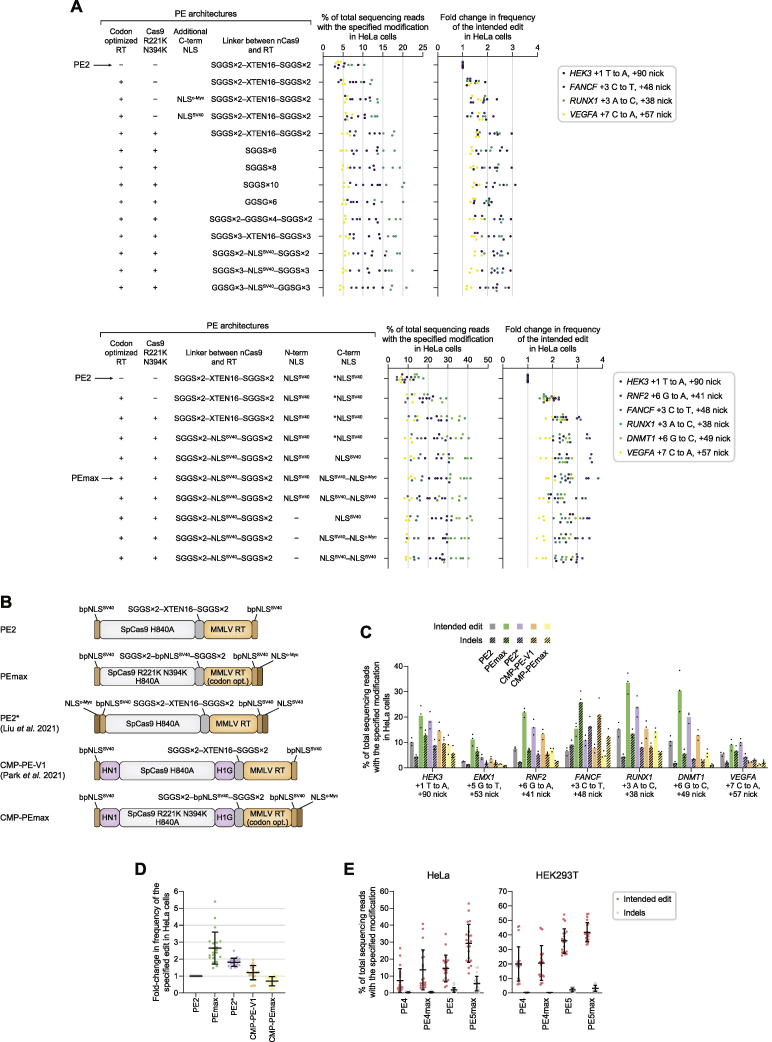
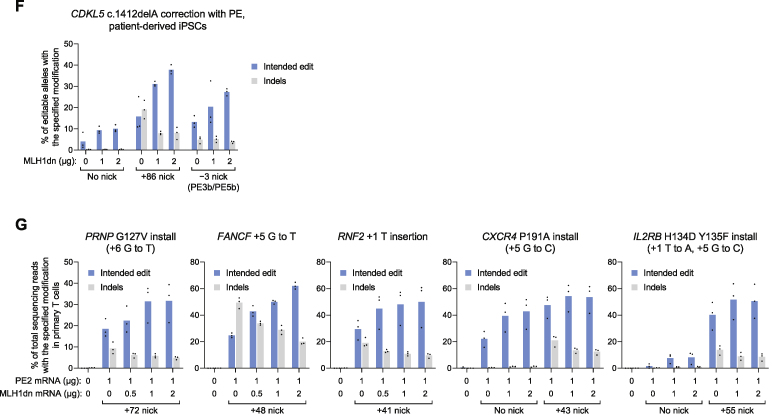
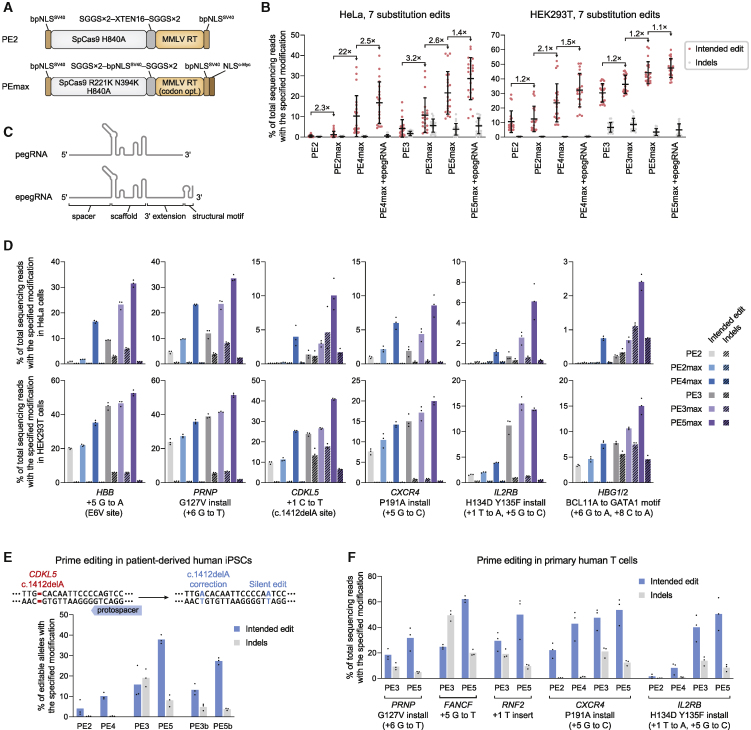
While prime editing enables precise sequence changes in DNA, cellular determinants of prime editing remain poorly understood. Using pooled CRISPRi screens, we discovered that DNA mismatch repair (MMR) impedes prime editing and promotes undesired indel byproducts. We developed PE4 and PE5 prime editing systems in which transient expression of an engineered MMR-inhibiting protein enhances the efficiency of substitution, small insertion, and small deletion prime edits by an average 7.7-fold and 2.0-fold compared to PE2 and PE3 systems, respectively, while improving edit/indel ratios by 3.4-fold in MMR-proficient cell types. Strategic installation of silent mutations near the intended edit can enhance prime editing outcomes by evading MMR. Prime editor protein optimization resulted in a PEmax architecture that enhances editing efficacy by 2.8-fold on average in HeLa cells. These findings enrich our understanding of prime editing and establish prime editing systems that show substantial improvement across 191 edits in seven mammalian cell types.

Keywords: CRISPR-Cas9; Repair-seq; genome editing; mismatch repair; prime editing.


Conflict of interest statement

Declaration of interests P.J.C., J.A.H., B.A., and D.R.L. have filed patent applications on aspects of this work through their respective institutions. J.A.H. is a consultant for Tessera Therapeutics. P.-F.C. is currently an employee of Tessera Therapeutics. B.A. was a member of a ThinkLab Advisory Board for, and holds equity in, Celsius Therapeutics. D.R.L. is a consultant and equity holder of Beam Therapeutics, Prime Medicine, Pairwise Plants, and Chroma Medicine.

Figures

None
Graphical abstract
Figure 1
Figure 1
Pooled CRISPRi screens reveal genetic determinants of substitution prime editing outcomes (A) Prime editing with the PE2 system is mediated by the PE2 enzyme (Streptococcus pyogenes Cas9 [SpCas9] H840A nickase fused to an engineered reverse transcriptase) and a prime editing guide RNA (pegRNA). The PE3 system uses an additional single guide RNA (sgRNA) to nick the non-edited strand and yield higher editing efficiency. PBS, primer binding site; RT template, reverse transcription template. (B) Overview of prime editing Repair-seq screens. CRISPRi cells are transduced with a library of CRISPRi sgRNAs and a pre-validated prime edit site, then transfected with prime editors targeting the edit site. Paired-end sequencing of CRISPRi sgRNA identities and prime edited sites links each genetic perturbation with the associated editing outcome. (C) Effect of each CRISPRi sgRNA on the intended G⋅C-to-C⋅G prime edit at the targeted edit site in Repair-seq CRISPRi screens using PE2 in K562 cells. (D) Effect of CRISPRi sgRNAs on the intended edit in all screen conditions. Black dots represent individual non-targeting sgRNAs, black lines show the mean of all non-targeting sgRNAs, and gray shading represents kernel density estimates of the distributions of all sgRNAs. (E–G) Comparisons of gene-level effects of CRISPRi targeting on the intended G⋅C-to-C⋅G prime edit across different screen conditions. (E) K562 PE2 versus HeLa PE2. (F) K562 PE3+50 versus HeLa PE3+50. (G) K562 PE2 versus K562 PE3+50. The effect of each gene is calculated as the average log2 fold change in frequency from non-targeting sgRNAs for the two most extreme sgRNAs targeting the gene. Dots represent the mean of n = 2 independent replicates for each cell type, and bars show the range of values spanned by the replicates. Black dots represent 20 random sets of three non-targeting sgRNAs.
Figure S1
Figure S1
Design and results of Repair-seq screens for substitution prime editing outcomes, related to Figure 1 (A) Presumed model by which the reverse-transcribed 3′ DNA flap is permanently incorporated into the genome during prime editing (Anzalone et al., 2019). (B) Installation of a G⋅C-to-C⋅G edit within a lentivirally integrated HBB sequence using SaPE2 and Sa-pegRNAs in HEK293T cells. PBS, primer binding site. Data represent the mean of n = 3 independent replicates. (C) Design of the prime editing Repair-seq lentiviral vector (pPC1000, additional details and full sequence information in STAR Methods). In Repair-seq screens, a 453-bp region containing CRISPRi sgRNA sequence and prime editing outcome is amplified from genomic DNA for paired-end Illumina sequencing. The CRISPRi sgRNA is sequenced with a 44-nt Illumina forward read (R1), and the prime edited site (including +50 and –50 nick sites) is sequenced with a 263-nt Illumina reverse read (R2). Black triangles indicate positions of SaPE2-induced nicks programmed by Sa-pegRNA and Sa-sgRNAs. Sizes of all vector components are to scale. (D) Schematic of PE2, PE3+50, and PE3–50 prime editing configurations with SaPE2 protein (SaCas9 N580A fused to an engineered MMLV RT). (E) Validation of intended G⋅C-to-C⋅G editing at the lentivirally integrated Repair-seq edit site in HeLa cells expressing dCas9–BFP–KRAB cells. Bars represent the mean of n = 2 independent replicates. (F) Prime editing at the Repair-seq edit site with blasticidin selection in HeLa cells expressing dCas9–BFP–KRAB. SaPE2–P2A–BlastR prime editor was used for all conditions. Bars represent the mean of n = 2 independent replicates. (G) Functional annotation classes of the genes targeted by the pooled CRISPRi sgRNA library used in Repair-seq screens. (H–K) Knockdown of MSH2, MSH6, MLH1, and PMS2 increases the frequency of the intended +6 G⋅C-to-C⋅G prime edit in all Repair-seq screens. Dots represent individual CRISPRi sgRNAs.
Figure 2
Figure 2
Genetic modulators of unintended prime editing outcomes (A–D) Representative examples of four categories of unintended prime editing outcomes observed in CRISPRi screens. Blue and orange lines between the editing outcome and the genome or pegRNA depict local sequence alignments. X’s represent mismatches in alignments, gaps represent insertions, and gray boxes represent the location of the programmed edit. Red and cyan rectangles on the genome mark SaCas9 protospacers and PAMs, and black vertical lines mark the locations of SaCas9 nick sites. (E and F) Summary of editing outcome categories observed in PE2 screens (E) and in PE3+50 screens (F) in K562 cells. Plotted quantities are the mean ± SD of all sgRNAs for each indicated gene (60 non-targeting sgRNAs and three sgRNAs per targeted gene), averaged across n = 2 independent replicates. (G and H) Comparison of the effects of knockdown of all genes targeted in CRISPRi screens on the frequency of joining of reverse-transcribed sequence at unintended location (G) or of deletions (H) from PE3+50. The effect of each gene is calculated as the average log2 fold change in frequency from non-targeting sgRNAs for the two most extreme sgRNAs targeting the gene. Dots represent the mean of n = 2 independent replicates for each cell type, and bars show the range of values spanned by the replicates. Black dots represent 20 random sets of three non-targeting sgRNAs. (I) Top: frequency of deletion as a function of genomic position relative to programmed PE3+50 nicks (dashed vertical lines) in K562 screen replicate 1 across all reads for indicated sets of CRISPRi sgRNAs (black line, 60 non-targeting sgRNAs; orange and green lines, three sgRNAs targeting each of MSH2, MSH6, MLH1, and PMS2). Bottom: log2 fold change in frequency of deletion as a function of genomic position for MSH2, MSH6, MLH1, and PMS2 sgRNAs compared to non-targeting sgRNAs. (J) Effect of gene knockdowns on the fraction of all observed deletions that remove sequence at least 25 nt outside of programmed PE3+50 nicks in K562 screens. Each dot represents all reads for sgRNAs targeting an individual gene. Black dots represent 20 sets of three random non-targeting sgRNAs.
Figure S2
Figure S2
Genetic modulators of unintended prime editing outcomes, related to Figure 2 (A) Overview of PE3–50 outcomes in HeLa CRISPRi screens. TP53BP1 knockdown dramatically reduces formation of all unintended editing outcomes. (B) Additional details of PE2 outcomes in K562 CRISPRi screens, supplementing Figure 2E. (C) Additional details of PE3+50 outcomes in K562 CRISPRi screens, supplementing information in Figure 2F. (D–I) Comparisons of effects of gene knockdown on frequencies of indicated outcome categories in indicated screen conditions. Plotted quantities are the mean of the log2 fold changes from non-targeting sgRNAs for the two most extreme sgRNAs per gene, averaged over n = 2 independent replicates per condition. Error bars mark the range of values spanned by the replicates. Black dots represent 20 random sets of three non-targeting sgRNAs. (D) MSH2, MLH1, and PMS2 knockdown produce larger fold changes in installation of additional edits than in intended edits in K562 PE2 screens. (E) Unintended joining of reverse transcribed sequence in PE2 screens in K562 and HeLa cells are most increased by knockdown of Fanconi anemia genes (red) as well as a set of RAD51 homologs and other genes involved in homologous recombination (blue). (F) Deletions in PE2 screens in K562 and HeLa cells are most increased by a set of RAD51 homologs and other genes involved in homologous recombination (blue). (G) In addition to MSH2, MLH1, and PMS2, HLTF knockdown produces larger fold changes in installation of additional edits than in intended edits in K562 PE3+50 screens. (H) Tandem duplications in HeLa and K562 PE3+50 screens are most decreased by knockdown of POLD and RFC subunits. (I) Deletions in HeLa PE3+50 and PE3–50 screens have dramatically divergent genetic regulators, highlighting differences in the processing of the different overhang configurations.
Figure S3
Figure S3
Validation of prime editing Repair-seq screen results, related to Figures 2 and 3 (A–B) Top: alignment of Sa-pegRNAs, their templated 3′ DNA flaps following SaPE2 reverse transcription, and the genomic target sequence. Compared to the Sa-pegRNA used in Repair-seq screens (A), an Sa-pegRNA with recoded scaffold sequence (B) templates an extended 3′ DNA flap with reduced homology with genomic target sequence. The recoded Sa-pegRNA contains 2 base pair changes that preserve base pairing interactions within the scaffold. Reverse transcription of the Sa-pegRNA scaffold can generate a misextended 3′ flap that is incorporated into the genome. Vertical lines depict base pairing. Red X’s depict mismatches between the misextended reverse-trancribed 3′ flap and genomic sequence. Bottom: frequencies of editing outcome categories observed at the screen edit site from arrayed PE2 and PE3+50 experiments in HeLa CRISPRi cells. Prime editing with the Sa-pegRNA used in Repair-seq screens (A) or a recoded Sa-pegRNA (B) results in different frequencies of installation of unintended edits from nearly matched scaffold. Plotted quantities are the mean ± SD of n = 4 independent replicates for cells containing a MSH2 or non-targeting CRISPRi sgRNA. (C) Mechanism of DNA mismatch repair in humans. (D) Mismatch repair of a prime editing heteroduplex intermediate induces indel byproducts, potentially through MutLα endonuclease activity at the target locus or excision from these non-programmed nicks and subsequent repair of the resulting intermediates. (E) Knockdown efficiency of siRNA treatment relative to a non-targeting siRNA control in HEK293T cells. Cells were transfected with siRNAs, incubated for 3 days, transfected with PE2, pegRNAs, and the same siRNAs, then incubated for another 3 days before relative RNA abundances were assayed by RT-qPCR. NT, non-targeting. Data represent the mean of n = 3 independent replicates. Each dot represents the mean of n = 3 technical replicates. Data supplements information in Figure 3C. (F) Editing in HEK293T cells co-transfected with prime editor components and siRNAs. Cells were not pre-treated with siRNAs before transfection with prime editors. Bars represent the mean of n = 3 independent replicates.
Figure 3
Figure 3
Model for mismatch repair of prime editing intermediates (A) Model for DNA mismatch repair (MMR) of PE2 intermediates. MMR replaces the nicked strand during repair of the heteroduplex PE intermediate. Ligation of the nick before MMR recognition removes the strand discrimination signal for MMR, resulting in unbiased resolution of the heteroduplex. (B) Model for MMR of PE3 intermediates. Nicks on both DNA strands can direct MMR to replace either strand. Ligation of the nick on the edited strand would guide MMR to replace the non-edited strand. (C) Prime editing at endogenous sites in HEK293T cells pretreated with siRNAs (details in STAR Methods). Bars represent the mean of n = 3 independent replicates. (D) Prime editing in HAP1 ΔMSH2 and HAP1 ΔMLH1 cells. Δ, gene knockout. Bars represent the mean of n = 3 independent replicates.
Figure 4
Figure 4
Engineered dominant negative MLH1 enhances prime editing outcomes (A) Co-expression of PE2 with dominant negative variants of human MMR proteins improves prime editing efficiency. All values from n = 3 independent replicates are shown. (B) Functional annotation of the 756-aa human MLH1 protein. (C) Editing enhancement from MLH1 variants co-expressed with PE2. Red boxes indicate mutations that inactivate MLH1 ATPase or endonuclease function. All values from n = 3 independent replicates are shown. (D) Comparison of the top three MLH1 variants across ten prime edits. All values from n = 3 independent replicates are shown. (E) Prime editing with PE2 and MLH1dn in trans, PE2 and MLH1NTD–NLS in trans, and PE2–P2A–MLH1dn (human codon-optimized). Bars represent the mean of n = 3 independent replicates. (F) The PE4 editing system consists of a prime editor enzyme (nickase Cas9–RT fusion), MLH1dn, and pegRNA. The PE5 editing system consists of a prime editor enzyme, MLH1dn, pegRNA, and nicking sgRNA. (G) PE2, PE3, PE4, and PE5 editing in HEK293T cells. Bars represent the mean of n = 3 independent replicates.
Figure S4
Figure S4
Development and characterization of dominant negative MMR proteins that enhance prime editing outcomes, related to Figure 4 (A) Prime editing efficiencies from MMR proteins or dominant negative variants expressed in trans with or fused directly to PE2 in HEK293T cells. 32aa, (SGGS)×2–XTEN16–(SGGS)×2 linker. codon opt., human codon-optimized. Data within the same graph originate from experiments performed at the same time. Data represent the mean ± SD of n = 3 independent replicates. (B) Titration of MLH1dn plasmid and PE2 plasmid transfection doses in HEK293T cells. Maximum plasmid amounts tested were 200 ng PE2 and 100 ng MLH1dn. Data represent the mean ± SD of n = 3 independent replicates. (C) Prime editing with MLH1dn co-expression in MMR-deficient HCT116 cells that contain a biallelic deletion in MLH1. Bars represent the mean of n = 3 independent replicates. (D) MLH1 knockout in clonal HeLa cell lines enhances prime editing efficiency to a greater extent than MLH1dn co-expression in clonal wild-type HeLa cells. Δ, knockout. Bars represent the mean of n = 3 or 4 independent replicates. (E) Editing at the HEK4 locus with complementary-strand nicks in HEK293T cells. “None” indicates the lack of a nick, which denotes a PE2 or PE4 editing strategy. Bars represent the mean of n = 3 independent replicates. (F) Editing at the FANCF locus with PE3b and PE5b (complementary-strand nick that is specific for the edited sequence) in HEK293T cells. PE5b, PE3b editing system with MLH1dn co-expression. Bars represent the mean of n = 3 independent replicates. (G) Comparison of prime editing with human MLH1dn (human codon-optimized) or mouse MLH1dn (mouse codon-optimized) in human HEK293T cells. Bars represent the mean of n = 3 independent replicates. (H) Comparison of prime editing with human MLH1dn (human codon-optimized) or mouse MLH1dn (mouse codon-optimized) in mouse N2A cells. Bars represent the mean of n = 3 independent replicates.
Figure S4
Figure S4
Development and characterization of dominant negative MMR proteins that enhance prime editing outcomes, related to Figure 4 (A) Prime editing efficiencies from MMR proteins or dominant negative variants expressed in trans with or fused directly to PE2 in HEK293T cells. 32aa, (SGGS)×2–XTEN16–(SGGS)×2 linker. codon opt., human codon-optimized. Data within the same graph originate from experiments performed at the same time. Data represent the mean ± SD of n = 3 independent replicates. (B) Titration of MLH1dn plasmid and PE2 plasmid transfection doses in HEK293T cells. Maximum plasmid amounts tested were 200 ng PE2 and 100 ng MLH1dn. Data represent the mean ± SD of n = 3 independent replicates. (C) Prime editing with MLH1dn co-expression in MMR-deficient HCT116 cells that contain a biallelic deletion in MLH1. Bars represent the mean of n = 3 independent replicates. (D) MLH1 knockout in clonal HeLa cell lines enhances prime editing efficiency to a greater extent than MLH1dn co-expression in clonal wild-type HeLa cells. Δ, knockout. Bars represent the mean of n = 3 or 4 independent replicates. (E) Editing at the HEK4 locus with complementary-strand nicks in HEK293T cells. “None” indicates the lack of a nick, which denotes a PE2 or PE4 editing strategy. Bars represent the mean of n = 3 independent replicates. (F) Editing at the FANCF locus with PE3b and PE5b (complementary-strand nick that is specific for the edited sequence) in HEK293T cells. PE5b, PE3b editing system with MLH1dn co-expression. Bars represent the mean of n = 3 independent replicates. (G) Comparison of prime editing with human MLH1dn (human codon-optimized) or mouse MLH1dn (mouse codon-optimized) in human HEK293T cells. Bars represent the mean of n = 3 independent replicates. (H) Comparison of prime editing with human MLH1dn (human codon-optimized) or mouse MLH1dn (mouse codon-optimized) in mouse N2A cells. Bars represent the mean of n = 3 independent replicates.
Figure 5
Figure 5
Characterization of PE4 and PE5 across diverse prime edit classes and cell types (A) Summary of prime editing enhancement by PE4 and PE5 compared to PE2 and PE3 for 84 single-base substitution edits (7 for each substitution type) across 7 endogenous sites in HEK293T cells. The grand mean ± SD of all individual values of n = 3 independent replicates are shown. (B) Substitution edits with PE2, PE3, PE4, and PE5 at the FANCF locus in HEK293T cells. The black triangle marks the location of the pegRNA-programmed nick. Bars represent the mean of n = 3 independent replicates. (C) PE4 improves 1- and 3-bp indel prime edits compared to PE2 in HEK293T cells (mean of n = 3 independent replicates). (D) PE4 editing enhancement over PE2 across 33 indel prime edits. Lines represent the mean of all individual values of n = 3 independent replicates. (E and F) Summary of PE2 and PE4 editing efficiencies for 35 different substitutions of 1–5 contiguous bases at five endogenous sites in HEK293T cells. Seven pegRNAs were tested for each number of contiguous bases altered. The mean ± SD of all individual values of n = 3 replicates are shown. (G and H) Installation of additional silent or benign mutations near the intended edit can increase editing efficiency by generating a heteroduplex substrate that evades MMR. The PAM sequence (NGG) for each target is underlined. The amino acid sequence of the targeted gene is centered above each triplet DNA codon. Values represent the mean ± SD of n = 3 independent replicates. (I) Summary of PE4 and PE5 editing enhancement in MMR-deficient (MMR−) and MMR-proficient (MMR+) cells. A common set of 30 pegRNAs encoding point mutations were tested in HEK293T and HeLa cells. K562 and U2OS cells were edited with 10 total pegRNAs that are a subset of these 30 pegRNAs. The mean ± SD of all individual values of sets of n = 3 independent replicates are shown. p values were calculated with the Mann-Whitney U test. (J) Prime editing with PE2, PE3, PE4, and PE5 in HeLa, K562, and U2OS cells. Bars represent the mean of n = 3 independent replicates.
Figure S5
Figure S5
Characterization of PE4 and PE5 systems and improved prime editing efficiency with additional silent mutations, related to Figure 5 (A) Comparison of PE2, PE3, PE4, and PE5 for 84 single-base substitution prime edits across seven endogenous sites in HEK293T cells, supplementing information in Figures 5A, 6D–F, S6B, and S6D. Bars represent the mean of n = 3 independent replicates. (B) Summary of PE4 enhancement in editing efficiency over PE2 for 84 single-base substitution edits across seven endogenous sites in HEK293T cells. PE4/PE2 fold improvements may be lower for PAM edits due to the high basal editing efficiency for PAM edits or the high representation of G⋅C-to-C⋅G edits (five out of 15 in this category). Data represent the mean ± SD of n = 3 independent replicates. (C) Summary of PE5 enhancement in editing efficiency over PE3 for 84 single-base substitution edits in HEK293T cells. The grand mean ± SD of all individual values of n = 3 independent replicates are shown. (D) Effect of siRNA knockdown of MMR genes on G⋅C-to-C⋅G editing at the RNF2 locus in HEK293T cells. Bars represent the mean of n = 3 independent replicates. (E) Effect of MMR gene knockout on G⋅C-to-C⋅G editing at the RNF2 locus in HAP1 cells. Δ, gene knockout. Bars represent the mean of n = 3 independent replicates. (F) Efficiencies of single-base substitution prime edits that alter the PAM (+5 G or +6 G bases) of prime editing target protospacers in HEK293T cells. Four G⋅C-to-A⋅T, five G⋅C-to-C⋅G, and six G⋅C-to-T⋅A PAM edits across a combined seven endogenous sites are shown. The mean of all individual values of n = 3 independent replicates are shown. (G) Prime editing at the pre-validated Repair-seq screen edit site with CRISPRi knockdown in HeLa CRISPRi cells. PE2 indicates editing with SaPE2 protein and Sa-pegRNA. PE3+50 indicates editing with SaPE2 protein, Sa-pegRNA, and Sa-sgRNA that programs a +50 complementary-strand nick. Bars represent the mean of n = 5 independent replicates. (H) PE5 improves editing efficiency and reduces indel byproducts compared to PE3 across small insertion and deletion prime edits in HEK293T cells. (I) PE2 and PE4 editing efficiencies at 33 different insertion and deletion prime edits across a combined three endogenous loci. Lines represent the mean of all individual values of n = 3 independent replicates. Data supplements information in Figure 5D. (J) Substitutions of contiguous bases with PE2 and PE4 in HEK293T cells. The top sequence indicates the original, unedited genomic sequence. Numbers denote the position of the edited nucleotide relative to the pegRNA-directed nick site. Nucleotides within the SpCas9 PAM sequence (NGG) are underlined. Sequences of the intended edited product are shown below, with edited nucleotides marked in red. Bars represent the mean of n = 3 independent replicates. Data supplements information in Figures 5E and 5F. (K) Installation of additional silent mutations can increase prime editing efficiency by evading MMR. PE4/PE2 fold-change in editing frequency reflects the extent to which MMR activity impedes the indicated prime edit. Edited nucleotides that make the indicated coding mutation are marked in red, and edited nucleotides that make silent mutations are marked in green. Data represent the mean ± SD of n = 3 independent replicates. (L) Installation of 22 single-base substitution prime edits across seven endogenous sites in HeLa cells with PE2, PE3, PE4, and PE5. Bars represent the mean of n = 3 independent replicates. Data supplements information in Figure 5I.
Figure S5
Figure S5
Characterization of PE4 and PE5 systems and improved prime editing efficiency with additional silent mutations, related to Figure 5 (A) Comparison of PE2, PE3, PE4, and PE5 for 84 single-base substitution prime edits across seven endogenous sites in HEK293T cells, supplementing information in Figures 5A, 6D–F, S6B, and S6D. Bars represent the mean of n = 3 independent replicates. (B) Summary of PE4 enhancement in editing efficiency over PE2 for 84 single-base substitution edits across seven endogenous sites in HEK293T cells. PE4/PE2 fold improvements may be lower for PAM edits due to the high basal editing efficiency for PAM edits or the high representation of G⋅C-to-C⋅G edits (five out of 15 in this category). Data represent the mean ± SD of n = 3 independent replicates. (C) Summary of PE5 enhancement in editing efficiency over PE3 for 84 single-base substitution edits in HEK293T cells. The grand mean ± SD of all individual values of n = 3 independent replicates are shown. (D) Effect of siRNA knockdown of MMR genes on G⋅C-to-C⋅G editing at the RNF2 locus in HEK293T cells. Bars represent the mean of n = 3 independent replicates. (E) Effect of MMR gene knockout on G⋅C-to-C⋅G editing at the RNF2 locus in HAP1 cells. Δ, gene knockout. Bars represent the mean of n = 3 independent replicates. (F) Efficiencies of single-base substitution prime edits that alter the PAM (+5 G or +6 G bases) of prime editing target protospacers in HEK293T cells. Four G⋅C-to-A⋅T, five G⋅C-to-C⋅G, and six G⋅C-to-T⋅A PAM edits across a combined seven endogenous sites are shown. The mean of all individual values of n = 3 independent replicates are shown. (G) Prime editing at the pre-validated Repair-seq screen edit site with CRISPRi knockdown in HeLa CRISPRi cells. PE2 indicates editing with SaPE2 protein and Sa-pegRNA. PE3+50 indicates editing with SaPE2 protein, Sa-pegRNA, and Sa-sgRNA that programs a +50 complementary-strand nick. Bars represent the mean of n = 5 independent replicates. (H) PE5 improves editing efficiency and reduces indel byproducts compared to PE3 across small insertion and deletion prime edits in HEK293T cells. (I) PE2 and PE4 editing efficiencies at 33 different insertion and deletion prime edits across a combined three endogenous loci. Lines represent the mean of all individual values of n = 3 independent replicates. Data supplements information in Figure 5D. (J) Substitutions of contiguous bases with PE2 and PE4 in HEK293T cells. The top sequence indicates the original, unedited genomic sequence. Numbers denote the position of the edited nucleotide relative to the pegRNA-directed nick site. Nucleotides within the SpCas9 PAM sequence (NGG) are underlined. Sequences of the intended edited product are shown below, with edited nucleotides marked in red. Bars represent the mean of n = 3 independent replicates. Data supplements information in Figures 5E and 5F. (K) Installation of additional silent mutations can increase prime editing efficiency by evading MMR. PE4/PE2 fold-change in editing frequency reflects the extent to which MMR activity impedes the indicated prime edit. Edited nucleotides that make the indicated coding mutation are marked in red, and edited nucleotides that make silent mutations are marked in green. Data represent the mean ± SD of n = 3 independent replicates. (L) Installation of 22 single-base substitution prime edits across seven endogenous sites in HeLa cells with PE2, PE3, PE4, and PE5. Bars represent the mean of n = 3 independent replicates. Data supplements information in Figure 5I.
Figure 6
Figure 6
Effect of MLH1dn on prime editing outcome purity and off-targeting (A) Edit-encoding pegRNAs generate a heteroduplex following flap interconversion. Non-editing pegRNAs template a 3′ DNA flap with perfect complementarity to the genomic target site. (B and C) Frequency of indels (B) and ratio of indel frequency (C) from PE3 or PE5 with four edit-encoding pegRNAs that program single-base mutations or four non-editing pegRNAs. Lines indicate mean of all individual values of sets of n = 3 independent replicates. (D) Distribution of deletions at genomic target DNA formed by PE3 and PE5 using 12 substitution-encoding pegRNAs for each locus in HEK293T cells. Dotted lines indicate position of pegRNA- and sgRNA-directed nicks. Data represent the mean ± SD of n = 3 independent replicates. (E and F) PE5/PE3 ratio of frequency of deletions that remove sequence greater than 25 nt outside of pegRNA- and sgRNA-directed nicks (E), and PE5/PE3 ratio of frequency of editing outcomes with unintended pegRNA scaffold sequence incorporation or unintended flap rejoining (F) in HEK293T cells. Each dot represents one of 84 total pegRNAs that program substitution edits (mean of n = 3 independent replicates). (G) Off-target prime editing from PE2 and PE4 in HEK293T cells. Bars represent the mean of n = 3 independent replicates. (H) High-throughput sequencing analysis of microsatellite repeat loci used for clinical diagnosis of MMR deficiency. HAP1 and HeLa cells are MMR proficient, and HCT116 cells have impaired MMR. HAP1 ΔMSH2 cells underwent 60 cell divisions following MSH2 knockout. HeLa cells were transiently transfected with PE2 or PE4 components. All values from n = 2 independent replicates are shown.
Figure S6
Figure S6
Effect of dominant negative MLH1 on prime editing outcome purity and off-targeting, related to Figure 6 (A) Frequency of indels in HEK293T cells treated with pegRNAs, nicking sgRNAs, and PE2 enzyme, RT-impaired PE2 (PE2–dRT), or nickase Cas9 (SpCas9 H840A), with and without MLH1dn. Non-editing pegRNAs encode a 3′ DNA flap with perfect homology to the genomic target. Bars represent the mean of n = 3 independent replicates. Data supplements information in Figures 6B and 6C. (B) Frequency of deletion as a function of genomic position relative to programmed nicks from PE3 and PE5 in HEK293T cells. 12 different pegRNAs that program single-base substitutions were tested at each indicated endogenous locus. Dotted lines indicate position of pegRNA- and sgRNA-directed nicks. Data represent the mean ± SD of n = 3 independent replicates. (C) Distribution of deletion outcomes from PE3 and PE5 with an edit-encoding and non-editing pegRNA in HEK293T cells. The non-editing pegRNA templates a 3′ DNA flap with perfect complementary to the genomic target sequence. Data represent the mean ± SD of n = 3 independent replicates. (D) Frequency of all prime editing outcomes with unintended pegRNA scaffold sequence incorporation or unintended flap rejoining in HEK293T cells. 12 pegRNAs each programming a different single-base substitution were tested at each of the seven indicated loci. Each dot represents an individual pegRNA at the indicated locus (mean of n = 3 independent replicates). (E) Off-target prime editing by PE2 and PE4 in HEK293T cells. Bars represent the mean of n = 3 independent replicates. (F) Distribution and cumulative distribution of microsatellite repeat lengths in the indicated cell types and treatments. HAP1 and HeLa cells are MMR-proficient, and HCT116 cells have impaired MMR. HAP1 ΔMSH2 cells underwent 60 cell divisions following knockout of MSH2. HeLa cells were transiently transfected with PE2 or PE4 components and grown for 3 days before sequencing. wt, wild-type. All values from n = 2 independent replicates are shown. (G) Prime editing at the on-target locus in HeLa cells transfected with PE2 or PE4 components. Bars represent the mean of n = 2 independent replicates. Microsatellite lengths were assayed from genomic DNA taken from these PE2 and PE4-treated HeLa cells.
Figure S7
Figure S7
Development of PEmax and application of PE4 and PE5 to primary cell types, related to Figure 7 (A) Screen of prime editor variants for improved editing efficiency with the PE3 system in HeLa cells. All prime editor architectures carry a SpCas9 H840A mutation to prevent nicking of the complementary DNA strand at the target protospacer. NLSSV40 indicates the bipartite SV40 NLS. NLSSV40 contains a 1-aa deletion outside the PKKKRKV NLSSV40 consensus sequence. All individual values of n = 3 independent replicates are shown. (B) Architectures of the original PE2 editor (Anzalone et al., 2019), PE2 (Liu et al., 2021), CMP–PE–V1 (Park et al., 2021), and prime editor variants developed in this work (PEmax, CMP–PEmax). HN1, HMGN1; H1G, histone H1 central globular domain; codon opt., human codon optimized. (C) PEmax outperforms other prime editor architectures tested with the PE3 system in HeLa cells. Bars represent the mean of n = 3 independent replicates. (D) Fold-change in editing efficiency of prime editor architectures compared to PE2 with the PE3 system in HeLa cells. The mean ± SD of all individual values of n = 3 independent replicates are shown. (E) Intended editing and indel frequencies from PE4, PE4max (PE4 editing system with PEmax architecture), PE5, and PE5max (PE5 editing system with PEmax architecture) in HeLa and HEK293T cells cells. Seven substitution prime edits targeting different endogenous loci were tested for each condition. The mean ± SD of all individual values of n = 3 independent replicates are shown. (F) Correction of CDKL5 c.1412delA via an A⋅T insertion and a G⋅C-to-A⋅T edit in iPSCs derived from a patient heterozygous for the disease allele. Editing efficiencies indicate the percentage of sequencing reads with c.1412delA correction out of editable alleles that carry the mutation. Indel frequencies reflect all sequencing reads that contain any indels that do not map to the c.1412delA allele or wild-type sequence. 1 μg of PE2 mRNA was used in all conditions shown. Bars represent the mean of n = 3 independent replicates. Data supplements information in Figure 7E. (G) Prime editing in primary T cells, supplementing information in Figure 7F. Bars represent the mean of n = 3 independent replicates from different T cell donors.
Figure S7
Figure S7
Development of PEmax and application of PE4 and PE5 to primary cell types, related to Figure 7 (A) Screen of prime editor variants for improved editing efficiency with the PE3 system in HeLa cells. All prime editor architectures carry a SpCas9 H840A mutation to prevent nicking of the complementary DNA strand at the target protospacer. NLSSV40 indicates the bipartite SV40 NLS. NLSSV40 contains a 1-aa deletion outside the PKKKRKV NLSSV40 consensus sequence. All individual values of n = 3 independent replicates are shown. (B) Architectures of the original PE2 editor (Anzalone et al., 2019), PE2 (Liu et al., 2021), CMP–PE–V1 (Park et al., 2021), and prime editor variants developed in this work (PEmax, CMP–PEmax). HN1, HMGN1; H1G, histone H1 central globular domain; codon opt., human codon optimized. (C) PEmax outperforms other prime editor architectures tested with the PE3 system in HeLa cells. Bars represent the mean of n = 3 independent replicates. (D) Fold-change in editing efficiency of prime editor architectures compared to PE2 with the PE3 system in HeLa cells. The mean ± SD of all individual values of n = 3 independent replicates are shown. (E) Intended editing and indel frequencies from PE4, PE4max (PE4 editing system with PEmax architecture), PE5, and PE5max (PE5 editing system with PEmax architecture) in HeLa and HEK293T cells cells. Seven substitution prime edits targeting different endogenous loci were tested for each condition. The mean ± SD of all individual values of n = 3 independent replicates are shown. (F) Correction of CDKL5 c.1412delA via an A⋅T insertion and a G⋅C-to-A⋅T edit in iPSCs derived from a patient heterozygous for the disease allele. Editing efficiencies indicate the percentage of sequencing reads with c.1412delA correction out of editable alleles that carry the mutation. Indel frequencies reflect all sequencing reads that contain any indels that do not map to the c.1412delA allele or wild-type sequence. 1 μg of PE2 mRNA was used in all conditions shown. Bars represent the mean of n = 3 independent replicates. Data supplements information in Figure 7E. (G) Prime editing in primary T cells, supplementing information in Figure 7F. Bars represent the mean of n = 3 independent replicates from different T cell donors.
Figure 7
Figure 7
PE4 and PE5 systems and PEmax architecture enhances editing at disease-relevant gene targets and cell types (A) Schematic of PE2 and PEmax editor architectures. bpNLSSV40, bipartite SV40 NLS. MMLV RT, Moloney murine leukemia virus RT pentamutant; codon opt., human codon-optimized. (B) Prime editing with PE4 and PE5, PEmax, and epegRNAs at seven endogenous sites in HeLa and HEK293T cells. Fold changes indicate the average of fold increases from each edit tested. The mean ± SD of all individual values of n = 3 independent replicates are shown. (C) Engineered pegRNAs (epegRNAs) contain a 3′ RNA structural motif and improve prime editing performance. (D) Prime editing at therapeutically relevant sites (additional details in STAR Methods) in wild-type HeLa and HEK293T cells. Bars represent the mean of n = 3 independent replicates. (E) Correction of CDKL5 c.1412delA in iPSCs derived from a patient heterozygous for the allele. Editing efficiencies indicate the percentage of sequencing reads with c.1412delA correction out of editable alleles that carry the mutation. Indel frequencies reflect all sequencing reads that contain any indels. Bars represent the mean of n = 3 independent replicates. (F) Prime editing in primary human T cells. Bars represent the mean of n = 3 different T cell donors.

Comment in

References

    1. Acharya S., Wilson T., Gradia S., Kane M.F., Guerrette S., Marsischky G.T., Kolodner R., Fishel R. hMSH2 forms specific mispair-binding complexes with hMSH3 and hMSH6. Proc. Natl. Acad. Sci. USA. 1996;93:13629–13634. - PMC - PubMed
    1. Amato A., Cappabianca M.P., Perri M., Zaghis I., Grisanti P., Ponzini D., Di Biagio P. Interpreting elevated fetal hemoglobin in pathology and health at the basic laboratory level: new and known γ- gene mutations associated with hereditary persistence of fetal hemoglobin. Int. J. Lab. Hematol. 2014;36:13–19. - PubMed
    1. Anzalone A.V., Randolph P.B., Davis J.R., Sousa A.A., Koblan L.W., Levy J.M., Chen P.J., Wilson C., Newby G.A., Raguram A., Liu D.R. Search-and-replace genome editing without double-strand breaks or donor DNA. Nature. 2019;576:149–157. - PMC - PubMed
    1. Anzalone A.V., Koblan L.W., Liu D.R. Genome editing with CRISPR-Cas nucleases, base editors, transposases and prime. Nat. Biotechnol. 2020;38:824–844. - PubMed
    1. Asante E.A., Smidak M., Grimshaw A., Houghton R., Tomlinson A., Jeelani A., Jakubcova T., Hamdan S., Richard-Londt A., Linehan J.M., et al. A naturally occurring variant of the human prion protein completely prevents prion disease. Nature. 2015;522:478–481. - PMC - PubMed

Publication types