. 2022 Jan 19;13(1):29-42.e7.
doi: 10.1016/j.cels.2021.09.011. Epub 2021 Oct 14.

Functional attractors in microbial community assembly

Affiliations

Functional attractors in microbial community assembly

Sylvie Estrela et al. Cell Syst. .

Abstract

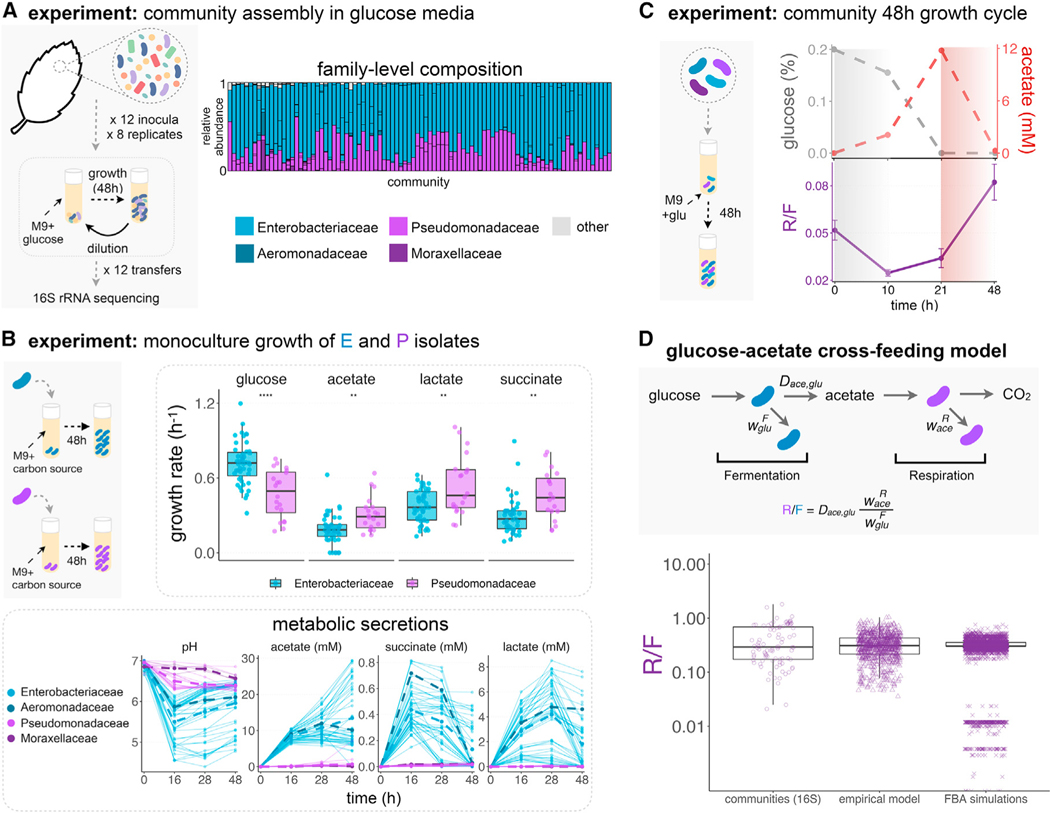
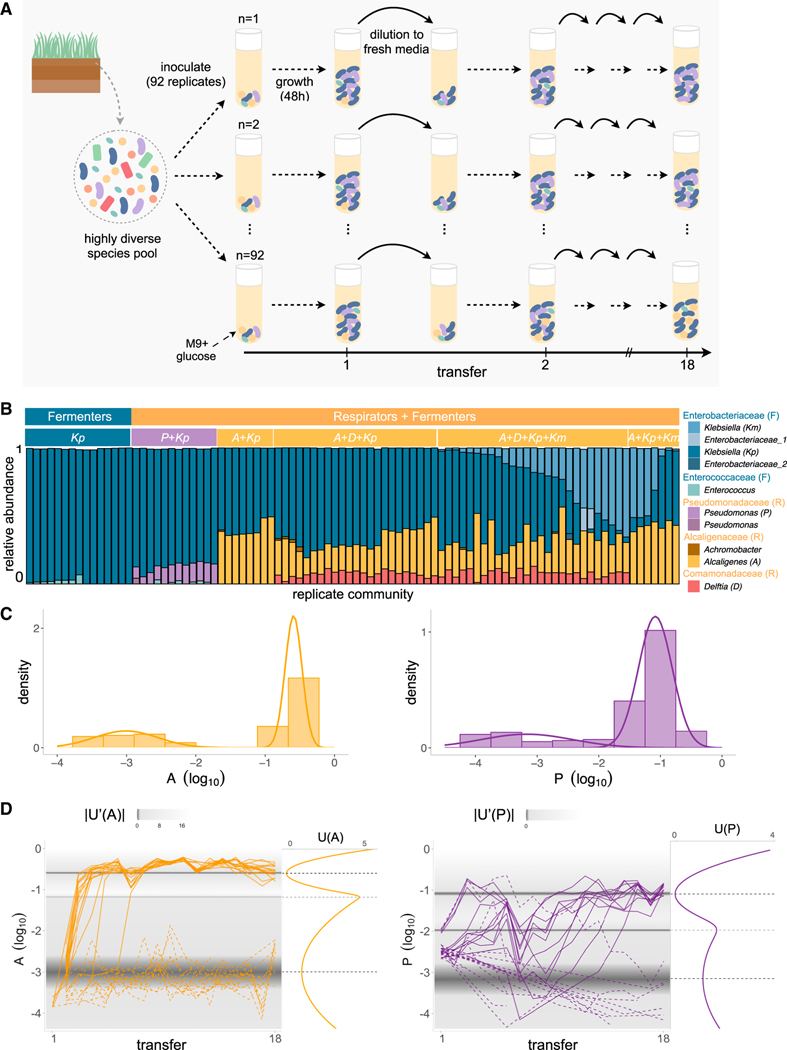
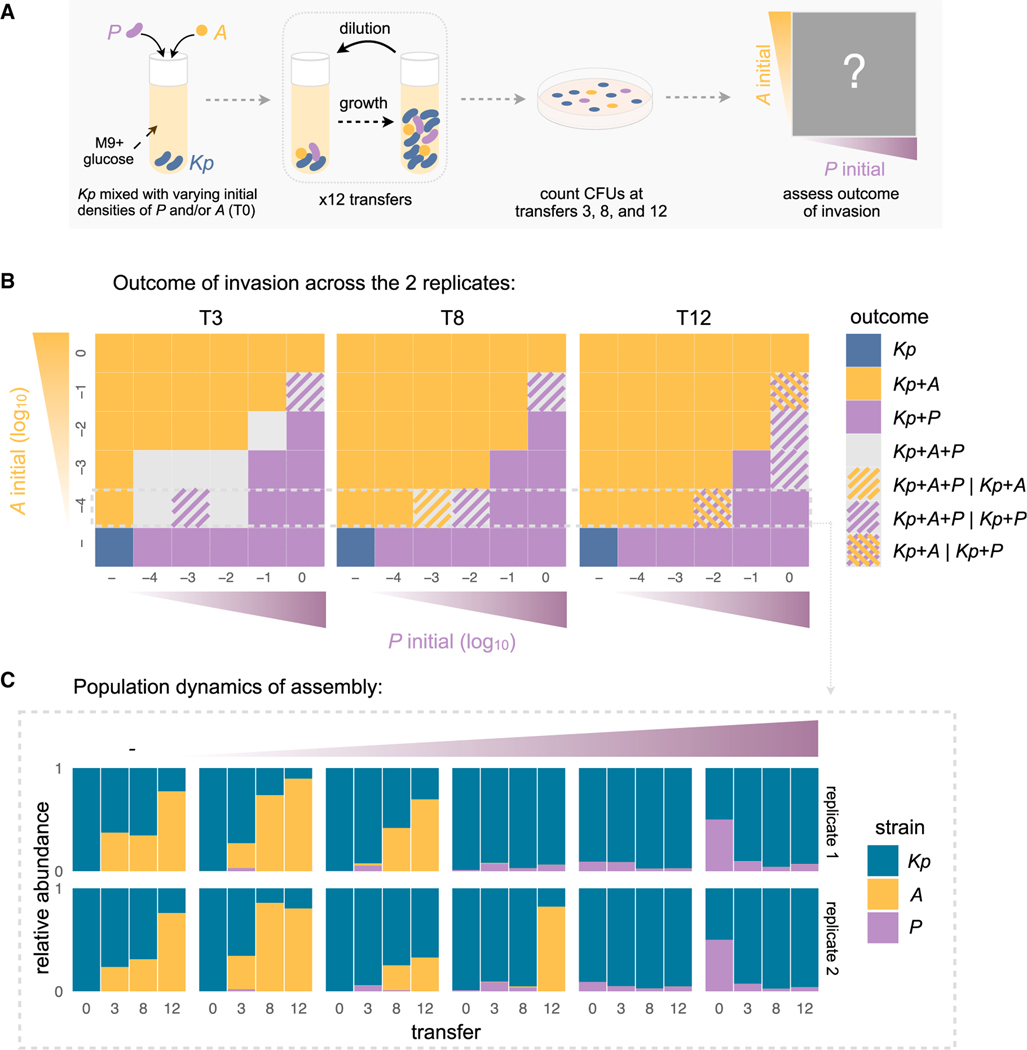
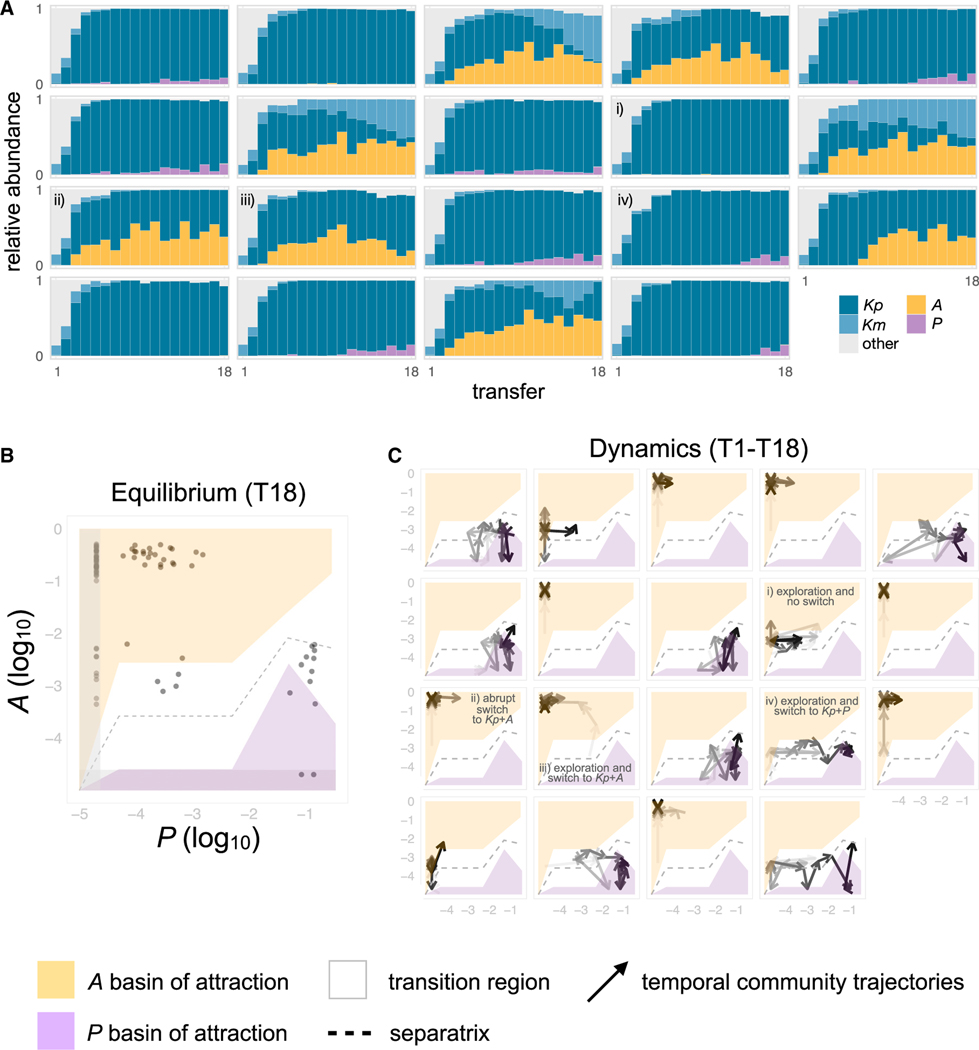
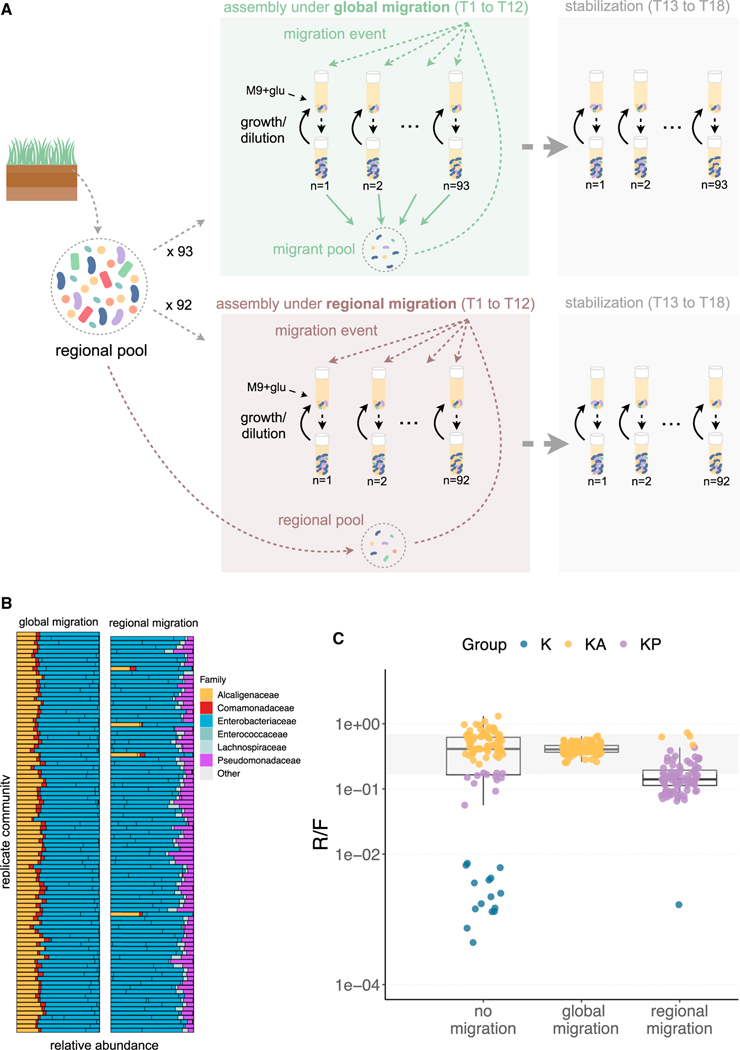
For microbiome biology to become a more predictive science, we must identify which descriptive features of microbial communities are reproducible and predictable, which are not, and why. We address this question by experimentally studying parallelism and convergence in microbial community assembly in replicate glucose-limited habitats. Here, we show that the previously observed family-level convergence in these habitats reflects a reproducible metabolic organization, where the ratio of the dominant metabolic groups can be explained from a simple resource-partitioning model. In turn, taxonomic divergence among replicate communities arises from multistability in population dynamics. Multistability can also lead to alternative functional states in closed ecosystems but not in metacommunities. Our findings empirically illustrate how the evolutionary conservation of quantitative metabolic traits, multistability, and the inherent stochasticity of population dynamics, may all conspire to generate the patterns of reproducibility and variability at different levels of organization that are commonplace in microbial community assembly.

Keywords: alternative states; dynamical systems theory; microbial community assembly; microbial metabolism; population dynamics.


Conflict of interest statement

Declaration of interests A.S. is a member of the Cell Systems Advisory Board. The authors otherwise declare no competing interests.

Figures

Figure 1.
Figure 1.. Emergent metabolic structure in self-assembled microbial communities
(A) Barplots show the relative abundance of the dominant families (Enterobacteriaceae, Pseudomonadaceae, Aeromonadaceae, and Moraxellaceae) in 92 communities started from 12 leaf or soil inocula (7–8 replicates each) after assembly in minimal media with glucose for 12 growth/dilution cycles (data from Goldford et al., 2018). Other families are shown in gray. (B) Isolates belonging to different families were grown in monoculture for 48 h in minimal media supplemented with a single carbon source (CS) (glucose, acetate, lactate, or succinate) (N = 73, Figure S2). Each dot corresponds to an isolate’s maximum growth rate. Note that **** indicates p ≤ 0.0001, ** indicates p ≤ 0.01, two-sample t test. We measured the pH and quantified the amount of acetate, lactate, and succinate in the medium at various time points for all isolates. The dashed lines represent the mean concentrations for isolates of each family. (C) Communities were thawed and grown in minimal media with glucose for a single incubation time. Samples were taken at 10, 21, and 48 h, and we measured the R/F ratio and the concentrations of glucose and acetate in the medium. Only one representative community (out of N = 9) is shown. See Figure S6 for other communities. The R/F ratio represents the mean ± SD of the CFU ratios calculated by bootstrapping (N = 1,000 replicates). (D) Observed and predicted R/F ratio using a simple resource-partitioning model. The model assumes that the glucose is consumed by the fermentative specialist (F), whereas the acetate released as a metabolic by-product is consumed by the respirative specialist (R). Communities 16S: R/F ratio observed experimentally in the glucose communities described in Figure 1A (median = 0.29, Q1 = 0.17, Q3 = 0.69, N = 92). Empirically calibrated model: R/F ratio empirically calculated using parameters obtained from 47 Enterobacteriaceae isolates and 18 Pseudomonas isolates (STAR Methods; Figure S9) (median = 0.31, Q1 = 0.22, Q3 = 0.43, N = 846). FBA calibrated model: using Flux Balance Analysis, we calculated the biomass obtained from glucose fermentation by Enterobacteriaceae strains (F) and the biomass obtained from consumption of the F’s metabolic byproduct, acetate, by Pseudomonas strains (R). The predicted ratio between R and F biomass was calculated for 74 Pseudomonas metabolic models and 59 Enterobacteriaceae metabolic models. The simulations predict a median R/F ratio of ∼0.303 (Q1 = 0.302, Q3 = 0.356, N = 4,366) (Figures S9 and S10). Each dot represents a different Pseudomonas/Enterobacteriaceae pair.
Figure 2.
Figure 2.. Multiple alternative states at the metabolic and taxonomic level arise from assembly of replicate communities from a single inoculum
(A) Schematic of experimental design: starting from a highly diverse soil microbial community, 92 communities were serially passaged in replicate habitats with glucose as the single carbon source for 18 incubation (growth/dilution) cycles (48 h each). (B) Taxonomic profile of communities shown at the exact sequence variant (ESV) level (one color per ESV) with corresponding genus and family-level assignments. Only the ESVs with a relative abundance >0.01 are shown. After 18 transfers, we find that replicate communities self-assembled in two major functional groups, fermenters only (N = 15) or fermenters with respirators (N = 77). Within the fermenter functional group, we can see two alternative taxonomic compositions depending on whether one or two Klebsiella strains are present (Kp and Kp+Km). Within the respirator functional group, we can clearly identify three alternative taxonomic groups (Pseudomonas, Alcaligenes, and Alcaligenes + Delftia). (C) Probability density distribution of the relative abundance of the dominant Alcaligenes (A) and Pseudomonas (P) ESVs at Transfer 18 all started from the same inoculum (N = 370 communities) (STAR Methods). (D) Population dynamics of A and P for a subset of the communities represented in (C) (N = 31), where the background shows the absolute value of the derivative of the potential (U[x]) (left plots). The plots on the right of each timeseries show the potential (U[x]) (colored solid line) and the dark gray dashed lines show the local maximum (indicating the tipping point, x = −1.18 for A and x = −1.97 for P) between the two minima (indicating the stable states; light gray dashed line).
Figure 3.
Figure 3.. Multistable coexistence between two organic acid specialists explains the alternative attractors in community composition
(A) We isolated the three dominant strains—Klebsiella (Kp), Alcaligenes (A), and Pseudomonas (P) that make up the two major alternative attractors and grew them in a pairwise coculture (Kp+A or Kp+P) or in a three-member consortia (Kp+A+P) by mixing Kp with different initial densities of A and/or P (see STAR Methods). These reconstituted communities were grown in the same conditions as the top-down assembly communities for 12 transfers (STAR Methods). (B) Phase portrait showing the state of the community after T = 3, 8, and 12 transfers for 2 biological replicates. A square is colored yellow if a community that was started there contained A but not P at time T, and it is purple if it contained P but not A. It is gray if both A and P were present in both replicates. Squares with a seamless pattern show states where the two replicates exhibit different outcomes. We can see that the phase portrait is divided in two regions: the upper-left diagonal is made up by the basin of attraction of A dominated communities, whereas the bottom-right diagonal contains the basin of attraction for P dominated communities. A and P generally mutually exclude each other depending on their starting densities. See Figure S14 for the phase portraits of the two biological replicate experiments separately. (C) Temporal dynamics of the relative abundance of each taxa for a subset of the communities shown in (B) (the 2 replicates are shown separately). See Figure S14 for the time series of all pairwise initial conditions of the phase portrait.
Figure 4.
Figure 4.. Multistable metabolic attractors between two organic acid specialists
(A) Temporal dynamics for a subset of the replicate communities shown in Figure 2B (N = 19). Replicate communities were all started from the same inoculum and serially transferred to fresh minimal media with glucose every 48 h for a total of 18 growth-dilution cycles. Only the top four dominant ESVs (Kp, Km, P, and A) at transfer 18 are colored, other ESVs are shown in gray. (B and C) Phase diagram showing the basins of attraction for Alcaligenes (A) dominated (yellow area) and for Pseudomonas (P) dominated (purple area) states, inferred from the outcome of the bottom-up invasion experiment in Figure 3B (STAR Methods), separated by a transition region (white area). The gray dashed line indicates the separatrix between the two basins of attraction. In (B), the dots show the relative abundance of A and P at Transfer 18 (N = 92) for the communities shown in Figure 2B. The gray shaded areas indicate the regions of low A and low P that are below the detection level of amplicon sequencing. In (C), overlaid are the trajectories of the relative abundance of A and P for all N = 19 communities shown in panel (A). The arrows become darker with time (i.e., from T1 to T18). At T0 (original inoculum), P was found at a relative abundance of 0.0086, whereas A was undetectable. We highlight four typical outcomes: the community explores the landscape and remains in the metastable state of low R/F (i), the community switches abruptly to the A dominated state (ii), the community explores the landscape and switches to the A dominated state (iii), and the community explores the landscape and switches to the P dominated state (iv).
Figure 5.
Figure 5.. Opening the system through migration leads to functional convergence
(A) Replicate communities all started from the same inoculum (and the same inoculum as in Figure 2) were assembled in an open system with global migration (N = 93)—that is, in addition to the normal transfer, each community received a small amount of migrants from a common migrant pool or with migration from the regional pool (i.e., inoculum) (N = 92) (STAR Methods). Communities were assembled under these migration scenarios for twelve growth cycles (T1–T12), after which migration was stopped, and communities were allowed to stabilize for six additional transfers without migration (T13–T18). (B) Community composition at Transfer 18. ESVs with a relative abundance ≤0.01 are shown as “other”. (C) R/F ratio of the communities at Transfer 18 for the no migration (Figure 2B), global migration, and regional migration (Figure 5B) treatments. Each dot represents a community and is colored by its taxonomic community state. The blue dots show communities mainly composed of fermenters, the yellow dots show communities where Alcaligenes is the dominant respirator, and the purple dots show communities where Pseudomonas is the dominant respirator. The gray shading area represents the interquartile range of the communities shown in Figure 1A.

References

    1. Aguirre de Cárcer D. (2019). A conceptual framework for the phylogenetically constrained assembly of microbial communities. Microbiome 7, 142. - PMC - PubMed
    1. Amor DR, Ratzke C, and Gore J. (2020). Transient invaders can induce shifts between alternative stable states of microbial communities. Sci. Adv 6, eaay 8676. - PMC - PubMed
    1. Arkin AP, Cottingham RW, Henry CS, Harris NL, Stevens RL, Maslov S, Dehal Paramvir, et al. (2018). KBase: The United States Department of Energy Systems Biology Knowledgebase. Nature Biotechnology 36(7), 566–569. - PMC - PubMed
    1. Axelrod K, Sanchez A, and Gore J. (2015). Phenotypic states become increasingly sensitive to perturbations near a bifurcation in a synthetic gene network. Elife 4, e07935. - PMC - PubMed
    1. Basan M, Hui S, Okano H, Zhang Z, Shen Y, Williamson JR, and Hwa T. (2015). Overflow Metabolism in Escherichia Coli Results from Efficient Proteome Allocation. Nature 528, 99–104. - PMC - PubMed

Publication types