. 2021 Nov 9;16(11):2690-2702.
doi: 10.1016/j.stemcr.2021.09.007. Epub 2021 Oct 14.

Allele-specific gene editing to rescue dominant CRX-associated LCA7 phenotypes in a retinal organoid model

Affiliations

Allele-specific gene editing to rescue dominant CRX-associated LCA7 phenotypes in a retinal organoid model

Kathleen R Chirco et al. Stem Cell Reports. .

Abstract

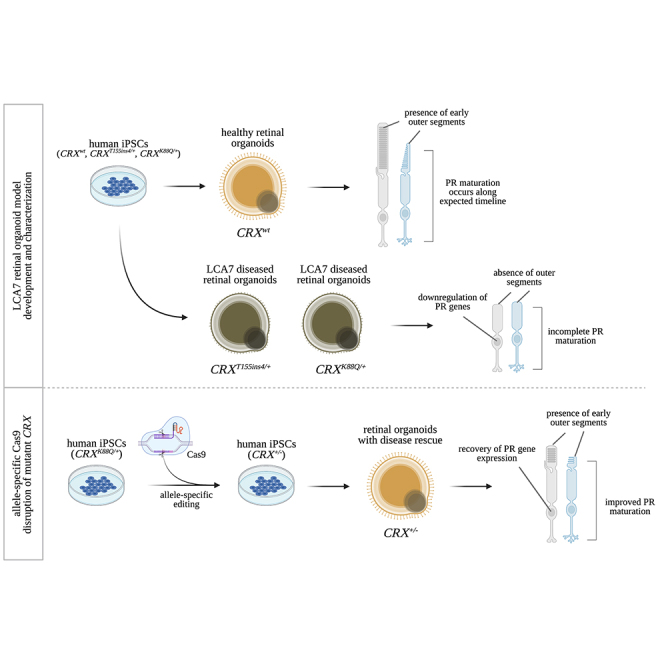
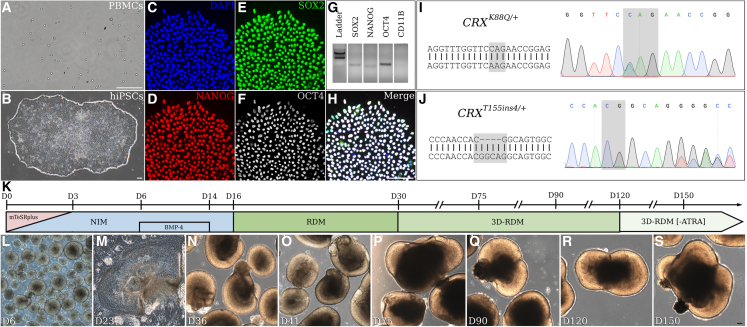
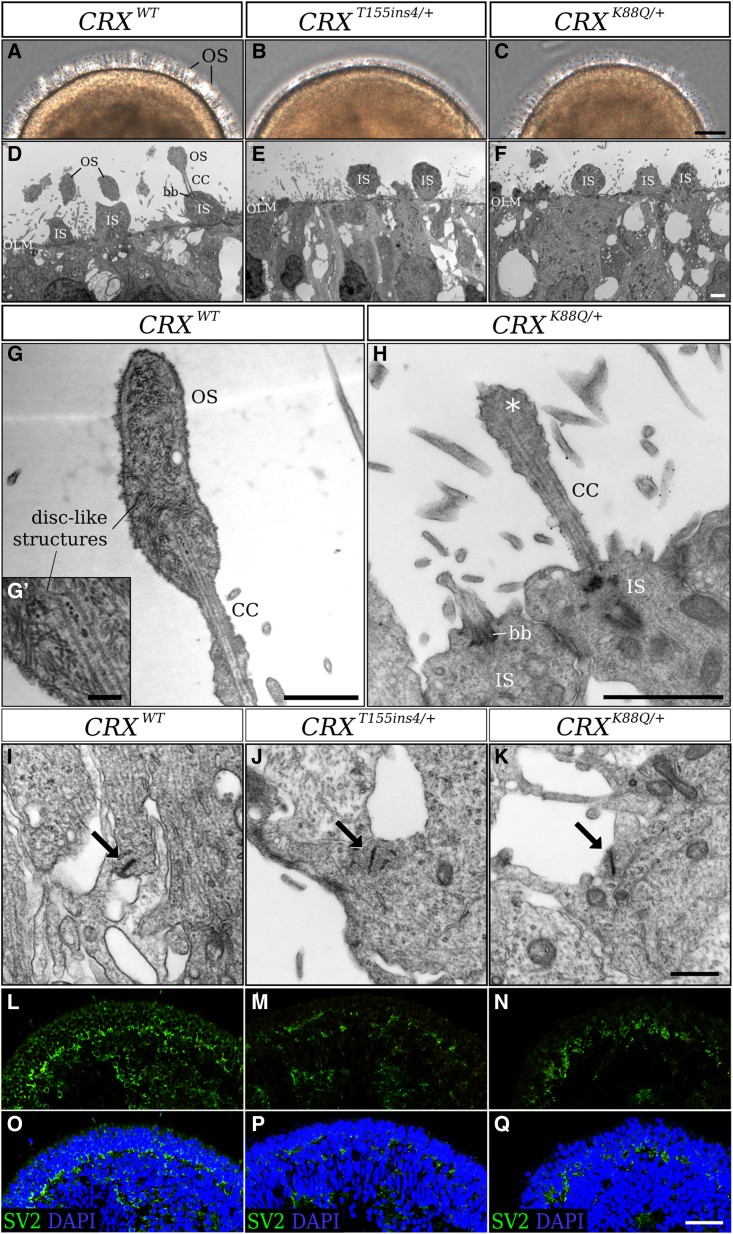
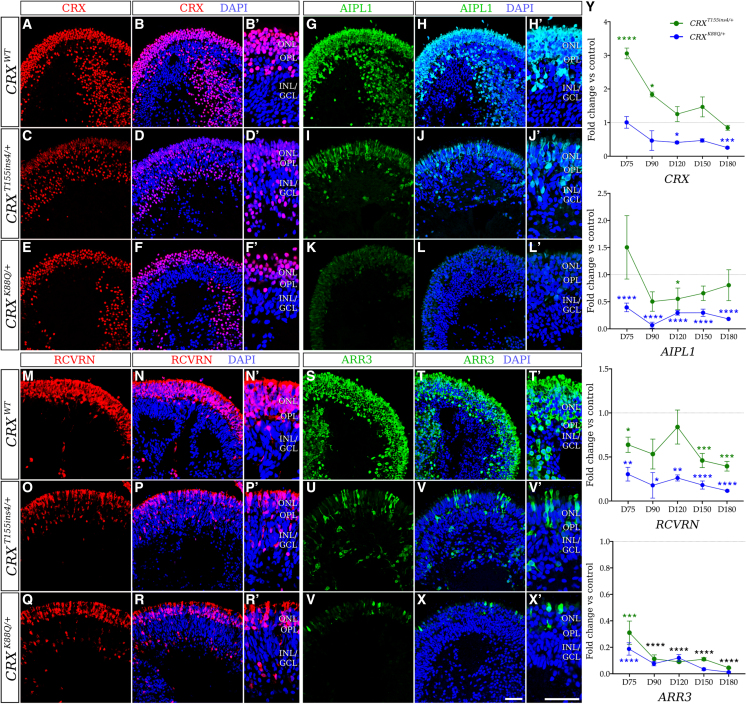
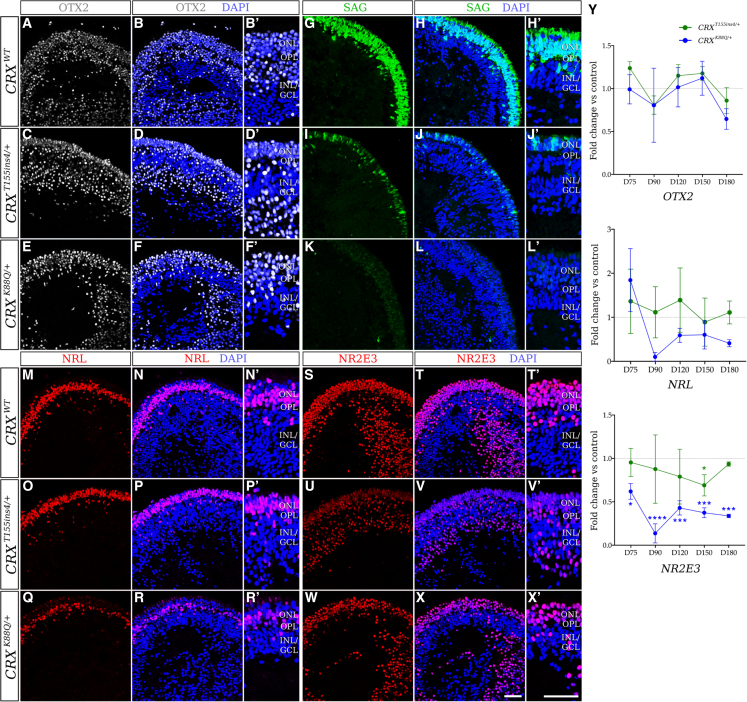
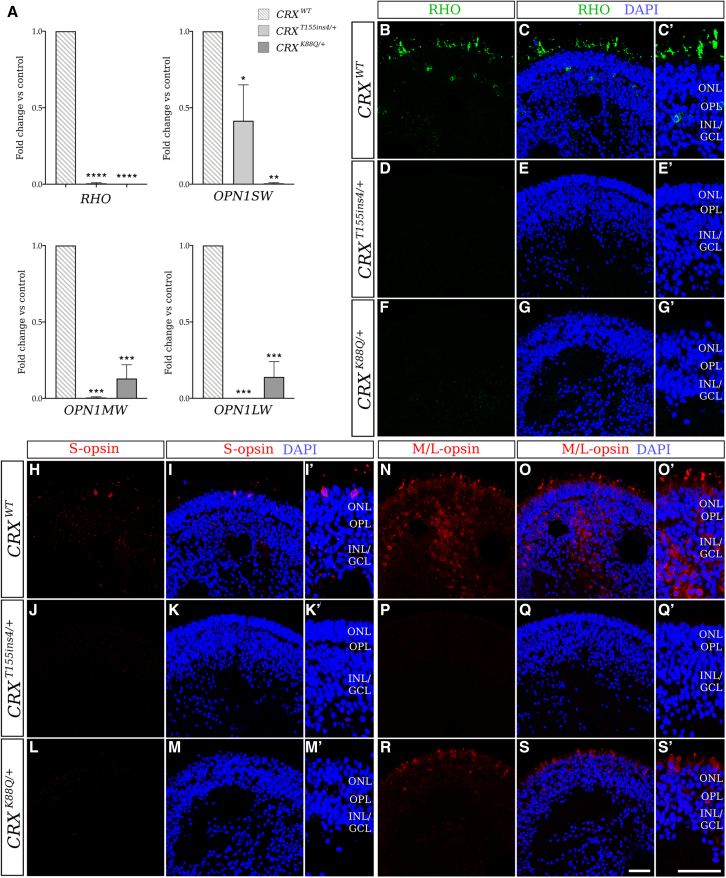
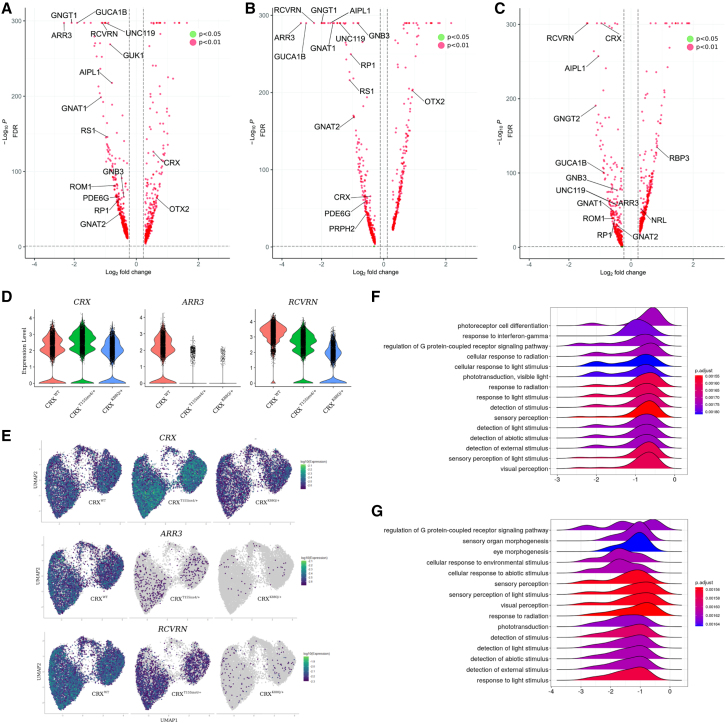
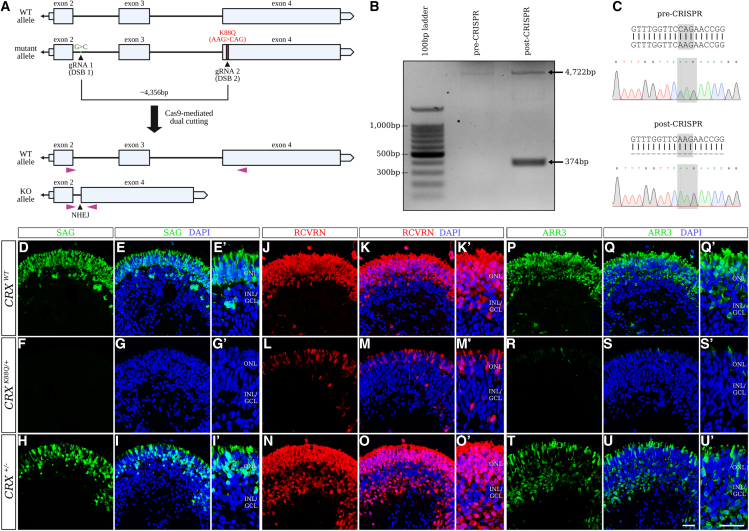
Cases of Leber congenital amaurosis caused by mutations in CRX (LCA7) exhibit an early form of the disease and show signs of significant photoreceptor dysfunction and eventual loss. To establish a translational in vitro model system to study gene-editing-based therapies, we generated LCA7 retinal organoids harboring a dominant disease-causing mutation in CRX. Our LCA7 retinal organoids develop signs of immature and dysfunctional photoreceptor cells, providing us with a reliable in vitro model to recapitulate LCA7. Furthermore, we performed a proof-of-concept study in which we utilize allele-specific CRISPR/Cas9-based gene editing to knock out mutant CRX and saw moderate rescue of photoreceptor phenotypes in our organoids. This work provides early evidence for an effective approach to treat LCA7, which can be applied more broadly to other dominant genetic diseases.

Keywords: CRISPR/Cas9; CRX; LCA7; Leber congenital amaurosis; allelic knockdown; gene editing; photoreceptors cells; retinal organoid; scRNA-seq.


Figures

None
Graphical abstract
Figure 1
Figure 1
Characterization and differentiation of patient iPSC lines (A–S) Patient PBMCs (A) were reprogrammed to generate stable hiPSC lines (B). Immunocytochemistry was performed with antibodies against NANOG (D), SOX2 (E) and OCT3/4 (F), and cells were counterstained with DAPI (C). The merged image is shown in (H). Primers for SOX2, NANOG, OCT4, and CD11B were utilized for RT-PCR analysis (G). Sanger sequencing results for hiPSCs to confirm the presence of the CRXK88Q/+ (I) and CRXT155ins4/+ (J) variants. The retinal differentiation protocol timeline is summarized in (K), and representative images of the differentiation process are shown for the control hiPSC line (CRXWT) in (L)–(S). Scale bar (A, B, H, and S), 100 μm.
Figure 2
Figure 2
Altered outer-segment morphology and synapse markers in patient hiPSC-derived LCA7 retinal organoids compared with control organoids at D180 (A–C) Phase-contrast images for CRXWT (A), CRXT155ins4/+ (B), and CRXK88Q/+ (C) retinal organoids at D180 of differentiation were taken along the edge of the organoids to show early outer-segment morphology. (D–K) TEM images for CRXWT (D), CRXT155ins4/+ (E), and CRXK88Q/+ (F) retinal organoids were collected at D180 (n = 1 organoid per line). Early outer segments for the CRXWT retinal organoids show disc-like structures at D180 (G, G′), whereas CRXK88Q/+ retinal organoids have underdeveloped outer-segment-like features (asterisk, H). TEM images show the formation of ribbon synapses (arrows) for CRXWT (I), CRXT155ins4/+ (J), and CRXK88Q/+ (K) at D180. (L–Q) Immunolabeling for SV2 (green) is shown for CRXWT (L and O), CRXT155ins4/+ (M and P), and CRXK88Q/+ (N and Q) at D180. DAPI counterstaining is shown in blue (O–Q). Scale bar (C), 10 μm; scale bars (D–H), 5 μm; scale bar (G′), 1 μm; scale bar (K), 500 nm; scale bar (Q), 100 μm. OS, outer segment; IS, inner segment; OLM, outer limiting membrane; CC, connecting cilium; bb, basal body. See also Figures S2 and S5.
Figure 3
Figure 3
Altered expression of early photoreceptor cell markers in patient hiPSC-derived LCA7 retinal organoids compared with control organoids at D180 (A–Y) qRT-PCR data (I) are shown for CRXT155ins4/+ (green line) and CRXK88Q/+ (blue line) at D75, D90, D120, D150, and D180 as fold change compared with control organoids for CRX, AIPL1, RCVRN, and ARR3 (n = 14 total organoids from two experimental replicates per line, per time point). The dotted line represents no change compared with control (y = 1). Immunofluorescence staining using antibodies against CRX (red; J–O′), AIPL1 (green; P–U′), RCVRN (red; V–AA′), and ARR3 (green; AB–AG′) are shown for control (CRXWT; J–K′, P–Q′, V–W′, AB–AC′), CRXT155ins4/+ (L–M′, R–S′, X–Y′, AD–AE′), and CRXK88Q/+ (N–O′, T–U′, Z–AA′, AF–AG′) retinal organoids at D180 (n = 9 total organoids from three experimental replicates per line). Nuclei are counterstained with DAPI (blue). Scale bar (AG and AG′), 100 μm. OPL, outer plexiform layer; INL/GCL, inner nuclear layer/ganglion cell layer. p < 0.05, ∗∗p < 0.01, ∗∗∗p < 0.005, ∗∗∗∗p < 0.001. All statistical analyses were performed using one-way ANOVA with a Dunnett test to correct for multiple comparisons in GraphPad Prism 8 software. See also Figures S3, S4, and S7.
Figure 4
Figure 4
Altered expression of rod photoreceptor cell markers in LCA7 retinal organoids at D180 (A–Y) Immunofluorescence staining using antibodies against OTX2 (white; A–F′), SAG (green; G–L′), NRL (red; M–R′), and NR2E3 (red; S–X′) are shown for control (CRXWT; A–B′, G–H′, M–N′, S–T′), CRXT155ins4/+ (C–D′, I–J′, O–P′, U–V′), and CRXK88Q/+ (E–F′, K–L′, Q–R′, W–X′) retinal organoids at D180 (n = 9 total organoids from three experimental replicates per line). Nuclei are counterstained with DAPI (blue). OPL, outer plexiform layer; INL/GCL, inner nuclear layer/ganglion cell layer. qRT-PCR data (Y) are shown for CRXT155ins4/+ (green line) and CRXK88Q/+ (blue line) at D75, D90, D120, D150, and D180 as fold change compared with control organoids for OTX2, NRL, and NR2E3 (n = 14 total organoids from two experimental replicates per line). The dotted line represents no change compared with control (y = 1). All statistical analyses were performed using one-way ANOVA with a Dunnett test to correct for multiple comparisons in GraphPad Prism 8 software. Scale bar (X and X′), 100 μm. p < 0.05, ∗∗∗p < 0.005, ∗∗∗∗p < 0.001. See also Figures S3, S4, and S7.
Figure 5
Figure 5
qRT-PCR and immunofluorescence staining reveal significant downregulation of late photoreceptor cell markers in LCA7 organoids at D180 (A–S′) qRT-PCR data (A) are shown for CRXWT (gray lines), CRXT155ins4/+ (light gray), and CRXK88Q/+ (dark gray) at D180 as fold change compared with control organoids for RHO, OPN1SW, OPN1MW, and OPN1LW (n = 14 total organoids from two experimental replicates per line). p < 0.05, ∗∗p < 0.01, ∗∗∗p < 0.005, ∗∗∗∗p < 0.001. Immunofluorescence staining using antibodies against RHO (green; B–G′), S-opsin (red; H–M′), and M/L-opsin (green; N–S′) is shown for control (CRXWT; B–C′, H–I′, N–O′), CRXT155ins4/+ (D–E′, J–K′, P–Q′), and CRXK88Q/+ (F–G′, L–M′, R–S′) retinal organoids at D180 (n = 9 total organoids from three experimental replicates per line). Nuclei are counterstained with DAPI (blue). Scale bar (S and S′), 100 μm. OPL, outer plexiform layer; INL/GCL, inner nuclear layer/ganglion cell layer. All statistical analyses were performed using one-way ANOVA with a Dunnett test to correct for multiple comparisons in GraphPad Prism 8 software. See also Figures S3 and S4.
Figure 6
Figure 6
scRNA-seq of D150 reveals changes to photoreceptor transcripts in LCA7 versus control organoids (A–G) Volcano plots comparing CRXT155ins4/+ transcripts with those of control organoids (A), CRXK88Q/+ transcripts to those of control (B), and CRXK88Q/+ to CRXT155ins4/+ transcripts (C). Green dots represent genes with a log2 fold change >0.2 and an adjusted p value of p < 0.05. Red dots represent genes with a log2 fold change >0.2 and an adjusted p value of <0.01. Expression levels for CRX, ARR3, and RCVRN are shown as violin plots (D) for control (CRXWT, red), CRXT155ins4/+ (green), and CRXK88Q/+ (blue). UMAP graphs for CRX, ARR3, and RCVRN transcripts are also shown for all three genotypes (E). GSEA was performed for genes with significantly altered expression in CRXT155ins4/+ (F) and CRXK88Q/+ (G) organoids, and data for the top 15 categories are shown via ridge plots. The x axis represents fold change, and the y axis represents the number of genes. Libraries were prepared using n = 5 organoids per line. Statistical analyses were performed using the Wilcoxon rank-sum test and genes with log2 fold change of ≥0.25 and a p value <0.05 were considered significant. See also Figure S5.
Figure 7
Figure 7
CRISPR/Cas9-mediated knockout of the mutant CRX allele in patient hiPSC (A–C) The CRISPR/Cas9 dual-cutting target sites are mapped onto the mutant allele of the CRX gene (A). PCR was performed using primers shown in (A; purple triangles), revealing an additional 374-bp band representing the edited “knockout (KO) allele” after CRISPR/Cas9 editing (B). Sanger sequencing was also utilized to confirm loss of the K88Q mutation after CRISPR-mediated editing (C). (D–U′) Immunofluorescence staining using antibodies against SAG (green; D–I′), RCVRN (red; J–O′), and ARR3 (green; P–U′) are shown for control (CRXWT; D–E′, J–K′, and P–Q′), CRXK88Q/+ (F–G′, L–M′, and R–S′), and CRX+/− (H–I′, N–O′, and T–U′) retinal organoids at D180 (n = 3 organoids per line). Nuclei are counterstained with DAPI (blue). Scale bars (U and U′), 100 μm. OPL, outer plexiform layer; INL/GCL, inner nuclear layer/ganglion cell layer. See also Figures S6 and S7.

References

    1. Artero Castro A., Rodríguez Jimenez F.J., Jendelova P., Erceg S. Deciphering retinal diseases through the generation of three dimensional stem cell-derived organoids: Concise Review. Stem Cells. 2019;37:1496–1504. doi: 10.1002/stem.3089. - DOI - PMC - PubMed
    1. Assawachananont J., Kim S.-Y., Kaya K.D., Fariss R., Roger J.E., Swaroop A. Cone-rod homeobox CRX controls presynaptic active zone formation in photoreceptors of mammalian retina. Hum. Mol. Genet. 2018;27:3555–3567. doi: 10.1093/hmg/ddy272. - DOI - PMC - PubMed
    1. Cao J., Spielmann M., Qiu X., Huang X., Ibrahim D.M., Hill A.J., Zhang F., Mundlos S., Christiansen L., Steemers F.J., et al. The single-cell transcriptional landscape of mammalian organogenesis. Nature. 2019;566:496–502. doi: 10.1038/s41586-019-0969-x. - DOI - PMC - PubMed
    1. Capowski E.E., Samimi K., Mayerl S.J., Phillips M.J., Pinilla I., Howden S.E., Saha J., Jansen A.D., Edwards K.L., Jager L.D., et al. Reproducibility and staging of 3D human retinal organoids across multiple pluripotent stem cell lines. Development. 2019;146 doi: 10.1242/dev.171686. - DOI - PMC - PubMed
    1. Corbo J.C., Lawrence K.A., Karlstetter M., Myers C.A., Abdelaziz M., Dirkes W., Weigelt K., Seifert M., Benes V., Fritsche L.G., et al. CRX ChIP-seq reveals the cis-regulatory architecture of mouse photoreceptors. Genome Res. 2010;20:1512–1525. doi: 10.1101/gr.109405.110. - DOI - PMC - PubMed

Publication types

MeSH terms