

Life expectancy and risk of death in 6791 communities in England from 2002 to 2019: high-resolution spatiotemporal analysis of civil registration data
- PMID: 34653419
- PMCID: PMC8554392
- DOI: 10.1016/S2468-2667(21)00205-X
Life expectancy and risk of death in 6791 communities in England from 2002 to 2019: high-resolution spatiotemporal analysis of civil registration data
Abstract
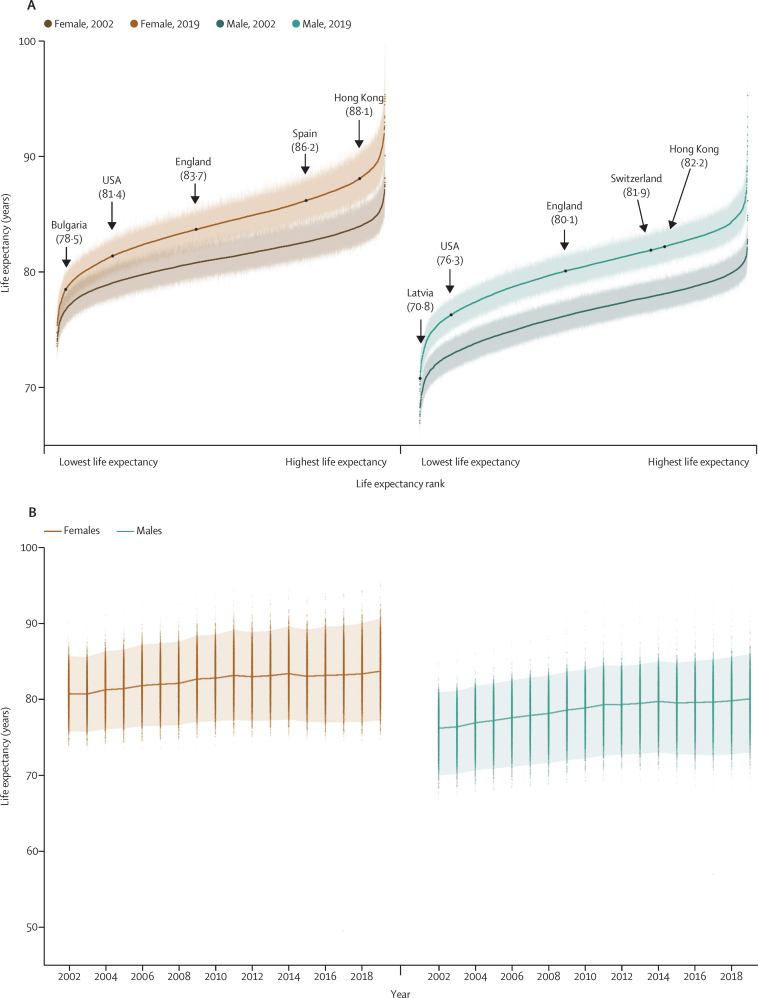
Background: High-resolution data for how mortality and longevity have changed in England, UK are scarce. We aimed to estimate trends from 2002 to 2019 in life expectancy and probabilities of death at different ages for all 6791 middle-layer super output areas (MSOAs) in England.
Methods: We performed a high-resolution spatiotemporal analysis of civil registration data from the UK Small Area Health Statistics Unit research database using de-identified data for all deaths in England from 2002 to 2019, with information on age, sex, and MSOA of residence, and population counts by age, sex, and MSOA. We used a Bayesian hierarchical model to obtain estimates of age-specific death rates by sharing information across age groups, MSOAs, and years. We used life table methods to calculate life expectancy at birth and probabilities of death in different ages by sex and MSOA.
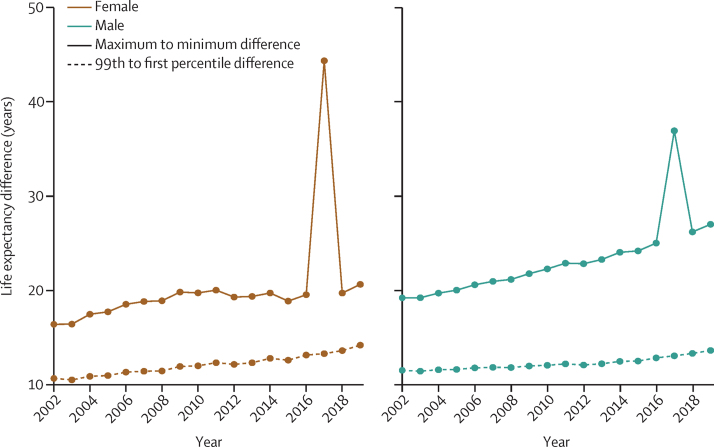
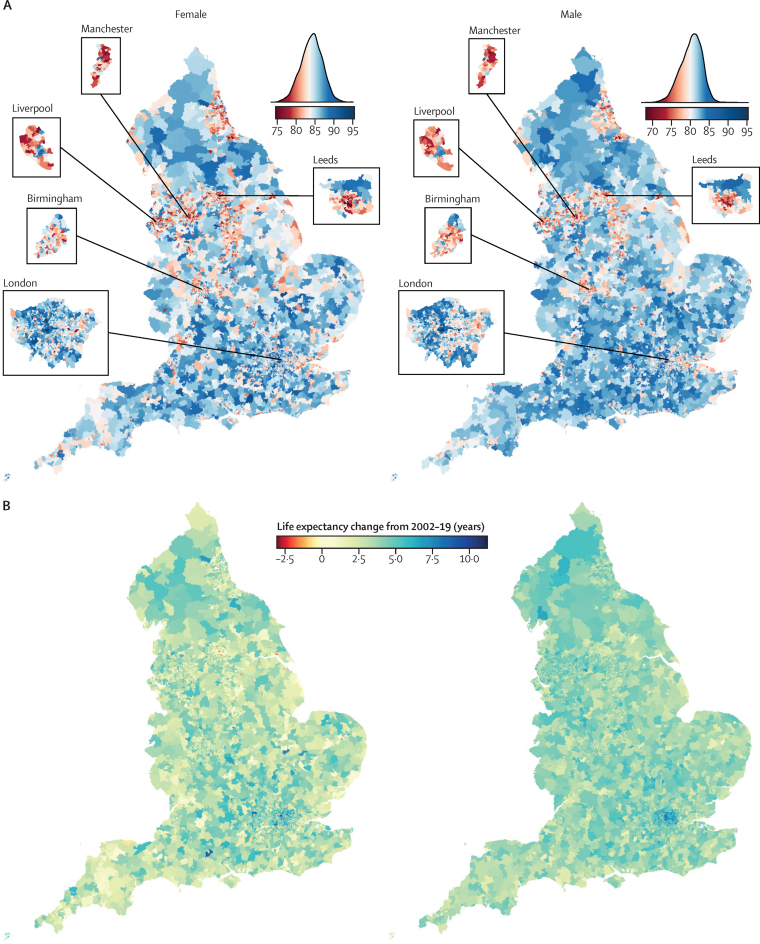
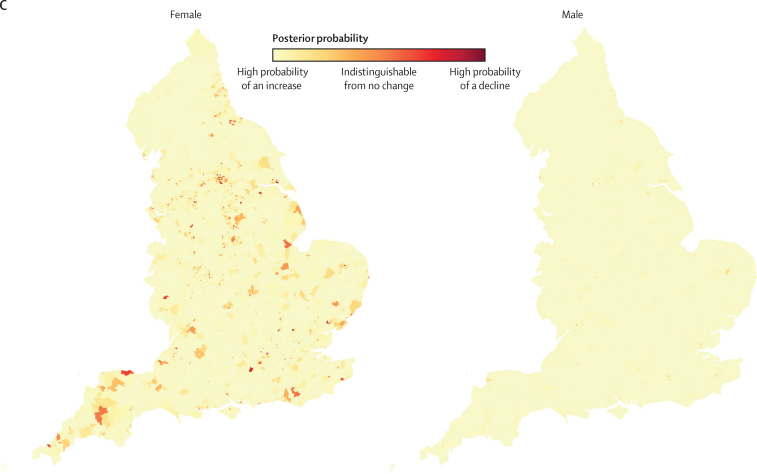
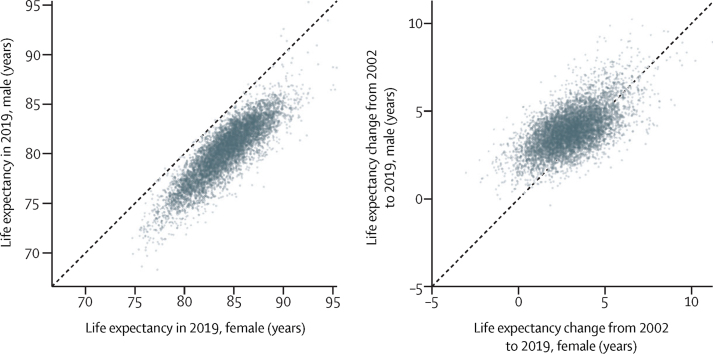
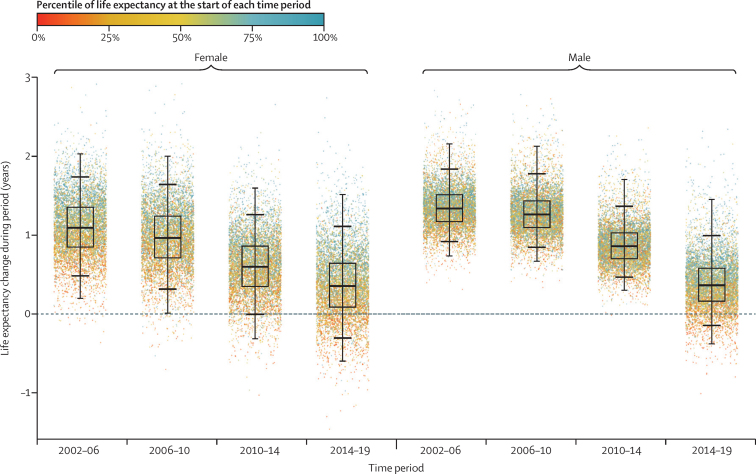
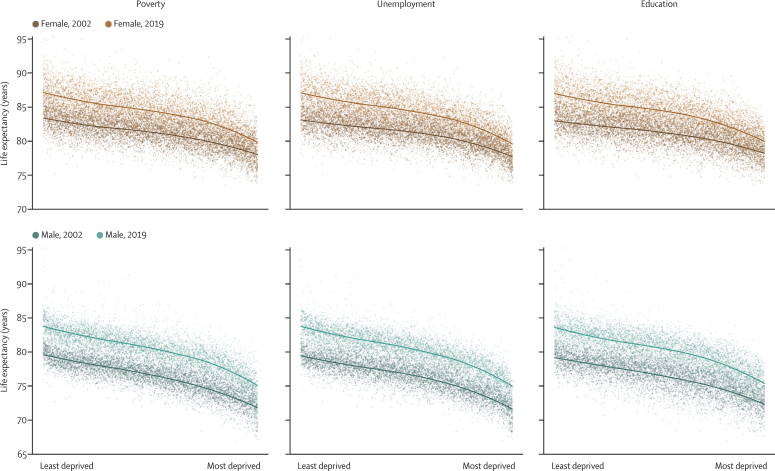
Findings: In 2002-06 and 2006-10, all but a few (0-1%) MSOAs had a life expectancy increase for female and male sexes. In 2010-14, female life expectancy decreased in 351 (5·2%) of 6791 MSOAs. By 2014-19, the number of MSOAs with declining life expectancy was 1270 (18·7%) for women and 784 (11·5%) for men. The life expectancy increase from 2002 to 2019 was smaller in MSOAs where life expectancy had been lower in 2002 (mostly northern urban MSOAs), and larger in MSOAs where life expectancy had been higher in 2002 (mostly MSOAs in and around London). As a result of these trends, the gap between the first and 99th percentiles of MSOA life expectancy for women increased from 10·7 years (95% credible interval 10·4-10·9) in 2002 to reach 14·2 years (13·9-14·5) in 2019, and for men increased from 11·5 years (11·3-11·7) in 2002 to 13·6 years (13·4-13·9) in 2019.
Interpretation: In the decade before the COVID-19 pandemic, life expectancy declined in increasing numbers of communities in England. To ensure that this trend does not continue or worsen, there is a need for pro-equity economic and social policies, and greater investment in public health and health care throughout the entire country.
Funding: Wellcome Trust, Imperial College London, Medical Research Council, Health Data Research UK, and National Institutes of Health Research.
Copyright © 2021 The Author(s). Published by Elsevier Ltd. This is an Open Access article under the CC BY 4.0 license. Published by Elsevier Ltd.. All rights reserved.
Conflict of interest statement
Declaration of interests ME reports a charitable grant from the AstraZeneca Young Health Programme, and personal fees from Prudential, outside the submitted work. JP-S is vice-chair of the Royal Society for Public Health and a partner at Lane Clark & Peacock, and reports personal fees from Novo Nordisk, all outside the submitted work. YD is a member of the advisory group for the King's Fund. All other authors declare no competing interests.
Figures
Comment in
-
Widening life expectancy inequalities across small areas of England.Lancet Public Health. 2021 Nov;6(11):e783-e784. doi: 10.1016/S2468-2667(21)00227-9. Epub 2021 Oct 13. Lancet Public Health. 2021. PMID: 34653418 No abstract available.
References
-
- Joyce R, Xu X. Inequalities in the twenty-first century: introducing the IFS Deaton Review. Institute for Fiscal Studies. 2019. https://www.ifs.org.uk/inequality/chapter/briefing-note/
-
- Marmot MG, Allen J, Boyce T, Goldblatt P, Morrison J. Health equity in England: the Marmot review 10 years on. 2020. https://www.health.org.uk/publications/reports/the-marmot-review-10-year... - PubMed
-
- Public Health England Disparities in the risk and outcomes of COVID-19. 2020. https://www.gov.uk/government/publications/covid-19-review-of-disparitie...
Publication types
MeSH terms
Grants and funding
LinkOut - more resources
Full Text Sources
Research Materials
Miscellaneous
