. 2022 Jan;33(1):42-56.
doi: 10.1016/j.annonc.2021.09.021. Epub 2021 Oct 13.

Distinct tumor-infiltrating lymphocyte landscapes are associated with clinical outcomes in localized non-small-cell lung cancer

Affiliations

Distinct tumor-infiltrating lymphocyte landscapes are associated with clinical outcomes in localized non-small-cell lung cancer

L Federico et al. Ann Oncol. 2022 Jan.

Abstract

Background: Despite the importance of tumor-infiltrating T lymphocytes (TILs) in cancer biology, the relationship between TIL phenotypes and their prognostic relevance for localized non-small-cell lung cancer (NSCLC) has not been well established.

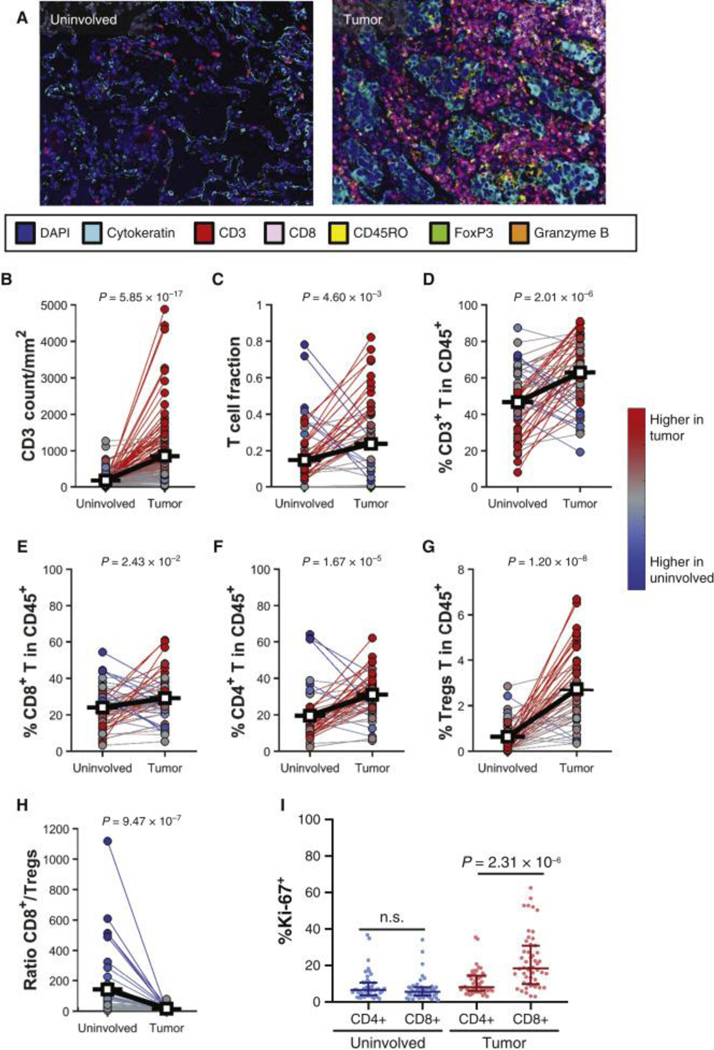
Patients and methods: Fresh tumor and normal adjacent tissue was prospectively collected from 150 patients with localized NSCLC. Tissue was comprehensively characterized by high-dimensional flow cytometry of TILs integrated with immunogenomic data from multiplex immunofluorescence, T-cell receptor sequencing, exome sequencing, RNA sequencing, targeted proteomics, and clinicopathologic features.

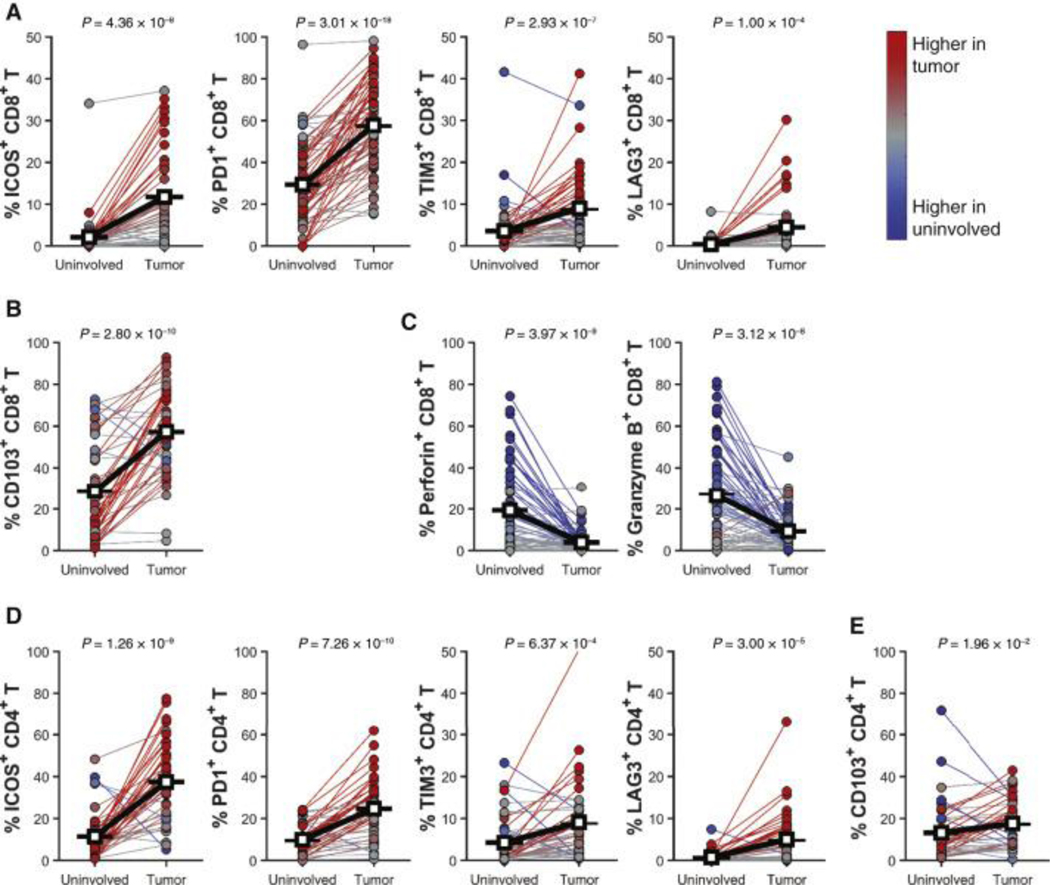
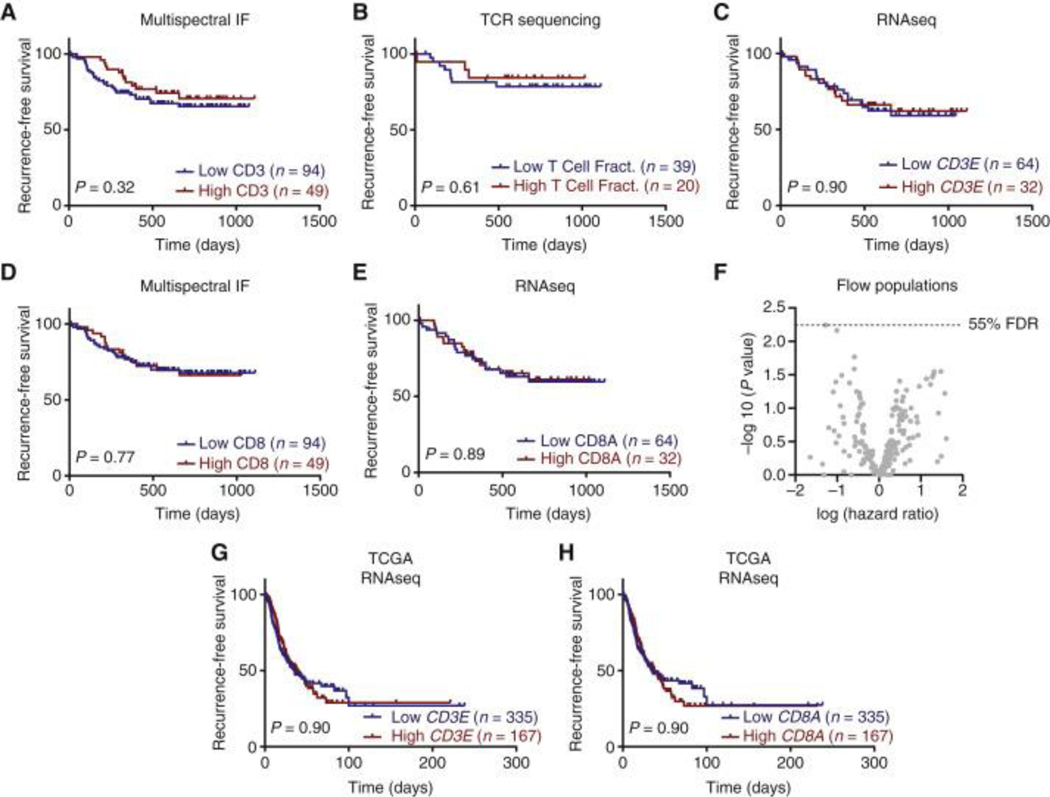
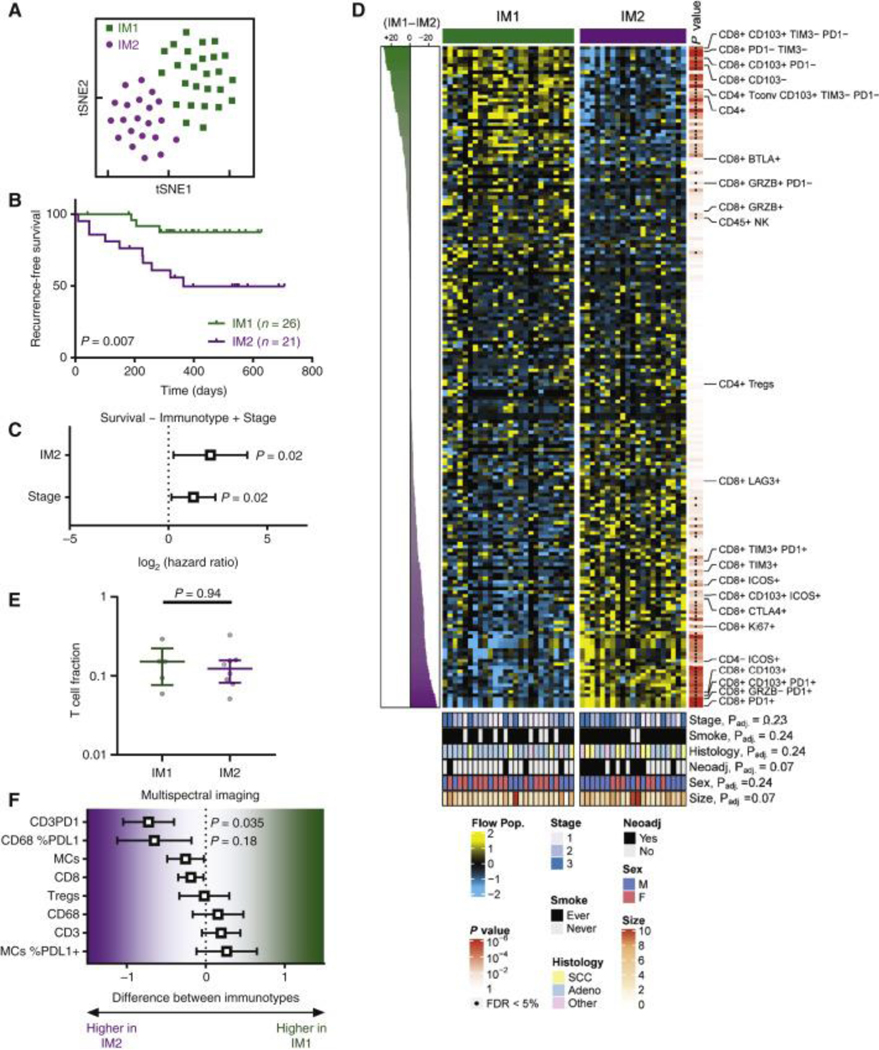
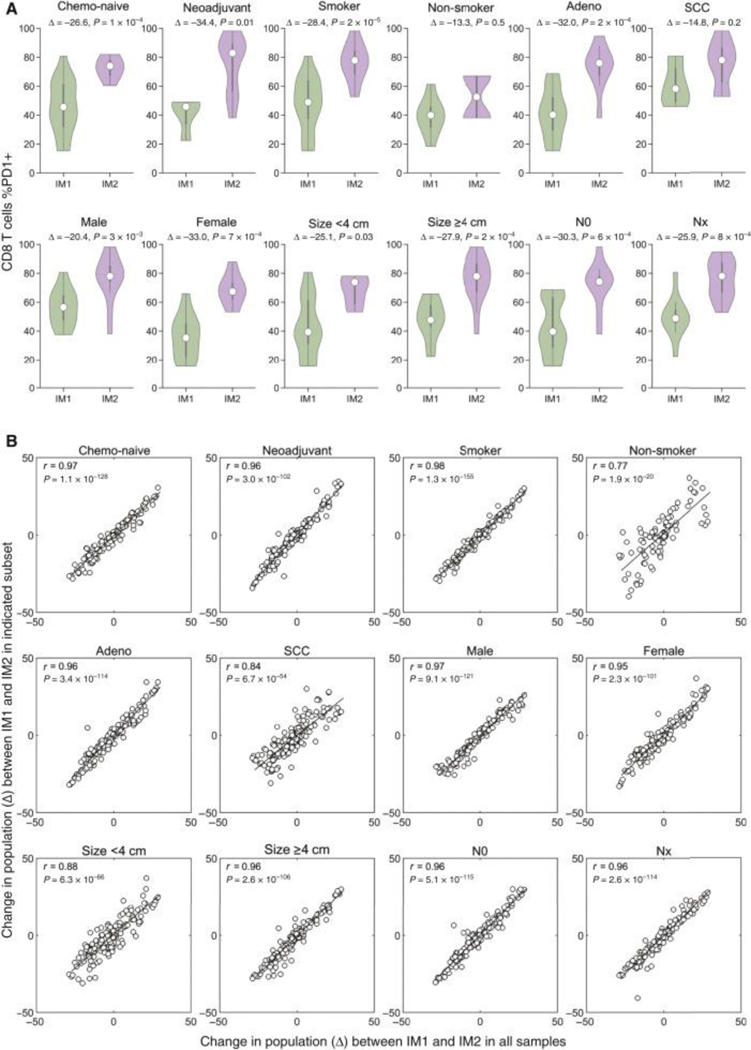
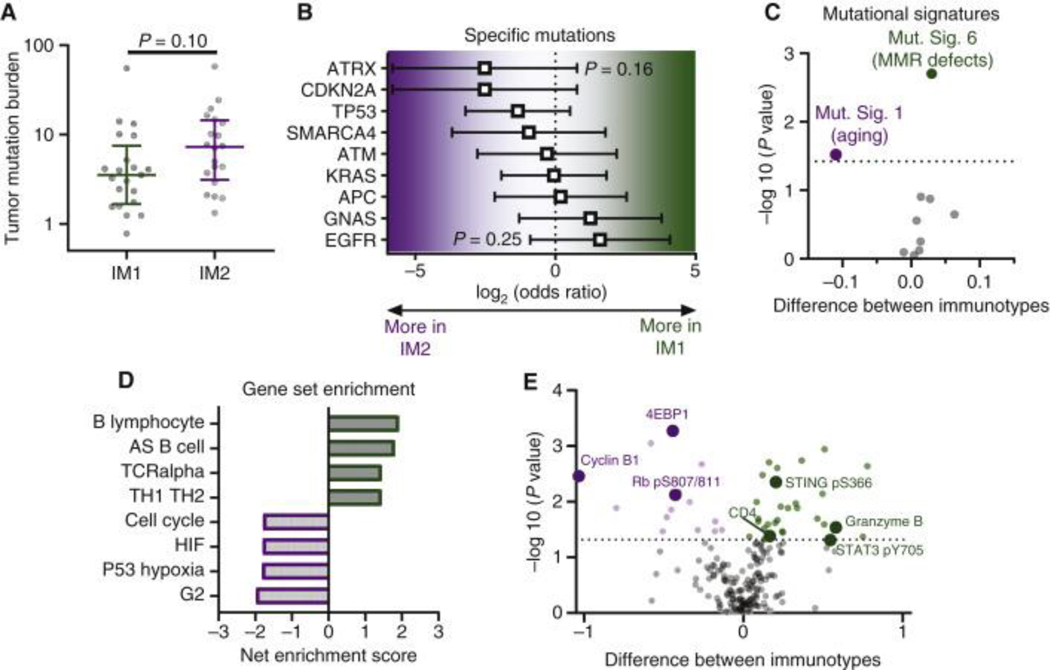
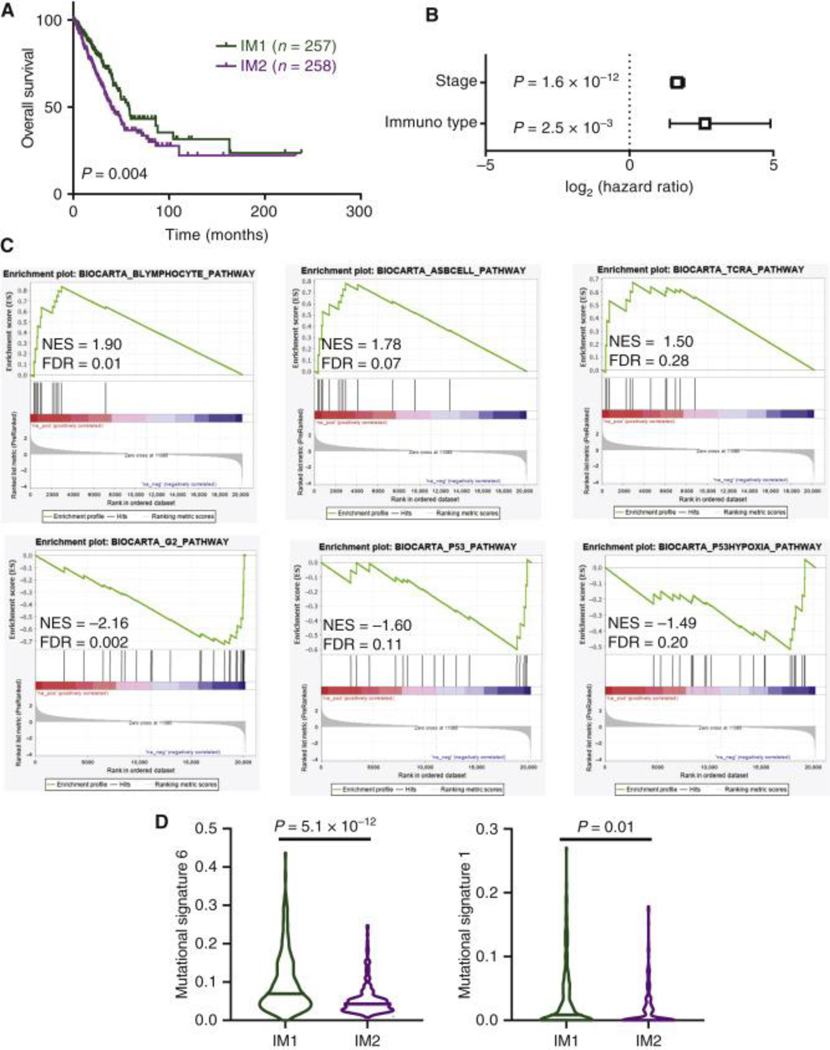
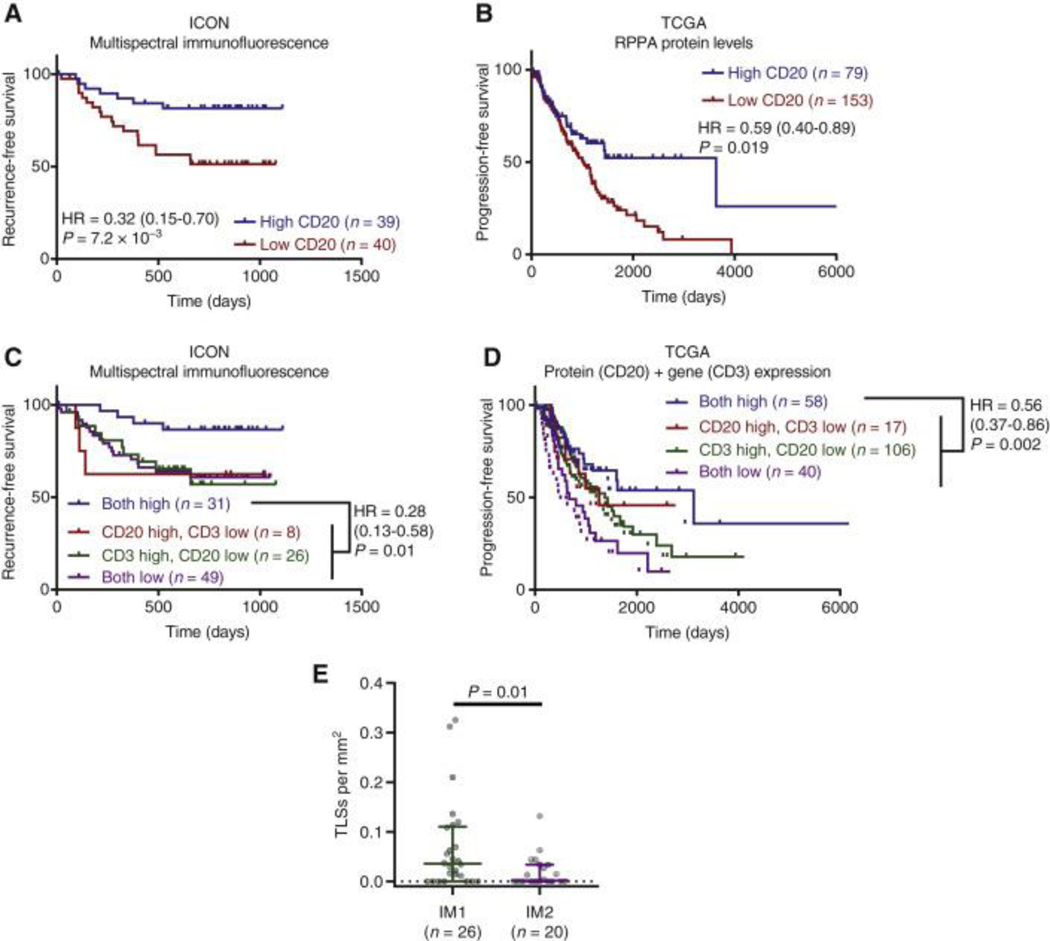
Results: While neither the magnitude of TIL infiltration nor specific TIL subsets were significantly prognostic alone, the integration of high-dimensional flow cytometry data identified two major immunotypes (IM1 and IM2) that were predictive of recurrence-free survival independent of clinical characteristics. IM2 was associated with poor prognosis and characterized by the presence of proliferating TILs expressing cluster of differentiation 103, programmed cell death protein 1, T-cell immunoglobulin and mucin-domain containing protein 3, and inducible T-cell costimulator. Conversely, IM1 was associated with good prognosis and differentiated by an abundance of CD8+ T cells expressing cytolytic enzymes, CD4+ T cells lacking the expression of inhibitory receptors, and increased levels of B-cell infiltrates and tertiary lymphoid structures. While increased B-cell infiltration was associated with good prognosis, the best prognosis was observed in patients with tumors exhibiting high levels of both B cells and T cells. These findings were validated in patient tumors from The Cancer Genome Atlas.

Conclusions: Our study suggests that although the number of infiltrating T cells is not associated with patient survival, the nature of the infiltrating T cells, resolved in distinct TIL immunotypes, is prognostically relevant in NSCLC and may inform therapeutic approaches to clinical care.

Keywords: T cells; biomarkers; immune system; lung cancer; microenvironment.


Conflict of interest statement

Disclosure CB has received research funding from Iovance Biotherapeutics and has participated in advisory committees for Myst Therapeutics and Turnstone Biologics. DLG has received research funding from AstraZeneca, Astellas, Janssen, Ribon Therapeutics, Takeda, and NGM Biopharmaceuticals, reports advisory role/consulting fees from AstraZeneca, Sanofi, Menarini Ricerche, and Eli Lilly, and research funding to MD Anderson Cancer Center from Boehringer Ingelheim. CH served on the advisory board for Briacell. SS has participated in advisory committees for Ethicon and for the Peter MacCallum Cancer Center. JVH has received research support from AstraZeneca, Bayer, GlaxoSmithKline, and Spectrum; participated in advisory committees for AstraZeneca, Boehringer Ingelheim, Exelixis, Genentech, GlaxoSmithKline, Guardant Health, Hengrui, Lilly, Novartis, Specrtum, EMD Serono, and Synta; and received royalties and/or licensing fees from Spectrum. TC has received speaker fees/honoraria from The Society for Immunotherapy of Cancer, Bristol Myers Squibb, Roche and Medscape Oncology, reports advisory role/consulting fees from MedImmune, AstraZeneca, Bristol Myers Squibb, EMD Serono, Merck & Co., Genentech, and Arrowhead Pharmaceuticals, and research funding to MD Anderson Cancer Center from Boehringer Ingelheim, MedImmune, AstraZeneca, Bristol Myers Squibb, and EMD Serono. JZ served on advisory board for AstraZeneca and Geneplus and received speaker’s fees from BMS, Geneplus, OrigMed, Innovent, grants from Merck, Johnson and Johnson from outside the submitted work. All other authors have declared no conflicts of interest.

Figures

Figure 1.
Figure 1.. T-cell frequency is increased in tumors.
(A, B) Representative image of immune cell infiltration in uninvolved lung tissue and tumor analyzed using multiplex immunofluorescence (mIF, A), and quantification of CD3+ cells (n = 139, B). (C) T-cell receptor sequencing examining the T-cell fraction in uninvolved lung tissue and tumor as defined by immunoSEQ (n = 55). (D-I) Percentages of T lymphocytes within CD45+ cells in uninvolved lung tissue and tumor, n = 58, as measured by flow cytometry. (D) Percentage of CD3+ T cells. (E) Percentage of CD8+ T cells. (F) Percentage of CD4+ T cells. (G) Percentage of CD4+CD25hiFoxP3+ Tregs. (H) Ratio of CD8/Tregs from uninvolved lung tissue and tumor. (I) Percentages of proliferating (Ki-67+) CD4+ and CD8+ T cells in uninvolved lung tissue and tumor. Differences between the two groups were calculated with a signed-rank (B-H) or one-way analysis of variance (I).
Figure 2.
Figure 2.. Tumor-infiltrating T lymphocytes are activated and express checkpoint molecules at higher levels.
(A) Percentage of ICOS+CD8+, PD1+CD8+, TIM3+CD8+, and LAG3+CD8+ T cells within CD3+ T cells in tumor and uninvolved matched tissues (n = 45). (B) Percentage of CD103+CD8+ T cells in tumor and uninvolved matched tissues (n = 45). (C) Percentage of Perforin+CD8+ and granzyme B+CD8+ T cells in tumor and uninvolved matched tissues (n = 66). (D) Percentage of ICOS+CD4+, PD1+CD4+, TIM3+CD4+, and LAG3+CD4+ T cells within CD3+ T cells in tumor and uninvolved matched tissues (n = 43). (E) Percentage of CD103+CD4+ T cells in tumor and uninvolved matched tissues (n = 43). All panels represent flow cytometry data on freshly disaggregated tissue. Paired Student’s t-test was used to determine significance for all comparisons.
Figure 3.
Figure 3.. Tumor-infiltrating T-lymphocyte infiltration and individual subpopulations cannot predict survival.
(A-E) Kaplan–Meier curves and log-rank P values showing recurrence-free survival for non-small-cell lung cancer patients with high (upper tertile, red) and low levels (lower two tertiles, blue) of (A) CD3 T cells (cells/mm2) defined by multiplex immunofluorescence (mIF). (B) T-cell fraction defined by ImmunoSeq. (C) CD3E transcript defined by RNA Sequencing. (D) CD8 T cells (cells/mm2) defined by mIF. (E) CD8A transcript defined by RNA Sequencing. (F) Volcano plot showing hazard ratios for all immune populations determined by flow cytometry using Cox proportional hazards model considering stage as a covariate. Benjamini–Hochberg procedure used to correct for multiple comparisons. (G, H) Survival in The Cancer Genome Atlas (TGCA) patients based on CD3E (G) and CD8A (H) transcript levels split into high (upper tertile, red) and low (lower two tertiles, blue). Log-rank test was used to determine significance. FDR, false discovery rate.
Figure 4.
Figure 4.. Immunotype determined by tumor-infiltrating T lymphocyte composition is prognostic in non-small-cell lung cancer (NSCLC).
(A) tSNE showed that tumors from NSCLC patients (n = 47) could be assigned to two major immunotypes (IM1 and IM2). (B) Kaplan–Meier curves showing recurrence-free survival (RFS) in IM1 (green, n = 26) and IM2 (purple, n = 21) tumors. (C) Multivariate Cox proportional hazards model for RFS based on immunotype and tumor stage. (D) Heat map showing all immune populations measured by flow cytometry, with significance indicated to the right of the heat map and clinical parameters indicated at the bottom of the heat map. (E) T-cell fraction determined by immunoSEQ in IM1 and IM2 patients. Median with interquartile range. Rank-sum P value is shown. (F) Malignant cells (MCs), CD8, regulatory T cells (CD3+CD8Foxp3+), CD68 (macrophages), CD3, CD3PD1, CD68 %PDL1, and MCs %PDL1 expression were analyzed using multiplex immunofluorescence in IM1 and IM2 patients. Values are shown as mean difference with 95% confidence interval. PD-1, programmed cell death protein 1; PD-L1, programmed death-ligand 1; Tregs, regulatory T cells.
Figure 5.
Figure 5.. Immunotype changes are conserved across different patient subsets.
(A) Comparison of percentage of CD8 T cells positive for PD1 between IM1 and IM2 in indicated subsets of patients. White dot indicates median value, Δ indicates difference in %PD1+ CD8+ T cells between groups. Rank-sum test. (B) Plots comparing the difference (Δ) in all immune cell populations between IM1 and IM2 observed in the entire set of patients analyzed (x-axis) and to the difference observed in indicated subsets of patients (y-axis). Pearson correlation coefficient (r) and corresponding P value (inset). N0, no evidence of regional node involvement; NX, any evidence of lymph node involvement; SCC, squamous cell carcinoma.
Figure 6.
Figure 6.. Molecular characterization of IM1 versus IM2 in the ICON cohort.
(A) Tumor mutation burden in IM1 (n = 21) and IM2 (n = 20) tumors. Median with interquartile range and P value by rank-sum test. (B) Comparison of mutation frequency for specific genes between IM1 (n = 21) and IM2 (n = 20) by Fisher’s exact test. Odds ratio shown with 95% confidence interval. (C) Volcano plot showing difference in various mutational signatures between IM1 (n = 21) and IM2 (n = 20) tumors. Rank-sum test with Benjamini–Hochberg false discovery rate (FDR). Dotted line indicates 10% FDR. (D) Gene set enrichment analysis of differential gene expression between IM1 (n = 15) and IM2 (n = 13) tumors. Pathways enriched in IM1 have positive scores and pathways enriched in IM2 have negative scores. (E) Volcano plot showing proteins differentially expressed between IM1 (n = 24) and IM2 (n = 21) tumors. Rank-sum test with Benjamini–Hochberg FDR. Dotted line indicates 10% FDR. MMR, mismatch repair.
Figure 7.
Figure 7.. Validation of IM1 and IM2 phenotypes in The Cancer Genome Atlas (TCGA) patients.
(A) Overall survival in TCGA patients based on predicted immunotype. Log-rank P value. (B) Multivariate survival analysis controlling for tumor stage using Cox proportional hazards model in TCGA patients. (C) Gene set enrichment analysis plots for pathways previously identified in the ICON cohort (Figure 6D). (D) Differences in mutational signatures identified as differentially enriched in the ICON cohort (Figure 6C). IM1, n = 228; IM2, n = 242. Rank-sum test. Line indicates median value. FDR, false discovery rate; NES, net enrichment score.
Figure 8.
Figure 8.. Best prognosis is observed with high levels of both B cells and T cells.
(A) Recurrence-free survival (RFS) of patients from the ICON cohort with high versus low abundance of CD20+ B cells determined by multiplex immunofluorescence (mIF). (B) Progression-free survival (PFS) of patients from The Cancer Genome Atlas (TCGA) stratified by CD20 protein levels determined using reverse-phase protein array (RPPA). (C) RFS of patients from the ICON cohort with high levels of both CD20+ B cells and CD3+ T cells, high levels of only one immune cell population, or low levels of both populations as determined by mIF. (D) PFS of patients from TCGA stratified by high levels of both CD20 protein determined by RPPA and CD3 expression determined by RNAseq, high levels of only one immune cell population, or low levels of both immune cell populations. (E) Number of tertiary lymphoid structures per mm in IM1 and IM2 tumors. Rank-sum test. For all survival analyses, patients were divided at median level of immune cell infiltrates, and survival assessed using the log-rank test. Hazard ratio is given with 95% confidence interval. TIL, tumor-infiltrating T lymphocyte.

Comment in

References

    1. Boloker G, Wang C. & Zhang J. Updated statistics of lung and bronchus cancer in United States (2018). Journal of thoracic disease 10, 1158–1161, doi:10.21037/jtd.2018.03.15 (2018). - DOI - PMC - PubMed
    1. Siegel RL, Miller KD & Jemal A. Cancer statistics, 2019. CA: a cancer journal for clinicians 69, 7–34, doi:10.3322/caac.21551 (2019). - DOI - PubMed
    1. Torre LA et al. Global cancer statistics, 2012. CA: a cancer journal for clinicians 65, 87–108, doi:10.3322/caac.21262 (2015). - DOI - PubMed
    1. Davidson MR, Gazdar AF & Clarke BE The pivotal role of pathology in the management of lung cancer. Journal of thoracic disease 5 Suppl 5, S463–478, doi:10.3978/j.issn.2072-1439.2013.08.43 (2013). - DOI - PMC - PubMed
    1. Langer CJ, Besse B, Gualberto A, Brambilla E. & Soria JC The evolving role of histology in the management of advanced non-small-cell lung cancer. Journal of clinical oncology : official journal of the American Society of Clinical Oncology 28, 5311–5320, doi:10.1200/jco.2010.28.8126 (2010). - DOI - PubMed

Publication types

MeSH terms