

Loss of Hs3st3a1 or Hs3st3b1 enzymes alters heparan sulfate to reduce epithelial morphogenesis and adult salivary gland function
- PMID: 34653670
- PMCID: PMC8629026
- DOI: 10.1016/j.matbio.2021.10.002
Loss of Hs3st3a1 or Hs3st3b1 enzymes alters heparan sulfate to reduce epithelial morphogenesis and adult salivary gland function
Abstract
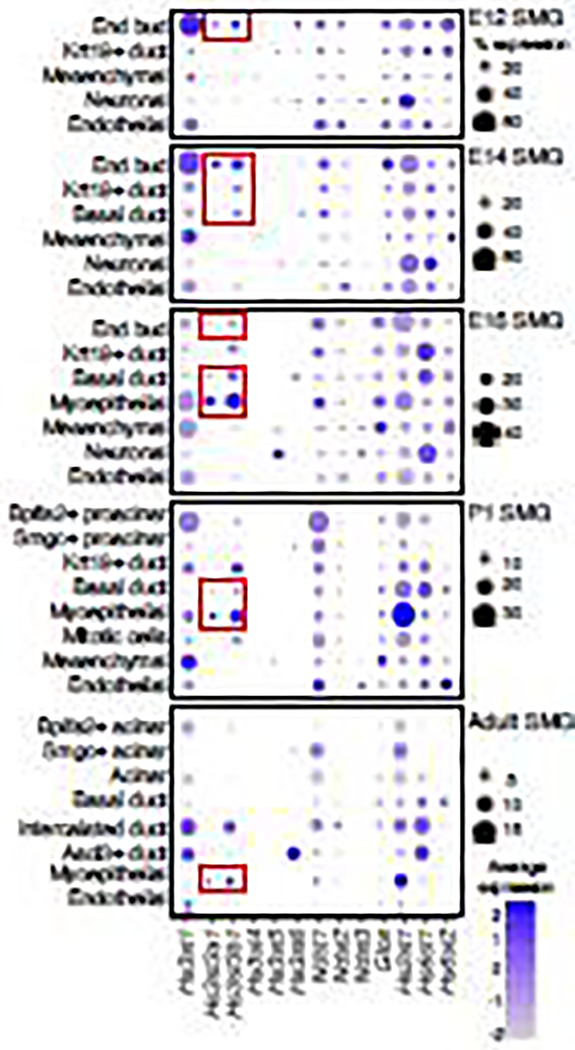
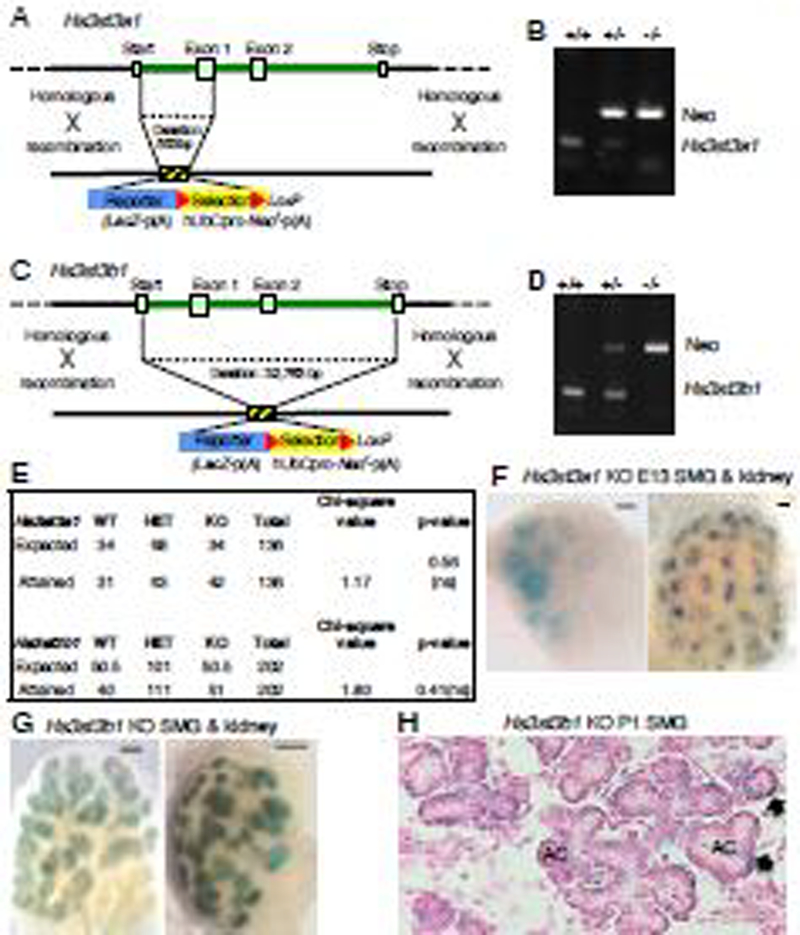
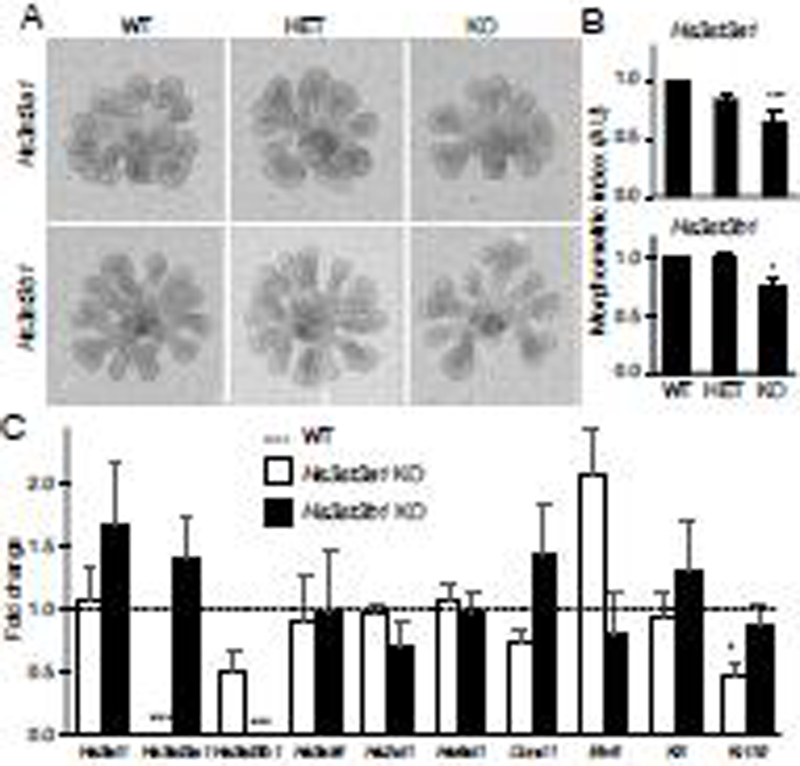
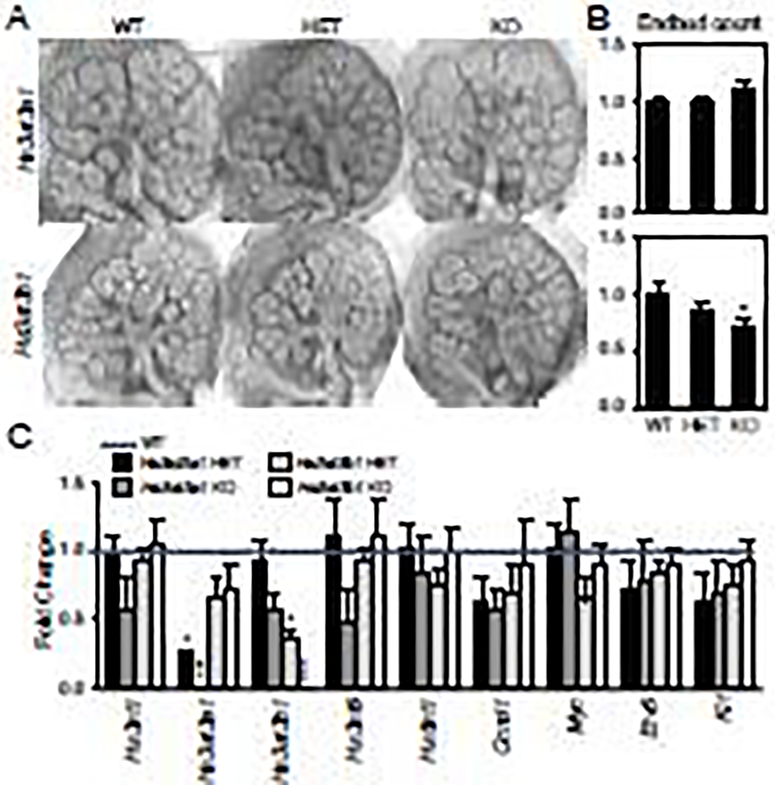
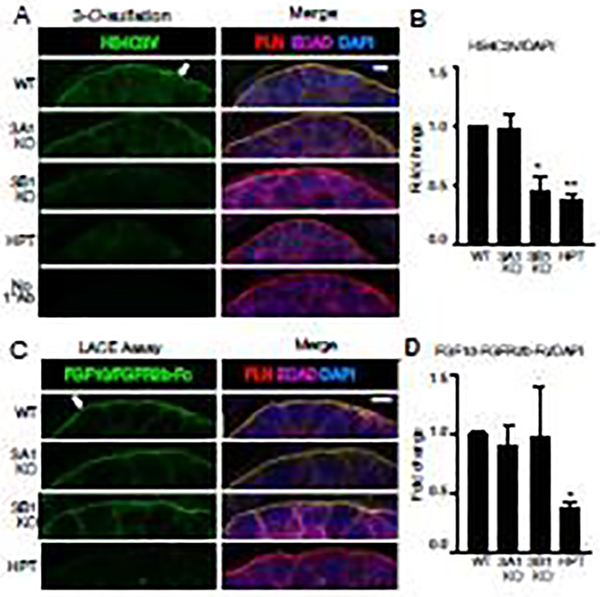
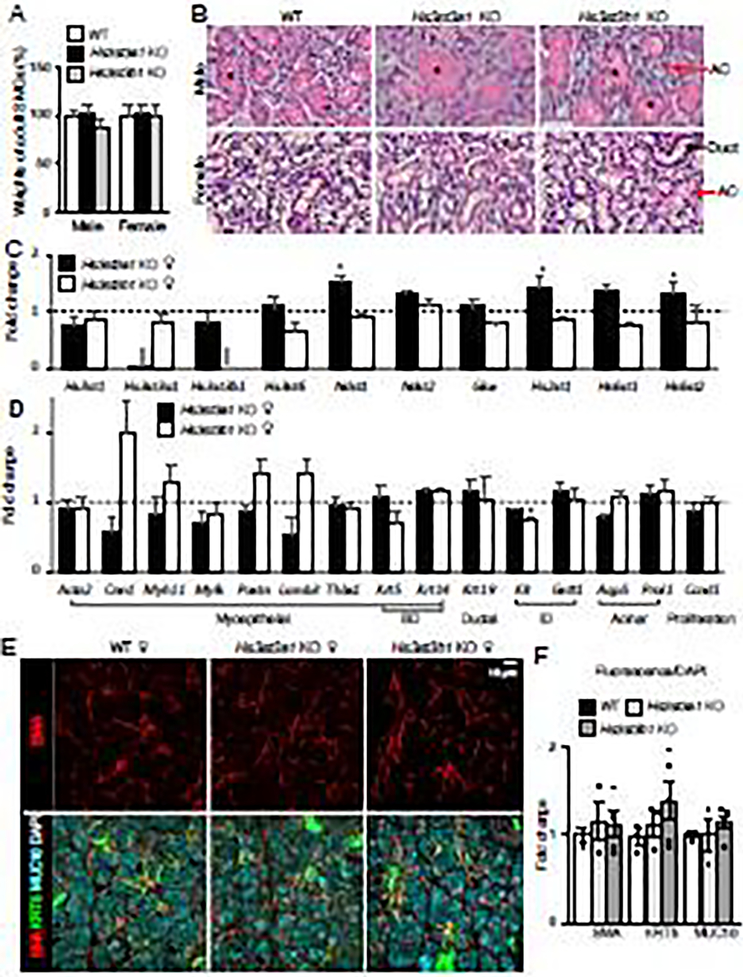
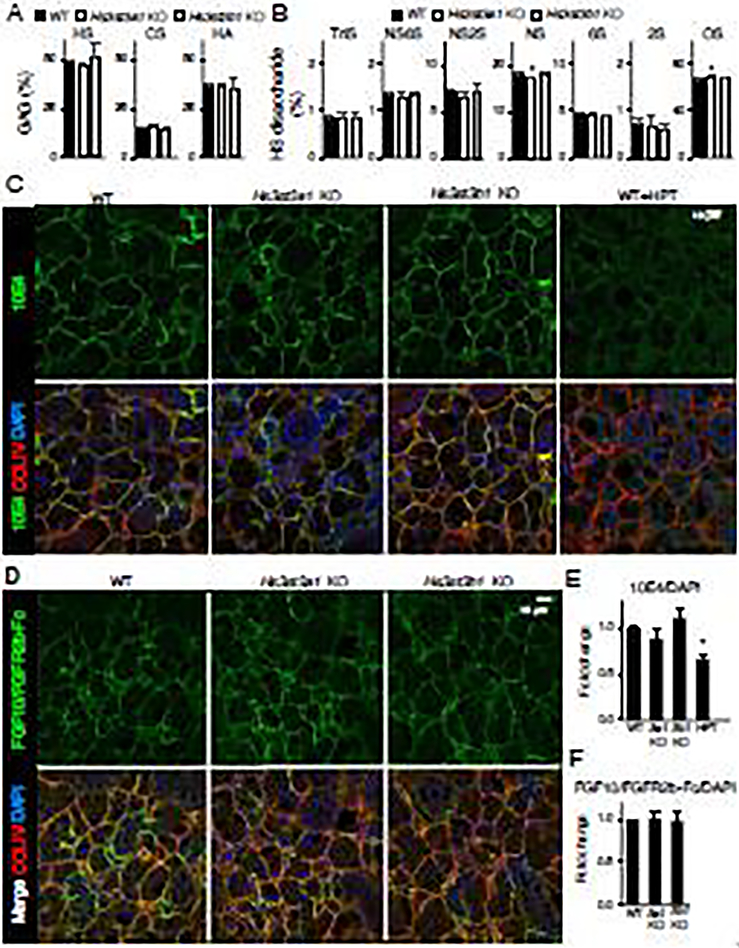
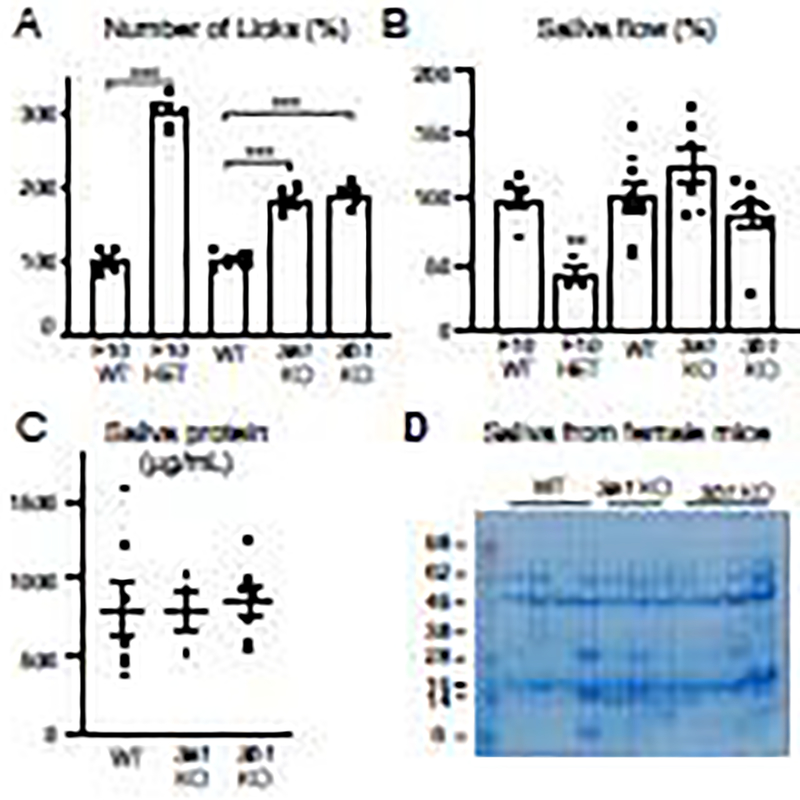
Heparan sulfate 3-O-sulfotransferases generate highly sulfated but rare 3-O-sulfated heparan sulfate (HS) epitopes on cell surfaces and in the extracellular matrix. Previous ex vivo experiments suggested functional redundancy exists among the family of seven enzymes but that Hs3st3a1 and Hs3st3b1 sulfated HS increases epithelial FGFR signaling and morphogenesis. Single-cell RNAseq analysis of control SMGs identifies increased expression of Hs3st3a1 and Hs3st3b1 in endbud and myoepithelial cells, both of which are progenitor cells during development and regeneration. To analyze their in vivo functions, we generated both Hs3st3a1-/- and Hs3st3b1-/- single knockout mice, which are viable and fertile. Salivary glands from both mice have impaired fetal epithelial morphogenesis when cultured with FGF10. Hs3st3b1-/- mice have reduced intact SMG branching morphogenesis and reduced 3-O-sulfated HS in the basement membrane. Analysis of HS biosynthetic enzyme transcription highlighted some compensatory changes in sulfotransferases expression early in development. The overall glycosaminoglycan composition of adult control and KO mice were similar, although HS disaccharide analysis showed increased N- and non-sulfated disaccharides in Hs3st3a1-/- HS. Analysis of adult KO gland function revealed normal secretory innervation, but without stimulation there was an increase in frequency of drinking behavior in both KO mice, suggesting basal salivary hypofunction, possibly due to myoepithelial dysfunction. Understanding how 3-O-sulfation regulates myoepithelial progenitor function will be important to manipulate HS-binding growth factors to enhance tissue function and regeneration.
Keywords: Basement membrane; HS-3-O-sulfotransferase; Heparan sulfate; Proteoglycan; Salivary gland development; fgf10.
Published by Elsevier B.V.
Conflict of interest statement
Figures
Similar articles
-
Specific 3-O-sulfated heparan sulfate domains regulate salivary gland basement membrane metabolism and epithelial differentiation.Nat Commun. 2024 Aug 31;15(1):7584. doi: 10.1038/s41467-024-51862-0. Nat Commun. 2024. PMID: 39217171 Free PMC article.
-
Loss of 3-O-sulfotransferase enzymes, Hs3st3a1 and Hs3st3b1, reduces kidney and glomerular size and disrupts glomerular architecture.Matrix Biol. 2024 Nov;133:134-149. doi: 10.1016/j.matbio.2024.06.006. Epub 2024 Jun 27. Matrix Biol. 2024. PMID: 38944161
-
Heparan sulfate-FGF10 interactions during lung morphogenesis.Dev Biol. 2003 Jun 1;258(1):185-200. doi: 10.1016/s0012-1606(03)00114-3. Dev Biol. 2003. PMID: 12781692
-
The function of heparan sulfate during branching morphogenesis.Matrix Biol. 2017 Jan;57-58:311-323. doi: 10.1016/j.matbio.2016.09.004. Epub 2016 Sep 6. Matrix Biol. 2017. PMID: 27609403 Free PMC article. Review.
-
Growth factor-heparan sulfate "switches" regulating stages of branching morphogenesis.Pediatr Nephrol. 2014 Apr;29(4):727-35. doi: 10.1007/s00467-013-2725-z. Epub 2014 Feb 2. Pediatr Nephrol. 2014. PMID: 24488503 Review.
Cited by
-
Genetic variability in proteoglycan biosynthetic genes reveals new facets of heparan sulfate diversity.Essays Biochem. 2024 Dec 4;68(4):555-578. doi: 10.1042/EBC20240106. Essays Biochem. 2024. PMID: 39630030 Free PMC article. Review.
-
Biofabrication, biochemical profiling, and in vitro applications of salivary gland decellularized matrices via magnetic bioassembly platforms.Cell Tissue Res. 2023 May;392(2):499-516. doi: 10.1007/s00441-022-03728-4. Epub 2022 Dec 28. Cell Tissue Res. 2023. PMID: 36576591
-
Specific 3-O-sulfated heparan sulfate domains regulate salivary gland basement membrane metabolism and epithelial differentiation.Nat Commun. 2024 Aug 31;15(1):7584. doi: 10.1038/s41467-024-51862-0. Nat Commun. 2024. PMID: 39217171 Free PMC article.
-
PITX2 expression and Neanderthal introgression in HS3ST3A1 contribute to variation in tooth dimensions in modern humans.Curr Biol. 2025 Jan 6;35(1):131-144.e6. doi: 10.1016/j.cub.2024.11.027. Epub 2024 Dec 12. Curr Biol. 2025. PMID: 39672157
-
Increased 3-O-sulfated heparan sulfate in Alzheimer's disease brain is associated with genetic risk gene HS3ST1.Sci Adv. 2023 May 26;9(21):eadf6232. doi: 10.1126/sciadv.adf6232. Epub 2023 May 26. Sci Adv. 2023. PMID: 37235665 Free PMC article.
References
-
- Mooij HL, Cabrales P, Bernelot Moens SJ, Xu D, Udayappan SD, Tsai AG, van der Sande MA, de Groot E, Intaglietta M, Kastelein JJ, Dallinga-Thie GM, Esko JD, Stroes ES, Nieuwdorp M, Loss of function in heparan sulfate elongation genes EXT1 and EXT 2 results in improved nitric oxide bioavailability and endothelial function, J Am Heart Assoc 3(6) (2014) e001274. - PMC - PubMed
-
- Colliec-Jouault S, Shworak NW, Liu J, de Agostini AI, Rosenberg RD, Characterization of a cell mutant specifically defective in the synthesis of anticoagulantly active heparan sulfate, J Biol Chem 269(40) (1994) 24953–8. - PubMed
-
- Shworak NW, Liu J, Petros LM, Zhang L, Kobayashi M, Copeland NG, Jenkins NA, Rosenberg RD, Multiple isoforms of heparan sulfate D-glucosaminyl 3-O-sulfotransferase. Isolation, characterization, and expression of human cdnas and identification of distinct genomic loci, J Biol Chem 274(8) (1999) 5170–84. - PubMed
-
- Liu J, Shriver Z, Blaiklock P, Yoshida K, Sasisekharan R, Rosenberg RD, Heparan sulfate D-glucosaminyl 3-O-sulfotransferase-3A sulfates N-unsubstituted glucosamine residues, J Biol Chem 274(53) (1999) 38155–62. - PubMed
Publication types
MeSH terms
Substances
Grants and funding
LinkOut - more resources
Full Text Sources
Molecular Biology Databases
Research Materials
