. 2022 Jan 11;6(1):13-27.
doi: 10.1182/bloodadvances.2021004207.

Iron status influences the response of cord blood megakaryocyte progenitors to eltrombopag in vitro

Affiliations

Iron status influences the response of cord blood megakaryocyte progenitors to eltrombopag in vitro

Zhi-Jian Liu et al. Blood Adv. .

Abstract

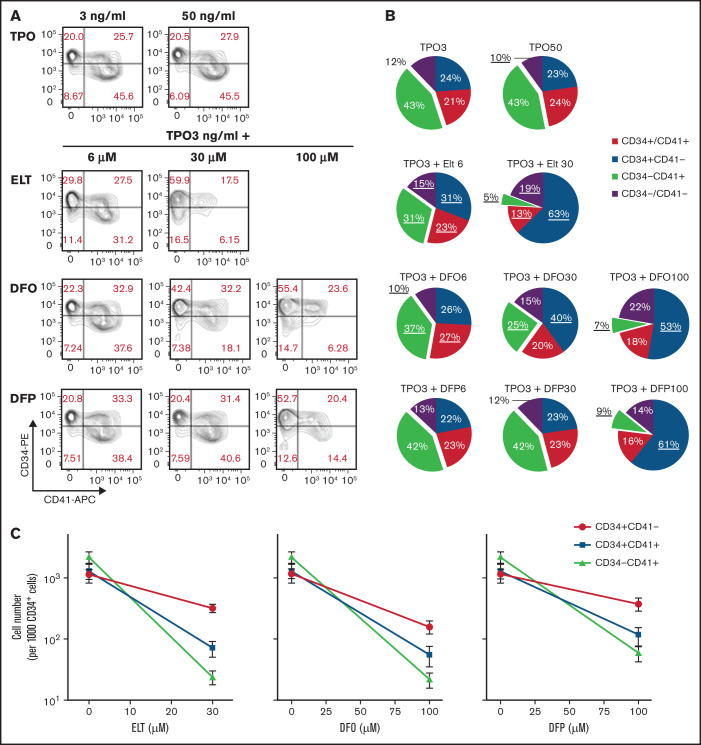
Eltrombopag (ELT) is a thrombopoietic agent approved for immune thrombocytopenia and also a potent iron chelator. Here we found that ELT exhibited dose-dependent opposing effects on in vitro megakaryopoiesis: low concentrations (≤6 µM, ELT6) stimulated megakaryopoiesis, but high concentrations (30 µM, ELT30) suppressed megakaryocyte (MK) differentiation and proliferation. The suppressive effects of ELT30 were reproduced by other iron chelators, supporting iron chelation as a likely mechanism. During MK differentiation, committed MK progenitors (CD34+/CD41+ and CD34-/CD41+ cells) were significantly more sensitive than undifferentiated progenitors (CD34+/CD41- cells) to the suppressive effects of ELT30, which resulted from both decreased proliferation and increased apoptosis. The antiproliferative effects of ELT30 were reversed by increased iron in the culture, as were the proapoptotic effects when exposure to ELT30 was short. Because committed MK progenitors exhibited the highest proliferative rate and the highest sensitivity to iron chelation, we tested whether their iron status influenced their response to ELT during rapid cell expansion. In these studies, iron deficiency reduced the proliferation of CD41+ cells in response to all ELT concentrations. Severe iron deficiency also reduced the number of MKs generated in response to high thrombopoietin concentrations by ∼50%, compared with iron-replete cultures. Our findings support the hypothesis that although iron deficiency can stimulate certain cells and steps in megakaryopoiesis, it can also limit the proliferation of committed MK progenitors, with severity of iron deficiency and degree of thrombopoietic stimulation influencing the ultimate output. Further studies are needed to clarify how megakaryopoiesis, iron deficiency, and ELT stimulation are clinically interrelated.


Figures

None
Graphical abstract
Figure 1.
Figure 1.
Dose-dependent iron-chelating effects of ELT on megakaryopoiesis. (A) The iron-chelating effects of ELT were evaluated using the calcein iron assay in K562 cells. Free calcein fluorescence increased as intracellular free iron decreased in response to ELT in a dose-dependent manner. (B) ΔFluorescence, calculated as the maximal calcein fluorescence minus the fluorescence with a specific treatment, was used to reflect the intracellular LIP, which decreased with increasing ELT concentrations. Thirty µM ELT always induced the highest calcein fluorescence, which was used as maximal fluorescence for these calculations. Shown are the results for CB-MKs treated with ELT (n = 4), K562 cells treated with ELT (n = 3), and K562 cells treated with the intracellular iron chelator DFP (n = 3). (C-E) CB-CD34+ cells were cultured with TPO3 alone, TPO3 plus the indicated concentrations (µM) of ELT, or TPO3 plus the iron chelators DFO or DFP for 14 days. Cells were counted biweekly at the time of media changes. Compared with TPO3, ELT6 significantly stimulated cell growth (C), whereas ELT30 suppressed cell growth (D), similarly to DFO100 or DFP100 (E). Data shown represent the mean ± standard deviation (SD) of 4 independent cultures. **P < .01; ***P < .001.
Figure 2.
Figure 2.
Effects of ELT and iron-chelators on MK differentiation. MK differentiation was analyzed at day 7 of culture, under the same conditions as in Figure 1. (A) Results of a representative experiment showing the flow cytometric analysis of CD34 expression (y-axis, PE) and CD41 expression (x-axis, APC) in cells under the culture conditions shown. (B) Pie charts showing the distribution of cell populations based on CD34 and CD41 surface expression on day 7 of culture with TPO alone or TPO3 plus escalating concentrations of ELT, DFP, or DFO. Values shown represent the means of 6 independent experiments. Underlined values are significantly different from those obtained in cultures with TPO3 alone (P < .05). (C) Absolute cell numbers for each population under the different culture conditions were calculated based on cell counts and percentages obtained on day 7. Although all cell populations decreased in cultures containing high doses of ELT of iron chelators, the effects were more pronounced on cells expressing CD41, indicating MK commitment. Values shown in panels B and C represent the means ± SD of 6 independent experiments.
Figure 3.
Figure 3.
Iron status influences early MK differentiation and expansion in response to ELT. CB CD34+ cells were cultured in conditions of iron depletion (0% HOLO), iron deficiency (10% HOLO), and iron repletion (100% HOLO) and with TPO plus different ELT concentrations. Cell number and differentiation were analyzed on culture-day 7 by flow cytometry. (A) Representative results of flow cytometric analysis of CD34 (y-axis, PE) and CD41 expression (x-axis, APC) in cells cultured with TPO3 plus ELT30 and various levels of iron availability, showing increased CD41 differentiation with increased iron availability. (B) Distribution of cell populations based on CD34 and CD41 surface expression on day 7 of culture with TPO3 plus escalating concentrations of ELT. Each line represents different levels of iron availability in culture. (C) Absolute cell numbers of each population were calculated based on cell numbers and percentages and are shown based on ELT concentration and iron status. Each data point reflects the mean ± SD from 6 independent experiments.
Figure 4.
Figure 4.
Surface expression of TfR1 is influenced by differentiation status, ELT concentration, and iron availability in culture. The surface expression of TfR1 was determined by FACS at day 7 of culture. (A) Representative flow cytometry results showing the gating strategy and histogram showing the changes in TfR1 expression (MFI) during MK differentiation. (B) TfR1 MFI levels in different cell types based on CD34 and CD41 expression, showing the highest levels in CD34+CD41+ cells. The iron availability in the media in which cells were cultured had a nonsignificant effect on TfR1 expression level. (C) Representative FACS results showing dose-dependent upregulation of TfR1 by ELT in all 3 cell types studied. (D) In CD34+CD41+ and CD34CD41+ cells treated with ELT6 and ELT30, iron availability had a significant effect: Increased iron reduced TfR1 MFI in cells treated with ELT6, but it had the opposite effect on cells treated with ELT30. Data reflect the mean ± SD from 5 independent experiments. *P < .05; **P < .01; ***P < .001.
Figure 5.
Figure 5.
Effects of ELT on cell proliferation and apoptosis. The effects of ELT on cell proliferation and apoptosis were assessed on day 7 of culture using EdU incorporation and TUNEL assays, respectively. (A) Representative FACS density plots showing EdU incorporation in different cell populations. (B) Representative FACS density plots showing the TUNEL+ fraction in different cell populations. (C) In EdU incorporation assays, 30 µM of ELT significantly suppressed the proliferation of CD34+CD41+ and CD34CD41+ cells cultured in iron-depleted conditions, a finding that was reversed by increased iron availability in culture. In contrast, CD34+/CD41 cells cultured with TPO only had significantly higher EdU incorporation when cultured in iron-depleted conditions. (D) Thirty µM of ELT also induced apoptosis in all 3 cell populations, but increased iron availability did not significantly reduce the level of apoptosis. Data reflect the mean ± SD of 5 independent experiments. *P < .05; ***P < .001.
Figure 6.
Figure 6.
ELT concentration and iron status influence the proliferation and apoptosis of committed MK progenitors. For these studies, CD34+cells were cultured for 7 days in iron-depleted, iron-deficient, and iron-replete conditions with 50 ng/mL of TPO to generate committed MK progenitors with variable iron status. At the end of 7 days, cells (mostly committed MK progenitors) were cultured for an additional 3 days in the same media but supplemented with TPO3 and escalating ELT concentrations. (A) Cell expansion improved with improved iron status and was maximal in cells preloaded with iron and cultured with ELT6. (B) Iron deficiency significantly reduced cell proliferation at all ELT concentrations but most strikingly in cells cultured with ELT30. (C) Treatment with ELT30 for 3 days significantly increased MK apoptosis in iron-depleted cells. This effect was attenuated in cells with improved iron status. (D) Representative images of EdU incorporation assays after FACS analysis: 0% HOLO and 0 µM ELT (left), 0% HOLO and 30 µM ELT (middle), and 100% HOLO and 30 µM ELT (right). EdU+ cells were identified by their red nuclear staining. CD41 was labeled in green, and DAPI was used for nuclear staining. N = 6 independent experiments. *P < .05; ***P < .001.
Figure 7.
Figure 7.
Effects of iron deficiency on in vitro TPO induced megakaryopoiesis. To evaluate the effects of iron deficiency on TPO-induced megakaryopoiesis (in the absence of ELT), CD34+ cells were cultured for 14 days in medium supplemented with either 100% HOLO, 100% APO, or no transferrin and 50 ng/mL of TPO to stimulate maximal proliferation and maturation. (A) Bars display the percentage of cells in every condition and timepoint related to the number of CD41+ cells generated at the end of 14 days in cultures with 100% HOLO (set at 100%). Cell expansion was reduced in cultures containing 0% HOLO compared with those with 100% HOLO, starting on day 11 of culture. (B) The percentage of CD41+ cells was also reduced by iron deficiency, with severe reductions in cultures without transferrin. (C) The maturation of committed MKs, indicated as the percentage of CD42b+ cells in the CD41 positive population, was not influenced by iron status. (D) Shown are representative photomicrographs of cells on day 14 of culture. Cells in 100% APO were reduced in number, and cultures without transferrin exhibited extensive cell death. Images present the average of 4 independent experiments. *P < .05; **P < .01; ***P < .001.

References

    1. Bussel JB, Kuter DJ, George JN, et al. AMG 531, a thrombopoiesis-stimulating protein, for chronic ITP. N Engl J Med. 2006;355(16):1672-1681. - PubMed
    1. Grainger JD, Locatelli F, Chotsampancharoen T, et al. Eltrombopag for children with chronic immune thrombocytopenia (PETIT2): a randomised, multicentre, placebo-controlled trial. Lancet. 2015;386(10004):1649-1658. - PubMed
    1. Sun H, Tsai Y, Nowak I, Liesveld J, Chen Y. Eltrombopag, a thrombopoietin receptor agonist, enhances human umbilical cord blood hematopoietic stem/primitive progenitor cell expansion and promotes multi-lineage hematopoiesis. Stem Cell Res (Amst). 2012;9(2):77-86. - PMC - PubMed
    1. Roth M, Will B, Simkin G, et al. Eltrombopag inhibits the proliferation of leukemia cells via reduction of intracellular iron and induction of differentiation. Blood. 2012;120(2):386-394. - PMC - PubMed
    1. Vlachodimitropoulou E, Chen YL, Garbowski M, et al. Eltrombopag: a powerful chelator of cellular or extracellular iron(III) alone or combined with a second chelator. Blood. 2017;130(17):1923-1933. - PMC - PubMed

Publication types