

Temporal changes in cardiovascular disease and infections in dialysis across a 22-year period: a nationwide study
- PMID: 34654383
- PMCID: PMC8518158
- DOI: 10.1186/s12882-021-02537-1
Temporal changes in cardiovascular disease and infections in dialysis across a 22-year period: a nationwide study
Abstract
Background: Cardiovascular diseases (CVD) and infections are recognized as serious complications in patients with end stage kidney disease. However, little is known about the change over time in incidence of these complications. This study aimed to investigate temporal changes in CVD and infective diseases across more than two decades in chronic dialysis patients.
Methods: All patients that initiated peritoneal dialysis (PD) or hemodialysis (HD) between 1996 and 2017 were identified and followed until outcome (CVD, pneumonia, infective endocarditis (IE) or sepsis), recovery of kidney function, end of dialysis treatment, death or end of study (December 31st, 2017). The calendar time was divided into 5 periods with period 1 (1996-2000) being the reference period. Adjusted rate ratios were assessed using Poisson regression.
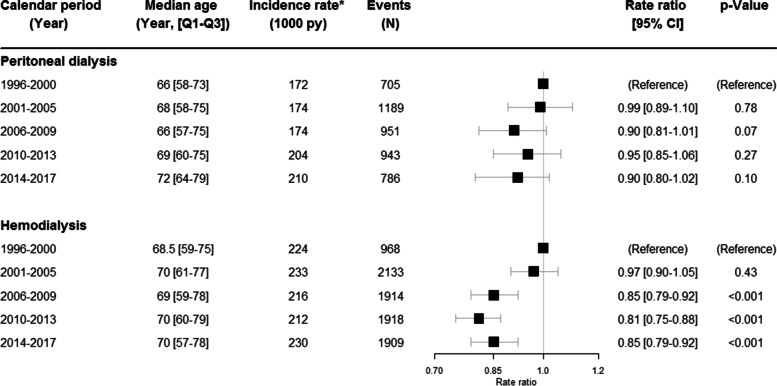
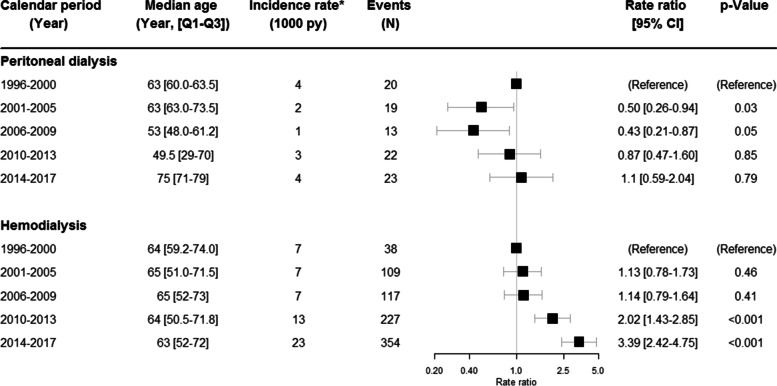
Results: In 4285 patients with PD (63.7% males) the median age increased across the calendar periods from 65 [57-73] in 1996-2000 to 69 [55-76] in 2014-2017, (p < 0.0001). In 9952 patients with HD (69.2% males), the overall median age was 71 [61-78] without any changes over time. Among PD, an overall non-significant decreasing trend in rate ratios (RR) of CVD was found, (p = 0,071). RR of pneumonia increased significantly throughout the calendar with an almost two-fold increase of the RR in 2014-2017 (RR 1.71; 95% CI 1.46-2.0), (p < 0.001), as compared to the reference period. The RR of IE decreased significantly until 2009 (RR 0.43; 95% CI 0.21-0.87), followed by a return to the reference level in 2010-2013 (RR 0.87; 95% CI 0.47-1.60 and 2014-2017 (RR 1.1; 95% CI 0.59-2.04). A highly significant (p < 0.001) increase in sepsis was revealed across the calendar periods with an almost 5-fold increase in 2014-2017 (RR 4.69 95% CI 3.69-5.96). In HD, the RR of CVD decreased significantly (p < 0.001) from 2006 to 2017 (RR 0.85; 95% CI 0.79-0.92). Compared to the reference period, the RR for pneumonia was high during all calendar periods (p < 0.05). The RR of IE was initially unchanged (p = 0.4) but increased in 2010-2013 (RR 2.02; 95% CI 1.43-2.85) and 2014-2017 (RR 3.39; 95% CI 2.42-4.75). No significant changes in sepsis were seen.
Conclusion: Across the two last decades the RR of CVD has shown a decreasing trend in HD and PD patients, while RR of pneumonia increased significantly, both in PD and in HD. Temporal trends of IE in HD, and particularly of sepsis in PD were upwards across the last decades.
Keywords: Cardiovascular disease; End stage kidney disease; Hemodialysis; Infective endocarditis; Peritoneal dialysis; Pneumonia; sepsis.
© 2021. The Author(s).
Conflict of interest statement
The authors declare that they have no competing interests with respect to the research, authorship and/or publication of this article.
Figures


References
-
- United States Renal Data System. 2018 USRDS annual data report: Epidemiology of kidney disease in the United States. National Institutes of Health, National Institute of Diabetes and Digestive and Kidney Diseases, Bethesda, MD, 2018. https://www.usrds.org/2018/view/Default.aspx. Accessed June 2, 2019.
-
- Sarnak MJ, Jaber BL. Mortality caused by sepsis in patients with end-stage renal disease compared with the general population. Kidney Int. 2000. 10.1111/j.1523-1755.2000.00337.x. - PubMed
Publication types
MeSH terms
LinkOut - more resources
Full Text Sources
Medical
