. 2021 Oct 15;18(1):232.
doi: 10.1186/s12974-021-02290-0.

Functional role of brain-engrafted macrophages against brain injuries

Affiliations

Functional role of brain-engrafted macrophages against brain injuries

Xi Feng et al. J Neuroinflammation. .

Abstract

Background: Brain-resident microglia have a distinct origin compared to macrophages in other organs. Under physiological conditions, microglia are maintained by self-renewal from the local pool, independent of hematopoietic progenitors. Pharmacological depletion of microglia during whole-brain radiotherapy prevents synaptic loss and long-term recognition memory deficits. However, the origin or repopulated cells and the mechanisms behind these protective effects are unknown.

Methods: CD45low/int/CD11b+ cells from naïve brains, irradiated brains, PLX5622-treated brains and PLX5622 + whole-brain radiotherapy-treated brains were FACS sorted and sequenced for transcriptomic comparisons. Bone marrow chimeras were used to trace the origin and long-term morphology of repopulated cells after PLX5622 and whole-brain radiotherapy. FACS analyses of intrinsic and exotic synaptic compartments were used to measure phagocytic activities of microglia and repopulated cells. In addition, concussive brain injuries were given to PLX5622 and brain-irradiated mice to study the potential protective functions of repopulated cells after PLX5622 + whole-brain radiotherapy.

Results: After a combination of whole-brain radiotherapy and microglia depletion, repopulated cells are brain-engrafted macrophages that originate from circulating monocytes. Comparisons of transcriptomes reveal that brain-engrafted macrophages have an intermediate phenotype that resembles both monocytes and embryonic microglia. In addition, brain-engrafted macrophages display reduced phagocytic activity for synaptic compartments compared to microglia from normal brains in response to a secondary concussive brain injury. Importantly, replacement of microglia by brain-engrafted macrophages spare mice from whole-brain radiotherapy-induced long-term cognitive deficits, and prevent concussive injury-induced memory loss.

Conclusions: Brain-engrafted macrophages prevent radiation- and concussion-induced brain injuries and cognitive deficits.

Keywords: Brain irradiation; Brain-engrafted macrophages; CSF-1R inhibitor; Cognition; Microglia.


Conflict of interest statement

The authors declare no competing interests.

Figures

Fig. 1
Fig. 1
Microglia depletion and repopulation prevents long-term radiation-induced memory deficits and loss of hippocampal PSD95. a Experimental design and Novel Object Recognition (NOR) test result. CSF-1R inhibitor was used to deplete microglia during 3 doses of 3.3 Gy of whole-brain radiotherapy (WBRT). A 4-day NOR protocol was used to measure recognition memory, which ended on day 32 post WBRT. Microglia were isolated using fluorescent activated cell sorting (FACS) on day 33 and dot plots showing NOR results. Statistical analysis was performed using two-way ANOVA with Dunnett’s multiple comparisons test. There is no CSF-1Ri treatment effect (F (1, 38) = 1.787, p = 0.1893), but significant WBRT effect (F (1, 38) = 13.23, p = 0.0008) and interaction between CSF-1Ri treatment and WBRT (F (1,38) = 6.07, p = 0.0184), N = 9–12, animals with insufficient exploration time on NOR test day were excluded. b Hierarchically clustered heatmap showing significantly altered microglial genes by WBRT, but not changed with CSF-1Ri treatment. c Bar graphs summarizing fold enrichment and p values of the top 20 enriched Biological Processes by Gene Ontology analysis from up-regulated microglial genes after WBRT (full list in Additional file 2: Table S1). No significantly enriched terms were identified by GO analysis from down-regulated genes by WBRT. d A pie chart summarizing all enriched GOBP terms. ns = not significant, ***p < 0.0001. e Scatter plots showing gating strategy in flow synaptometry analyses. Fluorescent beads at various sizes were used as standard to gate isolated hippocampal cell membrane fractions. Particles between 1 µm and 3 µm were considered synaptosomes and used to determine Synapsin 1 and PSD95 protein levels by mean fluorescent intensities (MFIs). f Dot plots to compare Synapsin 1 and PSD95 MFI levels in hippocampal cell fractions. Statistical analyses were performed using two-way ANOVA with Tukey’s multiple comparisons test. ns = not significant, *p < 0.05, ***p < 0.001. N = 6
Fig. 2
Fig. 2
Repopulated microglia-like cells after depletion and WBRT originate from peripheral monocytes and retain monocytic signatures. a Experimental design of head-protected bone marrow transplantation (BMT) followed by CSF-1Ri-mediated microglia depletion and WBRT. Lower panel shows fur colors before euthanasia for brain analysis. b Representative FACS analysis gating strategy to analyze bone marrow chimera efficiency 6 weeks after BMT, about two-thirds of the CD11b+Ly6Chigh monocytes are replaced by GFP+RFP+ cells derived from donor bone marrow cells. c Representative FACS analysis gating strategy and brain myeloid composition results. Upper panel shows FACS gating using CD45 and CD11b staining; microglia and microglia-like cells are defined by positive CD11b staining and low or intermediate CD45 levels. Lower panel shows scatter plots of GFP/RFP fluorescent levels of the CD11b+CD45low/intermediate population in the brain, and a dot plot comparing percentages of peripheral myeloid cell derived microglia-like cells. Statistical analysis was performed using unpaired t-test, ***p < 0.001. d Hierarchically clustered heatmaps to compare microglia and monocyte signatures. A signature gene list was defined using a dataset published by Lavin and Winter et al., GSE63340. Defined list and expression details are in Additional file 3: Table S2. e Similarity matrix comparisons using defined monocyte and microglia signature genes. f Bar graph showing similarity scores to compare relative numbers of genes (in percentage of the defined list) that express in the same trends as monocytes or microglia based on the Lavin and Winter et al. dataset
Fig. 3
Fig. 3
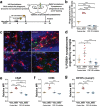
Repopulated microglia and brain-engrafted macrophages are not activated and phagocyte less synaptic compartments. a Experimental design for in vivo synaptosome phagocytosis assays. Injection of pre-stained synaptosomes was timed to be the same as previous experiments. Three days later, on day 36 after WBRT, ipsilateral hemispheres were harvested and used for engulfment measurement using FACS or Immunofluorescent staining. b FACS analysis result showing levels of microglia that engulfed pre-stained PSD-95 signals. c Representative images showing engulfment of pre-stained synaptosomes by microglia near injection site. White arrows point at microglia that have engulfed pre-stained synaptosomes. scale bar = 20 µm. d Dot plot to show quantification result of synaptosome engulfment by immunofluorescent staining. eg Dot plots showing cell surface C5aR, and intracellular CD68 and CD107a protein levels in microglia and BEMs. Statistical analyses were performed using two-way ANOVA with Tukey’s multiple comparisons test. *p < 0.05, **p < 0.01, ***p < 0.001, ****p < 0.0001. N = 5–6
Fig. 4
Fig. 4
BEMs gradually adapt to microglia-like morphology and persist in the brain. a Schematic of experimental design for long-term assessment of BEMs. b Representative images of microglia/BEMs counting, scale bar = 20 μm. c Sholl analysis results showing numbers of intersections at different distances to cell center, BEMs at 7, 14, 33, 90 and 180 days after WBRT were compared to naïve microglia age-matched to 90 days after WBRT. d Representative images showing differential Iba1 and GFP-expressing profiles of microglia (Iba1 + GFP−) and BEMs (Iba1 + GFP +) in a BEM-bearing brain at 33 days after WBRT. e Dot plot to show percentage of replacement of microglia by BEMs, each dot represent an individual mouse. n = 2–3. Statistical analyses were performed using unpaired t-test at each distance point (c) or time point (e). See Additional file 1: Fig. S7 for detailed comparisons between microglia and BEMs at each time point
Fig. 5
Fig. 5
BEMs provide long-term protection against WBRT-induced dendritic spine and memory loss. a Schematic of experimental design for long-term memory and dendritic spine density analyses. b and c dot plots to show NOR test results at 3 and 6 months after WBRT, respectively. N = 6–12. d Dendritic spine counts of hippocampal granule neurons at 6 months after WBRT, N = 5–6. Statistical analyses were performed using two-way ANOVA with Tukey’s post hoc multiple comparisons test (bd). *p < 0.05, **p < 0.01, ***p < 0.001, ****p < 0.0001
Fig. 6
Fig. 6
BEMs protects against concussive injury-induced memory deficits. a Schematic of experimental design for concussive injury, cognitive test and following analyses. b Dot plot to show the result of in vivo phagocytosis assay by FACS after injection of pre-stained synaptosomes, each dot represents value from an individual mouse, n = 4–5. c Dot plot showing result of in vivo phagocytosis assay by IF imaging and quantification, each dot represents mean counts from an individual mouse, n = 3. d Representative images showing microglia and BEMs (arrows) phagocytosing injected synaptosomes (green dots). e Sholl analysis result showing numbers of intersections at different distances to the cell center, n = 5–6. f Dot plot showing NOR test result, each dot represent the performance of an individual mouse, n = 12. Statistical analyses were performed using two-way ANOVA with Tukey’s multiple comparisons test (b and c) for each distance point (e) or unpaired t-test (f). *p < 0.05, **p < 0.01, ***p < 0.001

References

    1. Alliot F, Godin I, Pessac B. Microglia derive from progenitors, originating from the yolk sac, and which proliferate in the brain. Dev Brain Res. 1999;117(2):145–152. doi: 10.1016/S0165-3806(99)00113-3. - DOI - PubMed
    1. Ginhoux F, et al. Fate mapping analysis reveals that adult microglia derive from primitive macrophages. Science. 2010;330(6005):841. doi: 10.1126/science.1194637. - DOI - PMC - PubMed
    1. Ajami B, Bennett JL, Krieger C, Tetzlaff W, Rossi FMV. Local self-renewal can sustain CNS microglia maintenance and function throughout adult life. Nat Neurosci. 2007;10:1538. doi: 10.1038/nn2014. - DOI - PubMed
    1. Prinz M, Priller J, Sisodia SS, Ransohoff RM. Heterogeneity of CNS myeloid cells and their roles in neurodegeneration. Nat Neurosci. 2011;14(10):1227–1235. doi: 10.1038/nn.2923. - DOI - PubMed
    1. Saijo K, Glass CK. Microglial cell origin and phenotypes in health and disease. Nat Rev Immunol. 2011;11(11):775–787. doi: 10.1038/nri3086. - DOI - PubMed