. 2022 Mar 15;82(6):1038-1054.
doi: 10.1158/0008-5472.CAN-21-0622.

Targeting LRRC15 Inhibits Metastatic Dissemination of Ovarian Cancer

Affiliations

Targeting LRRC15 Inhibits Metastatic Dissemination of Ovarian Cancer

Upasana Ray et al. Cancer Res. .

Abstract

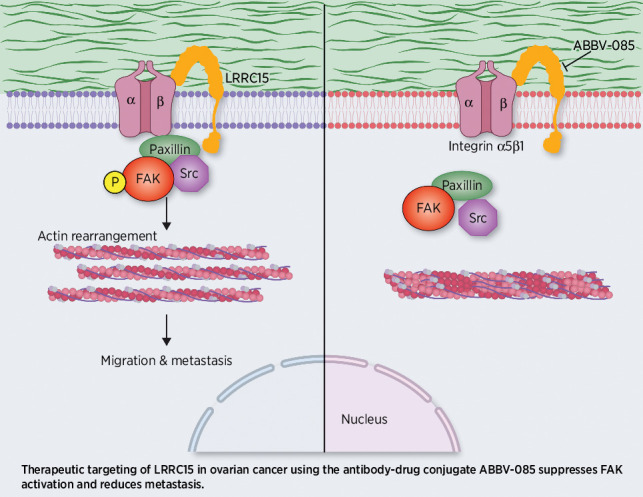
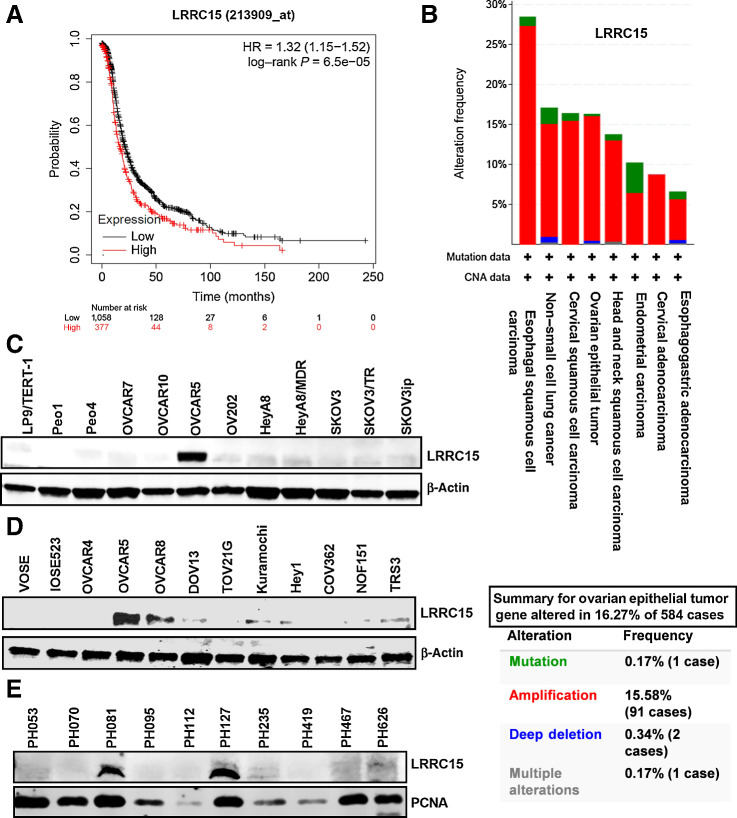
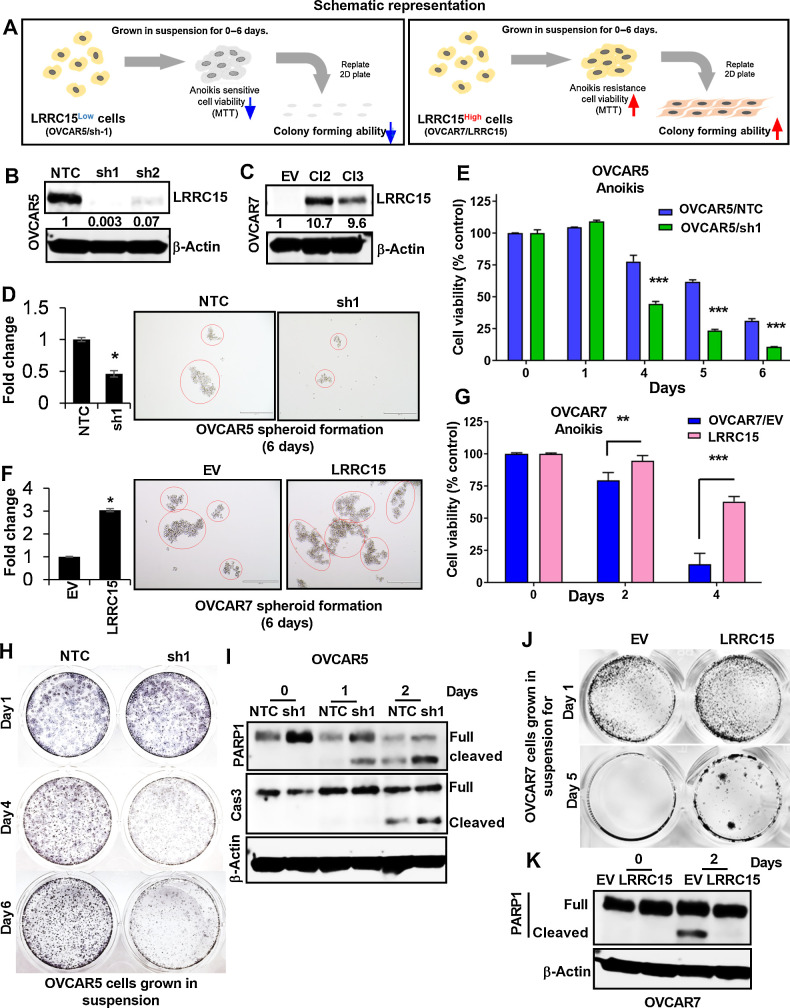
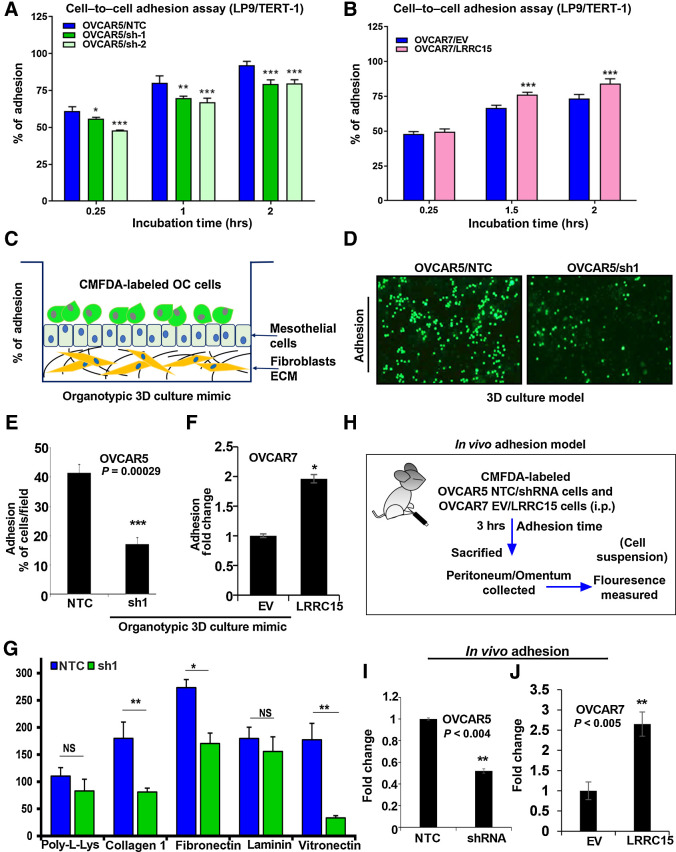
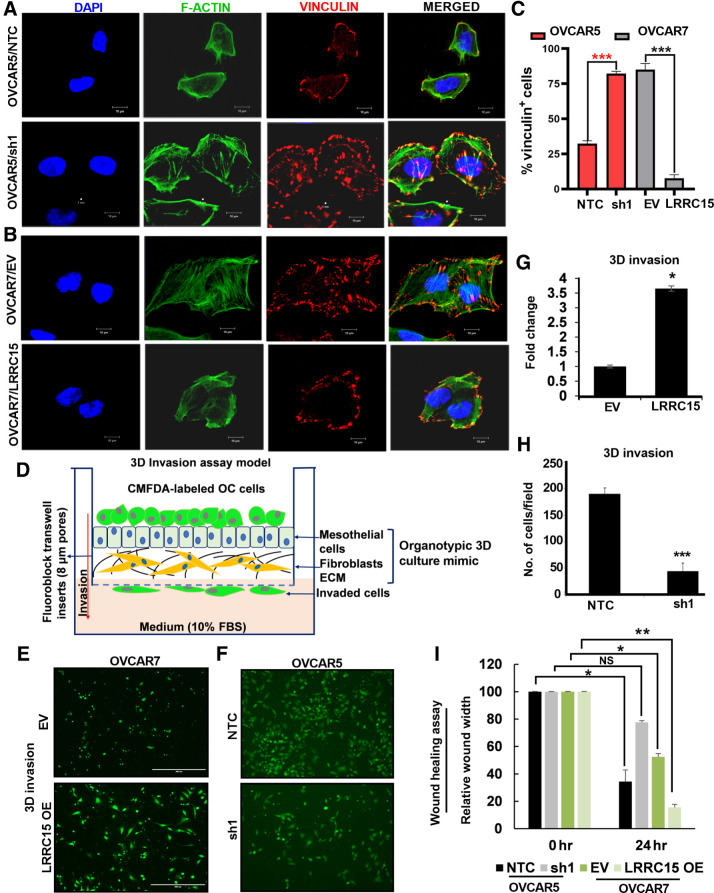
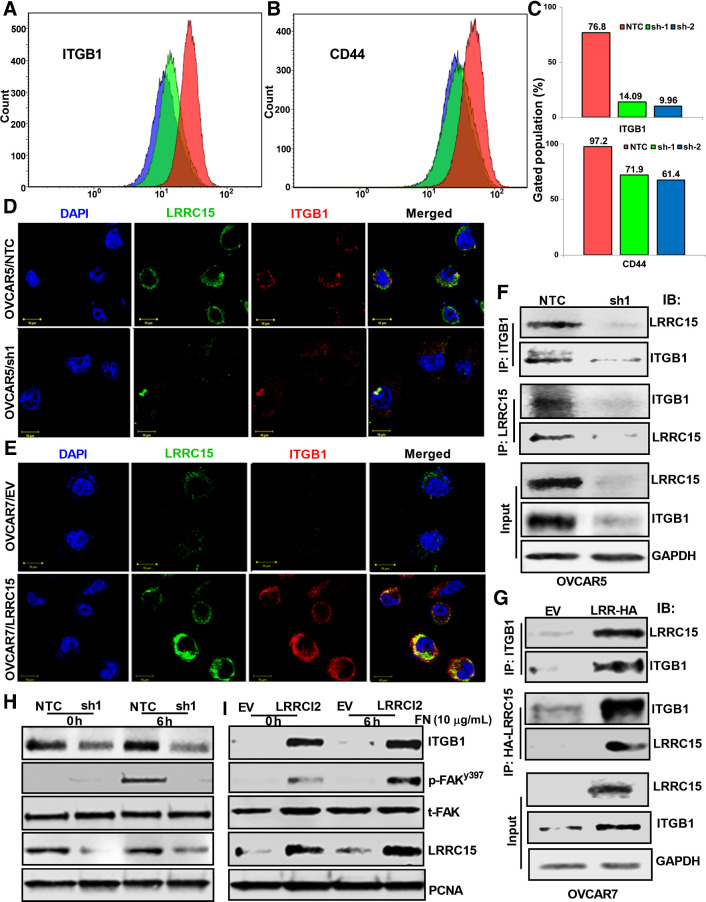
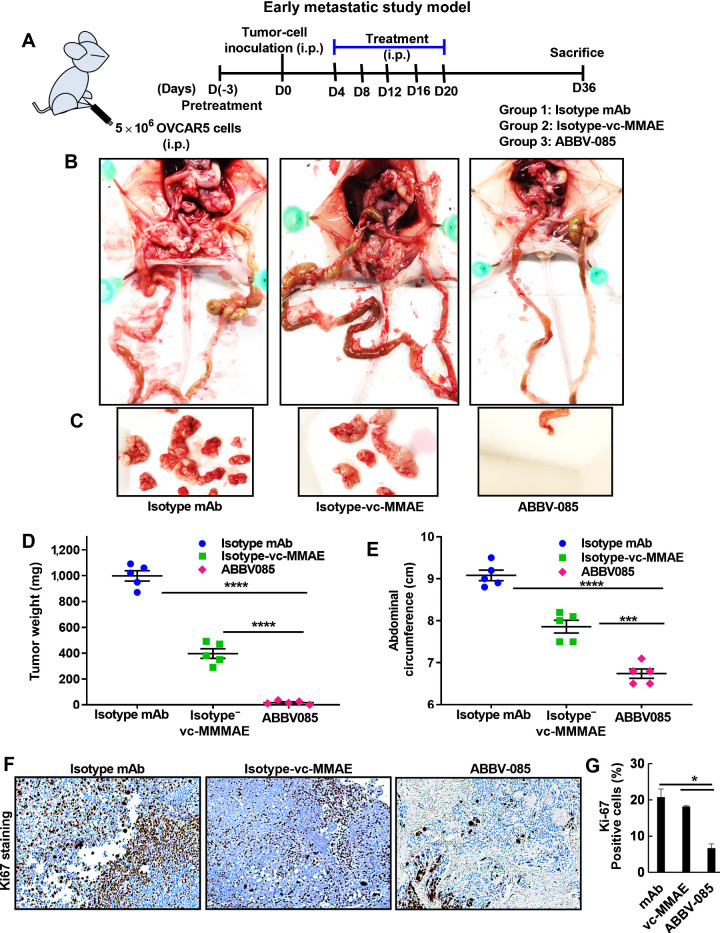
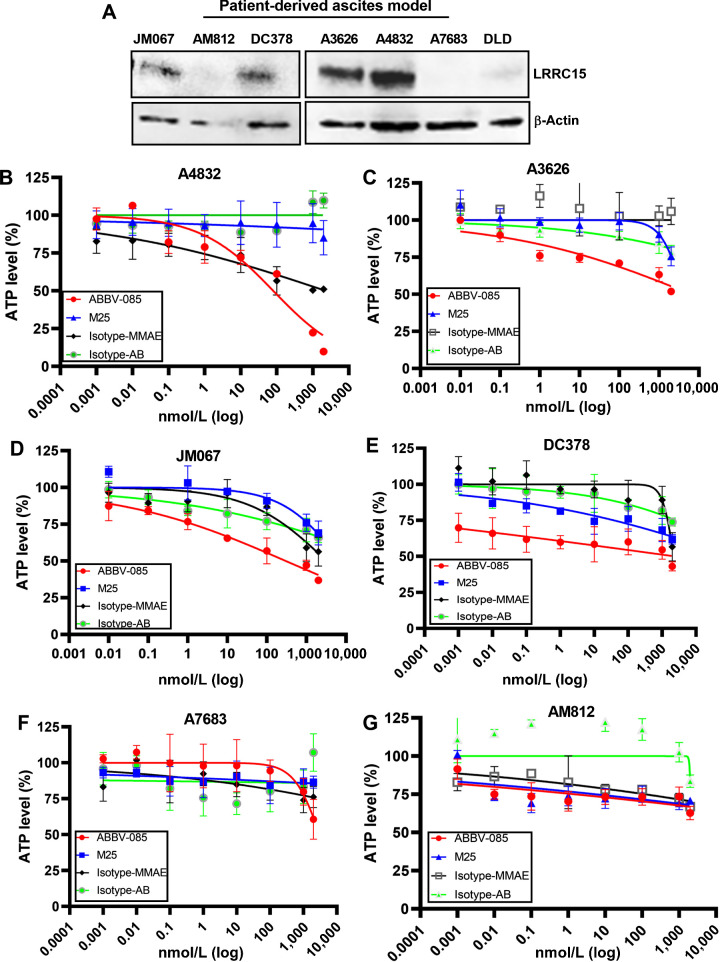
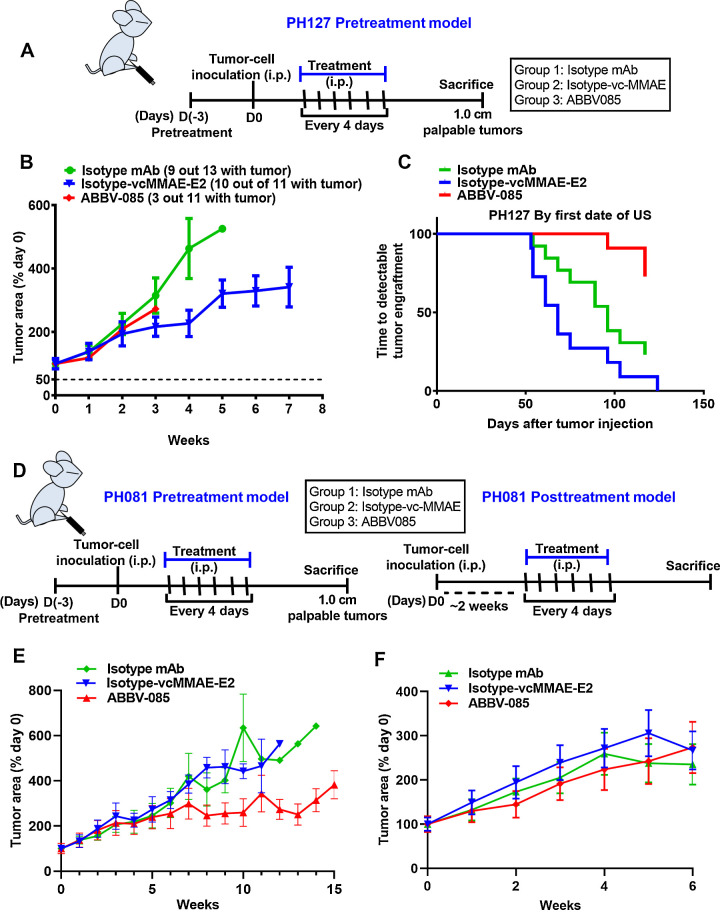
Dissemination of ovarian cancer cells can lead to inoperable metastatic lesions in the bowel and omentum that cause patient death. Here we show that LRRC15, a type-I 15-leucine-rich repeat-containing membrane protein, highly overexpressed in ovarian cancer bowel metastases compared with matched primary tumors and acts as a potent promoter of omental metastasis. Complementary models of ovarian cancer demonstrated that LRRC15 expression leads to inhibition of anoikis-induced cell death and promotes adhesion and invasion through matrices that mimic omentum. Mechanistically, LRRC15 interacted with β1-integrin to stimulate activation of focal adhesion kinase (FAK) signaling. As a therapeutic proof of concept, targeting LRRC15 with the specific antibody-drug conjugate ABBV-085 in both early and late metastatic ovarian cancer cell line xenograft models prevented metastatic dissemination, and these results were corroborated in metastatic patient-derived ovarian cancer xenograft models. Furthermore, treatment of 3D-spheroid cultures of LRRC15-positive patient-derived ascites with ABBV-085 reduced cell viability. Overall, these data uncover a role for LRRC15 in promoting ovarian cancer metastasis and suggest a novel and promising therapy to target ovarian cancer metastases.

Significance: This study identifies that LRRC15 activates β1-integrin/FAK signaling to promote ovarian cancer metastasis and shows that the LRRC15-targeted antibody-drug conjugate ABBV-085 suppresses ovarian cancer metastasis in preclinical models.


Figures

None
Graphical abstract
Figure 1. LRRC15 is associated with ovarian cancer. A, Kaplan–Meier progression-free survival analysis shows high LRRC15 expression is associated with worse progression-free survival in a cohort of 1,436 patients with ovarian cancer. B, TCGA analysis of LRRC15 expression in several cancer types along with the percent gene altered as evaluated in the ovarian epithelial tumor. C and D, Immunoblot analysis of LRRC15 in ovarian cancer cell lines and in the ovarian cancer fibroblast cell lines NOF15hTERT and TRS3 and in the normal ovarian surface epithelial cells VOSE and IOSE523. β-actin was used as loading control. E, Western blot analysis of LRRC15 and proliferating cell nuclear antigen (PCNA) expression as control in 10 ovarian cancer PDX tumors.
Figure 1.
LRRC15 is associated with ovarian cancer. A, Kaplan–Meier progression-free survival analysis shows high LRRC15 expression is associated with worse progression-free survival in a cohort of 1,436 patients with ovarian cancer. B, TCGA analysis of LRRC15 expression in several cancer types along with the percent gene altered as evaluated in the ovarian epithelial tumor. C and D, Immunoblot analysis of LRRC15 in ovarian cancer cell lines and in the ovarian cancer fibroblast cell lines NOF15hTERT and TRS3 and in the normal ovarian surface epithelial cells VOSE and IOSE523. β-actin was used as loading control. E, Western blot analysis of LRRC15 and proliferating cell nuclear antigen (PCNA) expression as control in 10 ovarian cancer PDX tumors.
Figure 2. LRRC15 renders cells resistant to anoikis. A, Schematic representation of the experimental protocol. B and C, Immunoblot analysis of LRRC15 expression in OVCAR5 NTC and sh1/sh2 KD cells (B) and in the OVCAR7 EV-transfected control cells and Cl2 and Cl3 LRRC15 OE cells (C). β-Actin was used as a loading control. Fold change was calculated using the Image J software, normalized to endogenous control, and provided beneath the panel. D, 3D-spheroid formation assay was performed for 6 days in OVCAR5 NTC control and LRRC15 sh1 KD cells. Quantification as fold change was provided. E, OVCAR5 NTC and sh1 cells spheroids were subsequently transferred into adhesive plates for the indicated time points, followed by MTT assay. The percent cell viability was scored and plotted. Results show the mean ± SEM. F, Spheroid formation assay was performed in OVCAR7 EV control and LRRC15 OE cells and is represented as fold change. G, Cell viability assay was performed in the mentioned cells for the indicated time points in similar manner. The percent cell viability was plotted with the mean ± SEM. H, Colony-forming assay was performed with OVCAR5 NTC and sh1 spheroid culture transferred in 6-well adhesive plates and imaged upon staining with Coomassie blue for the mentioned time points. I, Immunoblot analysis of cleaved PARP1 and cleaved caspase-3 levels was performed under similar conditions for days 0 to 2. J and K, Colony-forming assay and Western blot analysis for cleaved PARP1 was performed in the OVCAR7 EV and LRRC15 overexpressed cells in a similar manner. β-actin used as loading control. **, P < 0.01; ***, P < 0.001.
Figure 2.
LRRC15 renders cells resistant to anoikis. A, Schematic representation of the experimental protocol. B and C, Immunoblot analysis of LRRC15 expression in OVCAR5 NTC and sh1/sh2 KD cells (B) and in the OVCAR7 EV-transfected control cells and Cl2 and Cl3 LRRC15 OE cells (C). β-Actin was used as a loading control. Fold change was calculated using the Image J software, normalized to endogenous control, and provided beneath the panel. D, 3D-spheroid formation assay was performed for 6 days in OVCAR5 NTC control and LRRC15 sh1 KD cells. Quantification as fold change was provided. E, OVCAR5 NTC and sh1 cells spheroids were subsequently transferred into adhesive plates for the indicated time points, followed by MTT assay. The percent cell viability was scored and plotted. Results show the mean ± SEM. F, Spheroid formation assay was performed in OVCAR7 EV control and LRRC15 OE cells and is represented as fold change. G, Cell viability assay was performed in the mentioned cells for the indicated time points in similar manner. The percent cell viability was plotted with the mean ± SEM. H, Colony-forming assay was performed with OVCAR5 NTC and sh1 spheroid culture transferred in 6-well adhesive plates and imaged upon staining with Coomassie blue for the mentioned time points. I, Immunoblot analysis of cleaved PARP1 and cleaved caspase-3 levels was performed under similar conditions for days 0 to 2. J and K, Colony-forming assay and Western blot analysis for cleaved PARP1 was performed in the OVCAR7 EV and LRRC15 overexpressed cells in a similar manner. β-actin used as loading control. **, P < 0.01; ***, P < 0.001.
Figure 3. LRRC15 KD abrogates the adhesion phenomenon in the OC cells. A and B, OVCAR5 NTC, sh1/sh2 (A), and OVCAR7 EV and LRRC15 (B) overexpressed cells were prelabeled with fluorescent CMFDA and seeded onto the top of the LP9/TERT-1 mesothelial monolayer culture. hrs, hours. Fluorescent intensity was measured at the mentioned time points, which reflect the percent of cancer cells that gets adhered to the mesothelial layer and the percent cell adherence after normalization was plotted as mean ± SEM. C, Schematic representation of the organotypic 3D culture model of the surface layers of the omentum. OC, ovarian cancer. D, Representative images of fluorescently labeled NTC and sh1 OVCAR5 cells adhering to the 3D culture model. E, The percent adherent NTC and sh1 OVCAR5 cells were measured and plotted as mean ± SEM. F, The percent of EV and LRRC15-overexpressing (LRRC15) OVCAR7 cells adhering to the 3D culture was measured and plotted as mean ± SEM. G, OVCAR5 NTC and sh1 cells were prelabeled with CMFDA and then seeded onto the top of the culture dishes that were precoated with poly-l-lysine, collagen 1A1, fibronectin, laminin, and vitronectin, respectively. Percent adhered cells were represented as mean ± SEM. H, Schematic representation of the in vivo adhesion assay in NSG mice model of ovarian cancer. In vivo adhesion was performed by intraperitoneal injection of CMFDA-labeled NTC and LRRC15 shRNA OVCAR5 cells or EV and LRRC15 OVCAR7 cells in female NSG mice (n = 3/group). After 3 hours, the mice were sacrificed and the peritoneum/omentum tissues were collected, cancer cells dissociated, and fluorescence intensity was measured in the cell suspension. I and J, The fold change in fluorescent intensity was plotted as a measure of adhesion for NTC vs. LRRC15 shRNA cells (I) and EV vs. LRRC15 overexpressing cells (J). NS, not significant; *, P < 0.05; **, P < 0.01; ***, P < 0.001.
Figure 3.
LRRC15 KD abrogates the adhesion phenomenon in the OC cells. A and B, OVCAR5 NTC, sh1/sh2 (A), and OVCAR7 EV and LRRC15 (B) overexpressed cells were prelabeled with fluorescent CMFDA and seeded onto the top of the LP9/TERT-1 mesothelial monolayer culture. hrs, hours. Fluorescent intensity was measured at the mentioned time points, which reflect the percent of cancer cells that gets adhered to the mesothelial layer and the percent cell adherence after normalization was plotted as mean ± SEM. C, Schematic representation of the organotypic 3D culture model of the surface layers of the omentum. OC, ovarian cancer. D, Representative images of fluorescently labeled NTC and sh1 OVCAR5 cells adhering to the 3D culture model. E, The percent adherent NTC and sh1 OVCAR5 cells were measured and plotted as mean ± SEM. F, The percent of EV and LRRC15-overexpressing (LRRC15) OVCAR7 cells adhering to the 3D culture was measured and plotted as mean ± SEM. G, OVCAR5 NTC and sh1 cells were prelabeled with CMFDA and then seeded onto the top of the culture dishes that were precoated with poly-l-lysine, collagen 1A1, fibronectin, laminin, and vitronectin, respectively. Percent adhered cells were represented as mean ± SEM. H, Schematic representation of the in vivo adhesion assay in NSG mice model of ovarian cancer. In vivo adhesion was performed by intraperitoneal injection of CMFDA-labeled NTC and LRRC15 shRNA OVCAR5 cells or EV and LRRC15 OVCAR7 cells in female NSG mice (n = 3/group). After 3 hours, the mice were sacrificed and the peritoneum/omentum tissues were collected, cancer cells dissociated, and fluorescence intensity was measured in the cell suspension. I and J, The fold change in fluorescent intensity was plotted as a measure of adhesion for NTC vs. LRRC15 shRNA cells (I) and EV vs. LRRC15 overexpressing cells (J). NS, not significant; *, P < 0.05; **, P < 0.01; ***, P < 0.001.
Figure 4. Altered LRRC15 expression reveals distinct pattern of FA complex formation in ovarian cancer cells. A, OVCAR5 NTC and sh1 cells were grown on fibronectin-coated coverslips for 24 hours, followed by immunofluorescence study against F-actin (green) and vinculin (red) using the confocal microscopy. DAPI was used to stain the nucleus, and the merged images are represented. B, Similar immunofluorescence assay was performed in the OVCAR7 EV and LRRC15 OE cells, and the images are provided. Scale bar, 10 μm. C, Percentage of vinculin-positive cells in a total of 50 cells was counted and is represented as bar graph. D, Schematic representation of the invasion assay through the organotypic 3D culture model of the omentum surface. E, CMFDA-labeled EV control and LRRC15 OVCAR7 cells were allowed to invade the 3D culture matrix for 12 hours, and the representative images were provided. F, Similar invasion assay was performed in the OVCAR5 NTC and sh1 cells. G–H, Percent of invaded cells was scored for the 3D invasion assay and is presented as mean ± SEM, respectively. I, Wound healing assay was performed in the OVCAR5 NTC and sh1 cells, and in the EV control and LRRC15 OE OVCAR7 cells, the relative wound width was calculated using the ImageJ software and is represented. NS, not significant; *, P < 0.05; **, P < 0.01; ***, P < 0.001.
Figure 4.
Altered LRRC15 expression reveals distinct pattern of FA complex formation in ovarian cancer cells. A, OVCAR5 NTC and sh1 cells were grown on fibronectin-coated coverslips for 24 hours, followed by immunofluorescence study against F-actin (green) and vinculin (red) using the confocal microscopy. DAPI was used to stain the nucleus, and the merged images are represented. B, Similar immunofluorescence assay was performed in the OVCAR7 EV and LRRC15 OE cells, and the images are provided. Scale bar, 10 μm. C, Percentage of vinculin-positive cells in a total of 50 cells was counted and is represented as bar graph. D, Schematic representation of the invasion assay through the organotypic 3D culture model of the omentum surface. E, CMFDA-labeled EV control and LRRC15 OVCAR7 cells were allowed to invade the 3D culture matrix for 12 hours, and the representative images were provided. F, Similar invasion assay was performed in the OVCAR5 NTC and sh1 cells. G–H, Percent of invaded cells was scored for the 3D invasion assay and is presented as mean ± SEM, respectively. I, Wound healing assay was performed in the OVCAR5 NTC and sh1 cells, and in the EV control and LRRC15 OE OVCAR7 cells, the relative wound width was calculated using the ImageJ software and is represented. NS, not significant; *, P < 0.05; **, P < 0.01; ***, P < 0.001.
Figure 5. β1-integrin–LRRC15 interaction activates the FAK signaling. A and B, OVCAR5 NTC, sh1, and sh2 cells were grown in fibronectin-coated plates for 24 hours, followed by flow cytometry analysis against fluorescently tagged ITGB1 and CD44. C, Percent of cells with positive signal was plotted. D and E, Colocalization studies between LRRC15 (green) and ITGB1 (red) in the OVCAR5 NTC and sh1 cells (D) and in the OVCAR7 EV and LRRCl5 cells (E) were evaluated using the confocal imaging. DAPI was used to stain the nucleus and the merged images are represented in both the cases. Scale bar, 10 μm. F, OVCAR5 NTC and sh1 cell extracts were immunoprecipitated with anti-ITGB1 and the coprecipitated LRRC15 was detected by Western blot analysis and vice versa. G, Similar immunoprecipitation studies were performed in the OVCAR7 EV and LRRC15 overexpressing cells. GAPDH was used as a loading control in both the cases. H, NTC and sh1 OVCAR5 cells were grown on FN-coated plates for 6 hours, followed by Western blot analysis. FAK pathway activation was performed by analyzing the p-FAKy397 and total FAK levels. h, hours. I, Similar immunoblot analysis of OVCAR7 EV and LRRC15 cells. Proliferating cell nuclear antigen (PCNA) was used for loading control. LRRC15 KD and OE was confirmed by probing against LRRC15 in the cell lysates, respectively.
Figure 5.
β1-integrin–LRRC15 interaction activates the FAK signaling. A and B, OVCAR5 NTC, sh1, and sh2 cells were grown in fibronectin-coated plates for 24 hours, followed by flow cytometry analysis against fluorescently tagged ITGB1 and CD44. C, Percent of cells with positive signal was plotted. D and E, Colocalization studies between LRRC15 (green) and ITGB1 (red) in the OVCAR5 NTC and sh1 cells (D) and in the OVCAR7 EV and LRRCl5 cells (E) were evaluated using the confocal imaging. DAPI was used to stain the nucleus and the merged images are represented in both the cases. Scale bar, 10 μm. F, OVCAR5 NTC and sh1 cell extracts were immunoprecipitated with anti-ITGB1 and the coprecipitated LRRC15 was detected by Western blot analysis and vice versa. G, Similar immunoprecipitation studies were performed in the OVCAR7 EV and LRRC15 overexpressing cells. GAPDH was used as a loading control in both the cases. H, NTC and sh1 OVCAR5 cells were grown on FN-coated plates for 6 hours, followed by Western blot analysis. FAK pathway activation was performed by analyzing the p-FAKy397 and total FAK levels. h, hours. I, Similar immunoblot analysis of OVCAR7 EV and LRRC15 cells. Proliferating cell nuclear antigen (PCNA) was used for loading control. LRRC15 KD and OE was confirmed by probing against LRRC15 in the cell lysates, respectively.
Figure 6. ABBV-085 prevents peritoneal adhesion and inhibits tumor growth in early metastatic model of OVCAR5 xenografts. A, Schematic representation of the early metastatic study model in mice ovarian cancer xenograft. B, Pretreatment with control Isotype-mAb antibody (6 mg/kg), the Isotype-vc-MMAE-E2 drug control (6 mg/kg), and ABBV-085 (6 mg/kg) was initiated 3 days prior, followed by intraperitoneal OVCAR5 inoculation. Treatment was continued for 2 weeks as described previously and the animals were euthanized at day 36. Representative images of the mice with the tumor burden and metastatic nodes are shown. C, Representative images for the tumor burden per mice for the three treatment groups are provided. D, Graphical representation of the excised tumor weights in the 3 treatment cohorts. E, Abdominal circumference of each animal was measured on the day 36 across the treatment groups. F, Ki67 staining in each of the treated group was performed. G, Percent of Ki67-positive cells was quantified and is represented. *, P < 0.05; ***, P < 0.001; ****, P < 0.0001.
Figure 6.
ABBV-085 prevents peritoneal adhesion and inhibits tumor growth in early metastatic model of OVCAR5 xenografts. A, Schematic representation of the early metastatic study model in mice ovarian cancer xenograft. B, Pretreatment with control Isotype-mAb antibody (6 mg/kg), the Isotype-vc-MMAE-E2 drug control (6 mg/kg), and ABBV-085 (6 mg/kg) was initiated 3 days prior, followed by intraperitoneal OVCAR5 inoculation. Treatment was continued for 2 weeks as described previously and the animals were euthanized at day 36. Representative images of the mice with the tumor burden and metastatic nodes are shown. C, Representative images for the tumor burden per mice for the three treatment groups are provided. D, Graphical representation of the excised tumor weights in the 3 treatment cohorts. E, Abdominal circumference of each animal was measured on the day 36 across the treatment groups. F, Ki67 staining in each of the treated group was performed. G, Percent of Ki67-positive cells was quantified and is represented. *, P < 0.05; ***, P < 0.001; ****, P < 0.0001.
Figure 7. Treatment with ABBV-085 reduces cell viability in LRRC15-expressing human patient-derived ascites. A, Analysis of LRRC15 expression in 7 human patient-derived ascites. β-actin was shown as a loading control. B–G, Percent ATP level was analyzed upon treatment with ABBV-085 and drug controls in LRRC15 expressing A4832 (B), A3626 (C), JM067 (D), DC378 and LRRC15 (E), nonexpressing A7683 (F), and AM812 ascites (G) cells.
Figure 7.
Treatment with ABBV-085 reduces cell viability in LRRC15-expressing human patient-derived ascites. A, Analysis of LRRC15 expression in 7 human patient-derived ascites. β-actin was shown as a loading control. B–G, Percent ATP level was analyzed upon treatment with ABBV-085 and drug controls in LRRC15 expressing A4832 (B), A3626 (C), JM067 (D), DC378 and LRRC15 (E), nonexpressing A7683 (F), and AM812 ascites (G) cells.
Figure 8. Therapeutic efficacy of ABBV-085 in the PH127 and PH081 ovarian cancer PDX xenograft model. A, Schematic representation of the early metastatic model of PH127 PDX xenograft. B, Percent change in tumor area in PH127 PDX early metastatic model following treatments with ABBV-085 and control drugs as determined by ultrasound weekly. C, Graphical analysis of the time required for the detectable tumor engraftment in each mouse from the three treatment cohorts. D, Schematic representation of PH081 PDX in the pre- and posttreatment models. E and F, Percent change in tumor area in the PH081 PDX early metastatic model (E) and in the late metastatic model (F) following treatments with the drugs as determined by ultrasound weekly.
Figure 8.
Therapeutic efficacy of ABBV-085 in the PH127 and PH081 ovarian cancer PDX xenograft model. A, Schematic representation of the early metastatic model of PH127 PDX xenograft. B, Percent change in tumor area in PH127 PDX early metastatic model following treatments with ABBV-085 and control drugs as determined by ultrasound weekly. C, Graphical analysis of the time required for the detectable tumor engraftment in each mouse from the three treatment cohorts. D, Schematic representation of PH081 PDX in the pre- and posttreatment models. E and F, Percent change in tumor area in the PH081 PDX early metastatic model (E) and in the late metastatic model (F) following treatments with the drugs as determined by ultrasound weekly.

References

    1. Siegel RL, Miller KD, Jemal A. Cancer statistics, 2020. CA Cancer J Clin 2020;70:7–30. - PubMed
    1. Paul Olson TJ, Pinkerton C, Brasel KJ, Schwarze ML. Palliative surgery for malignant bowel obstruction from carcinomatosis: a systematic review. JAMA Surg 2014;149:383–92. - PMC - PubMed
    1. Mangili G, Aletti G, Frigerio L, Franchi M, Panacci N, Viganò R, et al. Palliative care for intestinal obstruction in recurrent ovarian cancer: a multivariate analysis. Int J Gynecol Cancer 2005;15:830–5. - PubMed
    1. Lengyel E. Ovarian cancer development and metastasis. Am J Pathol 2010;177:1053–64. - PMC - PubMed
    1. Feuer DJ, Broadley KE, Shepherd JH, Barton DP. Surgery for the resolution of symptoms in malignant bowel obstruction in advanced gynaecological and gastrointestinal cancer. Cochrane Database Syst Rev 2000:Cd002764.

Publication types