. 2021 Oct 15;12(10):950.
doi: 10.1038/s41419-021-04254-x.

CHD1L augments autophagy-mediated migration of hepatocellular carcinoma through targeting ZKSCAN3

Affiliations

CHD1L augments autophagy-mediated migration of hepatocellular carcinoma through targeting ZKSCAN3

Xiaofeng Zhang et al. Cell Death Dis. .

Abstract

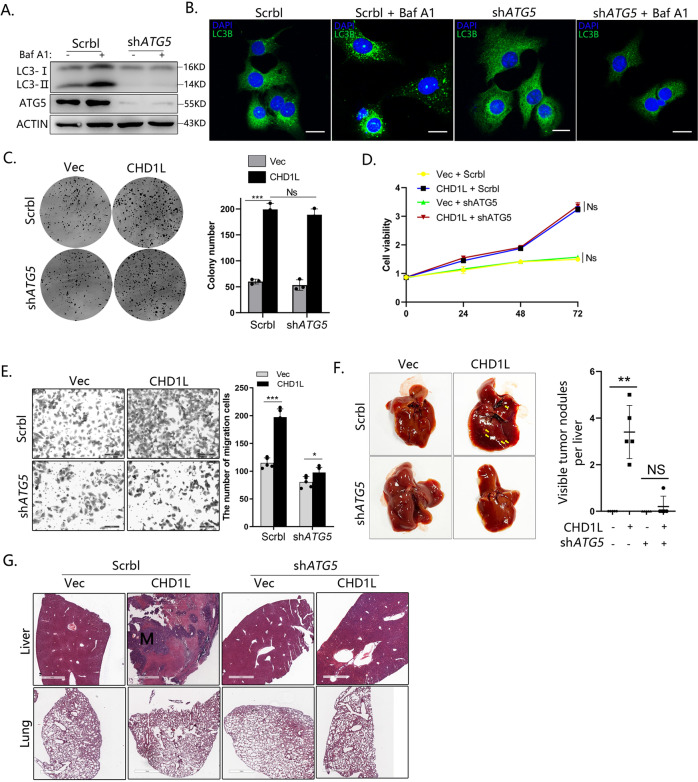
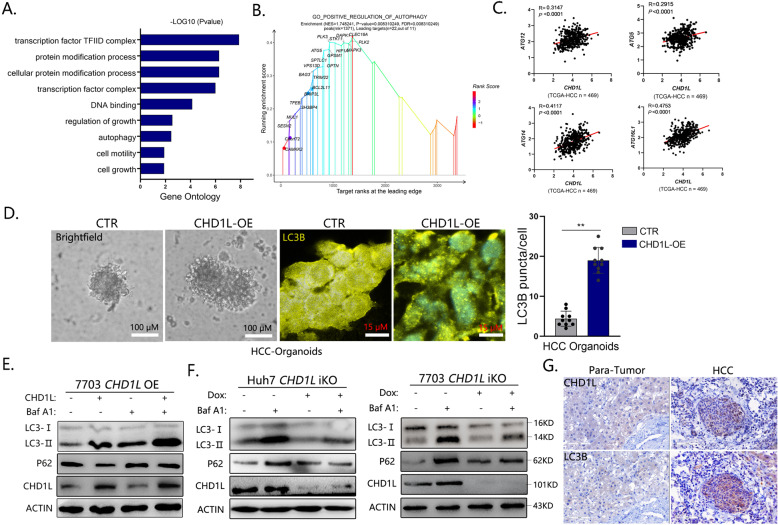
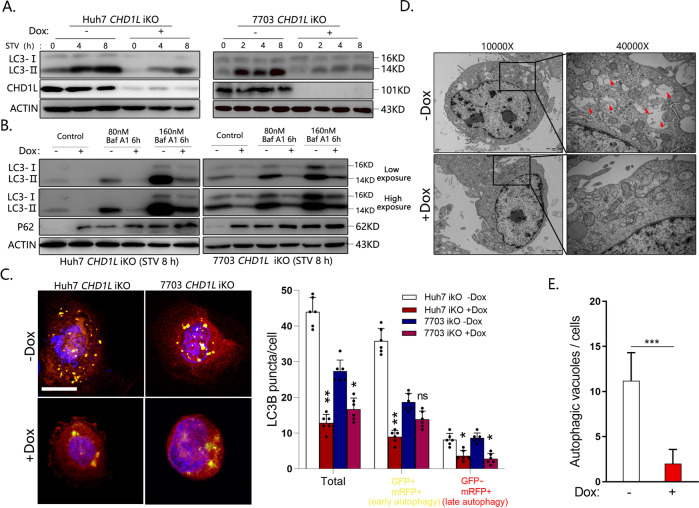
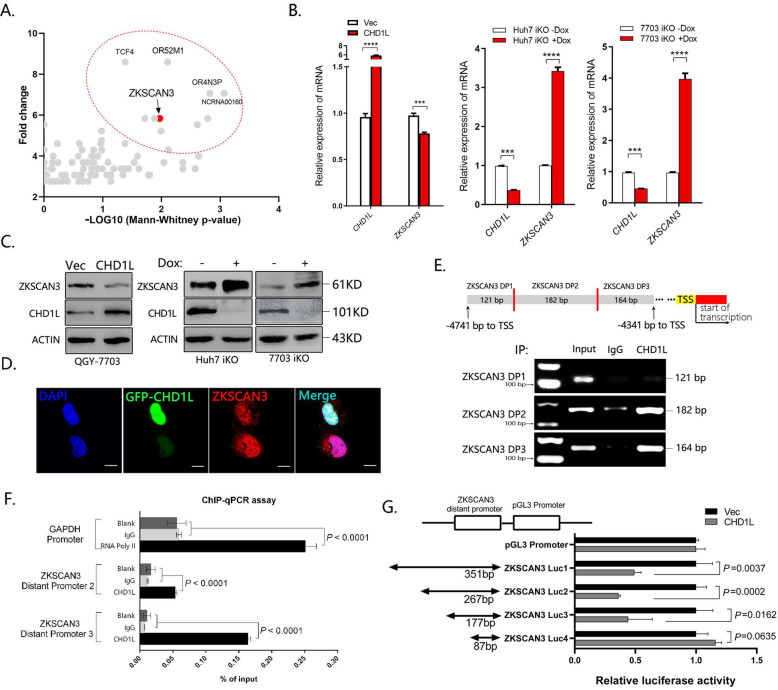
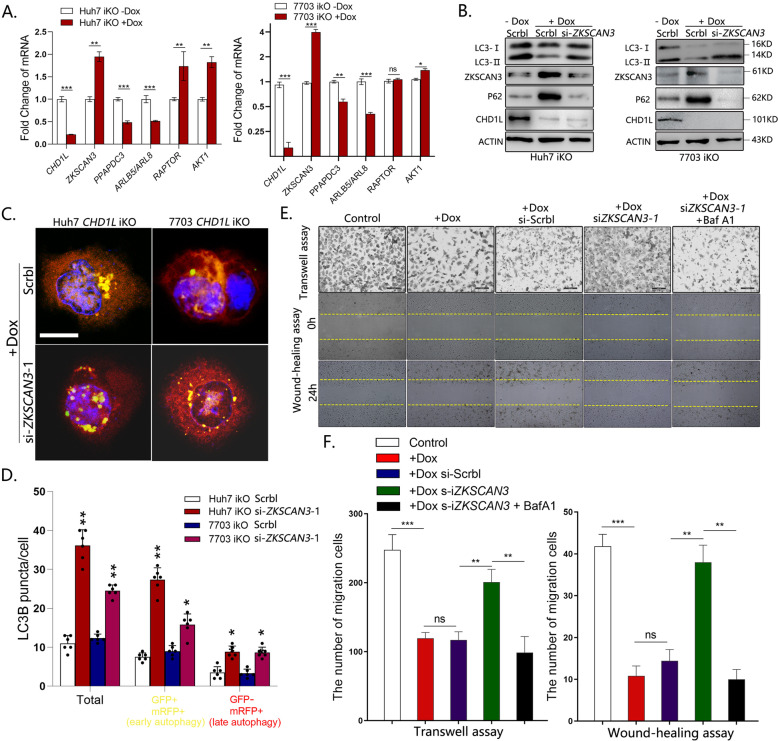
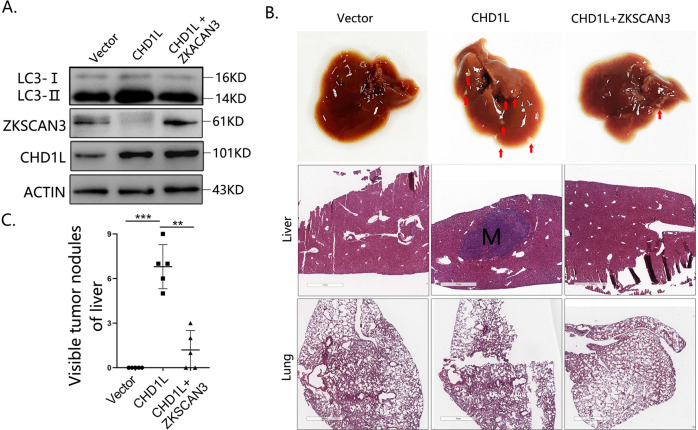
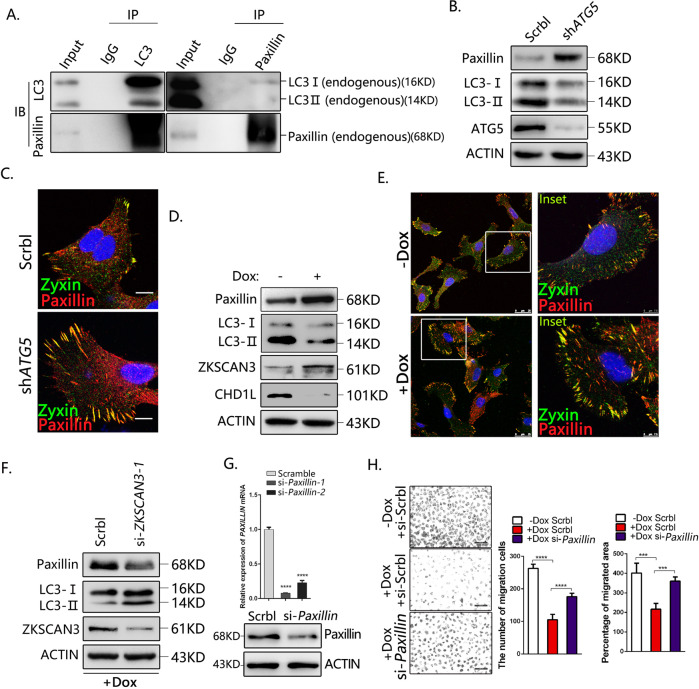
Autophagy is an important biological process in normal cells. However, how it affects tumor progression still remains poorly understood. Herein, we demonstrated that the oncogenic protein Chromodomain-helicase-DNA-binding-protein 1-like gene (CHD1L) might promote HCC cells migration and metastasis through autophagy. CHD1L could bind to the promotor region of Zinc finger with KRAB and SCAN domain 3 (ZKSCAN3), a pivotal autophagy suppressor, and inhibit its transcription. We established inducible CHD1L conditional knockout cell line (CHD1L-iKO cell) and found that the deletion of CHD1L significantly increased ZKSCAN3 expression both at mRNA and protein level. Deletion of CHD1L impaired the autophagic flux and migration of HCC cells, while specifically inhibiting ZKSCAN3 blocked these effects. Further exploration demonstrated that the enhanced tumor cell migration and metastasis induced by CHD1L was mediated through ZKSCAN3-induced autophagic degradation of Paxillin. In summary, we have characterized a previously unknown function of CHD1L in regulating tumor migration via ZKSCAN3-mediated autophagy in HCC. Further inhibition of CHD1L and its downstream autophagy signaling might shed new light on cancer therapeutics.


Conflict of interest statement

The authors declare no competing interests.

Figures

Fig. 1
Fig. 1. Blocking autophagy in HCC cells impair the role of CHD1L to cell metastasis but not cell growth.
A Western blot for ATG5 in Scrbl shRNA and ATG5 shRNA-expressing QGY-7703 clones in the presence or absence of 80 nM bafA1 (6 h). B Immunofluorescence for endogenous LC3B. C Crystal violet staining assays of Scrbl shRNA and ATG5 shRNA-expressing QGY-7703 clones in the indicated group for 2 weeks. D Cell growth in complete medium over 72 h. Mean ± SD, n = 3. E Migration assay and related quantification for Scrbl shRNA and ATG5 shRNA-expressing QGY-7703 clones in Vector or forced CHD1L group. (***p < 0.001, Ns no significant; Student’s t test; Mean ± SD, n = 5/group). F Representative overall picture of livers of mice with Scrbl shRNA and ATG5- shRNA in Vector or forced CHD1L tumors 6 weeks post-spleen injection. Mean number of livers metastases in mice with control or autophagy-deficient in Vector or forced CHD1L tumors at 6 weeks (**p < 0.01, Ns no significant; Student’s t test; Mean ± SD, n = 5/group). G Representative H&E-stained sections of lungs and livers of mice with Scrbl shRNA and ATG5- shRNA in Vector or forced CHD1L tumors 6-w post-spleen injection.
Fig. 2
Fig. 2. CHD1L promotes autophagy in HCC.
A Enrichment of the gene ontology (GO) terms of differential mRNAs in CHD1L- vs vector-QGY-7703 clones. B Performance of GSEA based on the differential genes in CHD1L- vs vector-QGY-7703 clones. Enrichment analysis was performed on the indicated gene sets. C Correlation plots show expression of indicated genes and CHD1L in 469 primary HCC tumor and para-tumor samples analyzed using RNA-sequencing in TCGA. D Bright light and immunofluorescence for endogenous LC3B images of patient-derived organoid (PDOs) established from HCC. Cystic PDO structures were recognized starting on day 6. Bar was as indicated, quantification of LC3B puncta per cell for Vector or forced CHD1L group. (**p < 0.01; Student’s t test; Mean ± SD, n = 10/group). E WB analysis for changes in LC3 conversion and P62 level affected by overexpression of CHD1L in the presence or absence of 80 nM Baf A1 (6 h). The QGY-7703 cells were transiently transfected with GFP-tagged CHD1L expressing constructs or the control vector. LC3-I, non-lipidated LC3; LC3-II, lipidated LC3. The β-actin protein was as a loading control. F WB analysis for changes in LC3 conversion and P62 level affected by CHD1L-deficient in the presence or absence of 80 nM bafA1 (6 h) in Huh7 and QGY-7703-iKO cells. G Representative IHC images for the expression of CHD1L and LC3B in primary HCC tumor.
Fig. 3
Fig. 3. Knockout of CHD1L significantly blocked the autophagic flux induced by starvation in HCC cells.
A WB analysis for starvation-induced changes in LC3 conversion in Dox (−/+)-induced Huh7 and QGY-7703-iKO cells. B WB analysis of changes induced by CHD1L ablation in LC3 conversion in Huh7 and QGY-7703-iKO cells treated with Baf A1 at indicated concentration. C Representative images showing starvation-induced mRFP-LC3 and GFP-mRFP-LC3 puncta accumulation in response to CHD1L deletion in Huh7 and QGY-7703-iKO cells. Quantification of mRFP-LC3 and GFP-mRFP-LC3 puncta per cell. Bar = 10 μM (*p < 0.05; **p < 0.01, ns No significant; Student’s t test; Data indicate mean ± SD; n = 5). D Ultrastructural evidence of autophagy induced by starvation in the indicated cells with CHD1L expression or ablation. The AVd indicate late/degradative autophagolysosomes. Magnification ×10,000–40,000, scale bar represents as shown. E Quantification for autophagic vacuoles as described in “Materials and methods”. (***p < 0.001, Student’s t test; Data indicate mean ± SD; n = 10). Images/immunoblots are representative of three independent experiments.
Fig. 4
Fig. 4. CHD1L inhibits ZKSCAN3 transcription.
A Visualization results of CHIP-seq by anti-CHD1L. Quantitative real-time-PCR (qRT–PCR) and WB were performed to determine the impact of CHD1L knockout or overexpression on mRNA (B) and protein (C) expression of ZKSCAN3 in Huh7 and QGY-7703 cells (***p < 0.001, ****p < 0.0001, Student’s t test). The Dox-induced CRISPR/Cas9 system (1 μg/ml, 72 h) was applied to knockout CHD1L in Huh7 and QGY-7703 cells, and the β-actin was used as loading control (referred to as ACTIN). D Representative images of CHD1L and ZKSCAN3 immunofluorescence staining in QGY-7703 cells transfected with GFP-tagged CHD1L. The stained cells were observed using confocal fluorescence microscopy. Scale bar represents: 10 μM. Images/immunoblots are representative of three independent experiments. Dox, Doxycycline. E, F Predicted CHD1L-binding site (ZKSCAN3 DP1, DP2 and DP3) within a region between 4741 to 4341 bp upstream of the TSS of ZKSCAN3 was evaluated by ChIP assay with anti-CHD1L IP in QGY-7703 cells. Anti-IgG IP was used as a negative control (E). ChIP-PCR was used to validate the binding of CHD1L to the identified promoter region of ZKSCAN3 in QGY-7703 cells (F). G Luciferase reporter assay in QGY-7703 cells using different fragments of ZKSCAN3 promoter after transfection with CHD1L or Vector, n = 3 biologically independent samples; data shown are mean ± SD. A two-sided Student’s t test was used to generate p values.
Fig. 5
Fig. 5. Silencing ZKSCAN3 rescue the lacked autophagy and migration due to deleting CHD1L in vitro.
A Huh7 and QGY-7703-iKO cells were detected for expression of indicated ZKSCAN3 downstream autophagy-related genes by fluorescent quantitative RT-PCR (**P < 0.01; ***P < 0.001; Student’s t test). Values are shown as mean ± SD calculated from three parallel experiments. B. WB analysis for LC3 conversion changes in CHD1L deleted cells in response to ZKSCAN3 knockdown by siZKSCAN3-1, compared to Scrbl control. C, D Representative images showing starvation-induced GFP-mRFP-LC3 and mRFP-LC3 puncta accumulation in CHD1L deleted cells in response to ZKSCAN3 knockdown. GFP-mRFP-LC3 and mRFP-LC3 puncta per cell were quantified. Scale bar represents: 10 μM (*p < 0.01; **p < 0.01; Student’s t test; Data indicate mean ± SD; n = 5). Images/immunoblots are representative of three independent experiments. E, F. QGY-7703 cells treated as indicated (with PBS control, Baf A1 (40 nM)) were plated in the upper chamber of the filters for 24 h and then, the cells migrated to the underside of the Transwell insert were counted, scale bar: 100 μm. Baf A1: 40 nM. QGY-7703 cells treated as indicated were subjected to wound-healing assay (Upper). Quantification of migration in Transwell assay and migrated area in wound-healing assay (Lower) (**p < 0.01; ***p < 0.001; ns no significant; Student t test; n = 5).
Fig. 6
Fig. 6. Both autophagy level and migration ability mediated by CHD1L were diminished through overexpression of ZKSCAN3 on HCC cells in vivo.
A WB analysis for the changes of LC3 conversion, CHD1L, and ZKSCAN3 in QGY-7703 cells treated as indicated. B QGY-7703 cells stably transfected with CHD1L or CHD1L + ZKSCAN3 and their control lentivirus were intrasplenically inoculated into BALB/c nude mice for 6 weeks (The red arrow represents the visible metastasis). Representative histopathological examination images of the BALB/c nude mice liver and lung injected with the constructed QGY-7703-Vec, QGY-7703-CHD1L, and QGY-7703-CHD1L + ZKSCN3 cells. (Scale bars = 100 μm). C Visualize statistics of tumor metastases (**p < 0.01, ***p < 0.001; Mean ± SD, = 5/group).
Fig. 7
Fig. 7. CHD1L-ZKSCAN3 axis promotes HCC migration partially through autophagic degradation of Paxillin.
A Co-IP assays of interaction between LC3B and Paxillin in QGY-7703 cells. The precipitates were examined with anti-Paxillin and anti-LC3B antibodies, respectively. B WB analysis for Paxillin accumulation in QGY-7703 cells treated with Sreamble or shRNA for ATG5. C Immunofluorescence of FA proteins Paxillin and Zyxin in control and ATG5 silencing cells. Scale bars: 10 μM. D WB analysis for Paxillin accumulation in QGY-7703 cells treated with or without Dox. E Immunofluorescence of FA proteins Paxillin and Zyxin in QGY-7703 cell with or without Dox inducing. Scale bars represent as shown. F Paxillin accumulation defects in CHD1L-depleted cells in response to ZKSCAN3 knockdown. Images/immunoblots are representative of three independent experiments. G The mRNA and protein level of Paxillin was analyzed in QGY-7703 cells treated with the most efficient siRNA fragment for Paxillin (hereafter referred to as si-Paxillin), compared with the scrambled control. H QGY-7703 cells with Dox treated were subjected to wound-healing assay and migration in response to Paxillin knockdown, compared with the scrambled control. Quantification of migration indicated group (****p < 0.0001, Student t test; values are shown as mean ± SD calculated from three parallel experiments; n = 5). Scale bar as indicated.

References

    1. White E, Mehnert JM, Chan CS. Autophagy, metabolism, and cancer. Clin Cancer Res. 2015;21:5037–46. doi: 10.1158/1078-0432.CCR-15-0490. - DOI - PMC - PubMed
    1. Amaravadi RK, Kimmelman AC, Debnath J. Targeting autophagy in cancer: recent advances and future directions. Cancer Discov. 2019;9:1167–81. doi: 10.1158/2159-8290.CD-19-0292. - DOI - PMC - PubMed
    1. Yamamoto K, Venida A, Yano J, Biancur DE, Kakiuchi M, Gupta S, et al. Autophagy promotes immune evasion of pancreatic cancer by degrading MHC-I. Nature. 2020;581:100–5. doi: 10.1038/s41586-020-2229-5. - DOI - PMC - PubMed
    1. Galluzzi L, Pietrocola F, Bravo-San Pedro JM, Amaravadi RK, Baehrecke EH, Cecconi F, et al. Autophagy in malignant transformation and cancer progression. EMBO J. 2015;34:856–80. doi: 10.15252/embj.201490784. - DOI - PMC - PubMed
    1. El Hout M, Cosialls E, Mehrpour M, Hamaï A. Crosstalk between autophagy and metabolic regulation of cancer stem cells. Mol Cancer. 2020;19:27. doi: 10.1186/s12943-019-1126-8. - DOI - PMC - PubMed

Publication types

MeSH terms

LinkOut - more resources