. 2021 Oct 15;12(1):6035.
doi: 10.1038/s41467-021-25942-4.

Compensatory ion transport buffers daily protein rhythms to regulate osmotic balance and cellular physiology

Affiliations

Compensatory ion transport buffers daily protein rhythms to regulate osmotic balance and cellular physiology

Alessandra Stangherlin et al. Nat Commun. .

Erratum in

Abstract

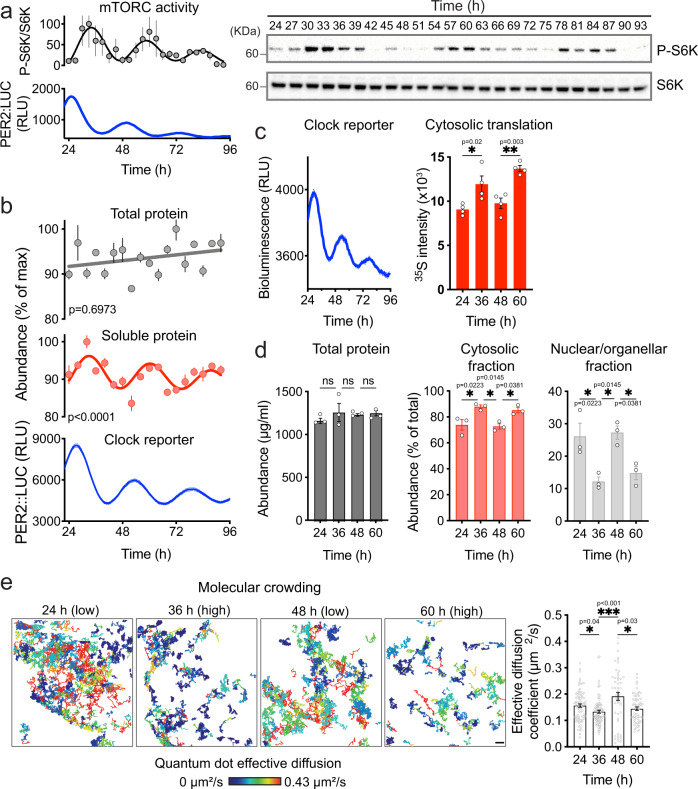
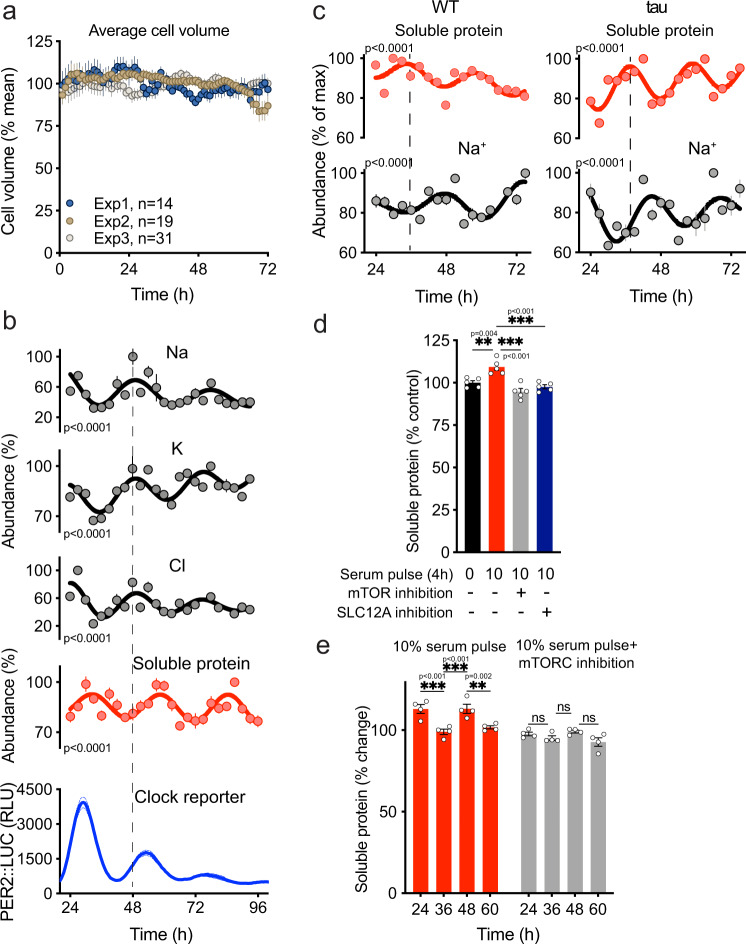
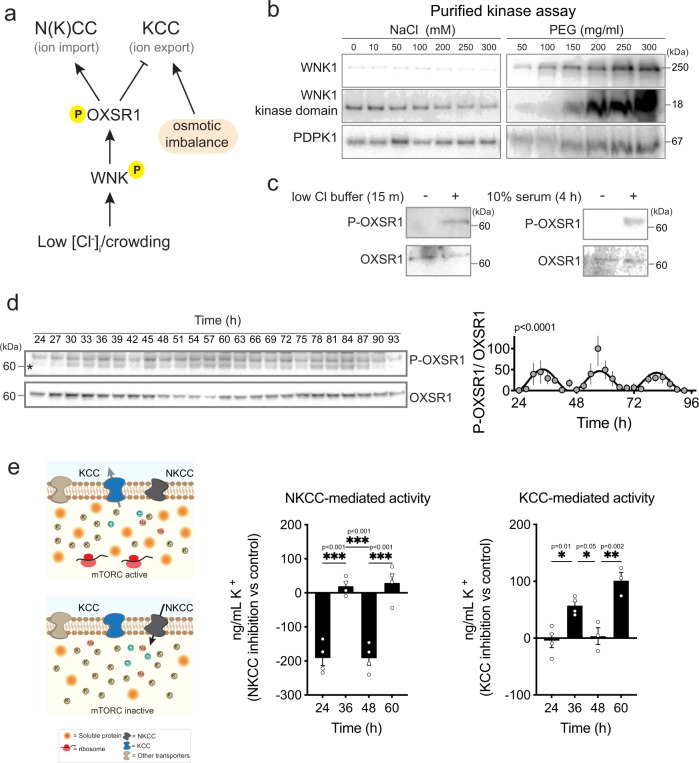
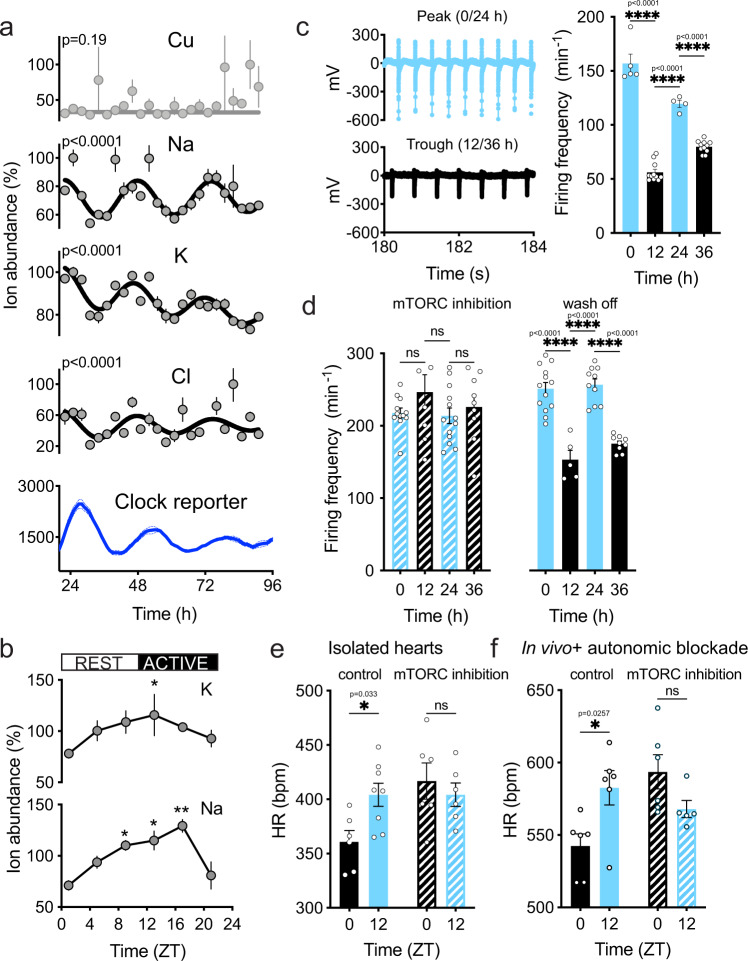
Between 6-20% of the cellular proteome is under circadian control and tunes mammalian cell function with daily environmental cycles. For cell viability, and to maintain volume within narrow limits, the daily variation in osmotic potential exerted by changes in the soluble proteome must be counterbalanced. The mechanisms and consequences of this osmotic compensation have not been investigated before. In cultured cells and in tissue we find that compensation involves electroneutral active transport of Na+, K+, and Cl- through differential activity of SLC12A family cotransporters. In cardiomyocytes ex vivo and in vivo, compensatory ion fluxes confer daily variation in electrical activity. Perturbation of soluble protein abundance has commensurate effects on ion composition and cellular function across the circadian cycle. Thus, circadian regulation of the proteome impacts ion homeostasis with substantial consequences for the physiology of electrically active cells such as cardiomyocytes.


Conflict of interest statement

P.N. holds shares in AstraZeneca. The other authors declare no competing interests.

Figures

Fig. 1
Fig. 1. Circadian variation in cytosolic protein content in mouse fibroblasts.
a Cell-autonomous circadian mTORC1 activity detected by immunoblots of phospho-S6 kinase and S6 kinase abundance in fibroblasts sampled every 3 h over 3 days in constant conditions (n = 3) (right). Blot quantification and parallel PER2::LUC bioluminescent clock reporter (n = 3) (left). b Total and soluble protein quantification of cell lysates sampled ever 4 h (n = 3) and parallel PER2::LUC bioluminescent clock reporter in fibroblasts (n = 3). Protein abundance values were normalized for the maximal value in each timeseries. c 35S-met/cys incorporation assay at peak (36 h/60 h) and trough (24 h/48 h) of S6K phosphorylation rhythms (n = 4) and parallel PER2::LUC activity (n = 3). d Protein quantification of total cell lysates, nuclear/organellar, and cytosolic fractions at peak (36 h/60 h) and trough (24 h/48 h) of protein rhythms (n = 3). e Effective diffusion rate of QDs in fibroblasts (n = 81, 83, 51, 63, respectively) and representative tracking images. Color key represents diffusion rate. Scale bar: 1 µm. Mean ± SEM shown throughout. p-values in (b) indicate comparison of damped cosine wave with straight-line fit (null hypothesis = no rhythm). Significance was calculated using one-way ANOVA and Tukey’s multi comparisons test (MCT) (c), one-way ANOVA and Sidak’s MCT (d), and Kruskal-Wallis with Dunn’s MCT (e). Cell type used was lung fibroblasts for (ad) and cardiac fibroblasts for (e).
Fig. 2
Fig. 2. Ion flux buffers changes in cytosolic protein abundance in mouse fibroblasts.
a Mean cell volume of fibroblasts across time from three independent recordings. Average cell volume data were normalized for the average of all values within each replicate. b Abundance of selected ions (n = 4), soluble protein (n = 3), and PER2::LUC bioluminescence recordings (n = 3) in fibroblasts. Abundance values were normalized for the maximal value in each timeseries. c Quantification of intracellular Na+ (n = 4) and labile cytosolic protein abundance (n = 3) in WT and tau mutant fibroblasts under constant conditions over 2 days. d % change in soluble protein upon 4 h treatment with 10% serum ± 50 nM mTOR inhibitor torin1 or 10% serum ± 50 μM DIOA and 100 μM Bumetanide (n = 3). e % fold increase in soluble protein upon 4 h treatment with 10% serum ± 50 nM mTOR inhibitor torin1 at indicated times (n = 4). Mean ± SEM shown throughout. p values in (b) and (c) indicate comparison of damped cosine wave with straight-line fit (null hypothesis = no rhythm). Statistical tests were one-way ANOVA and Tukey (d) and two-way ANOVA and Sidak’s MCT (e). Cell type used was lung fibroblasts for (c) and cardiac fibroblasts for (a, b, d, e).
Fig. 3
Fig. 3. Circadian regulation of the WNK/OXSR1/SLC12A pathway activity.
a Schematic of the WNK/OXSR1 pathway and regulation of the N(K)CC and KCC transporters. b In vitro kinase activity assays for purified WNK1 and 3-Phosphoinositide Dependent Protein Kinase 1 (PDPK1) upon increasing concentrations of NaCl or polyethylene glycol (PEG) (n = 1). WNK1 but not PDPK1 is sensitive to increased macromolecular crowding (mimicked by PEG). Note that WNK1 is inhibited by high concentrations of Cl. c Phosphorylation of cellular OXSR1 upon hypotonic treatment and serum, indicating that decreased intracellular Cl and increased cytosolic crowding lead to OXSR1 phosphorylation (n = 1). d Representative immunoblots and quantification showing phospho-OXSR1 and OXSR1 abundance in fibroblasts sampled every 3 h for 3 days in constant conditions (n = 3). The asterisk indicates the P-OXSR1 band. p value indicates comparison of damped cosine wave with straight-line fit (null hypothesis = no rhythm). e Model prediction and data showing the difference in cytosolic K+ (digitonin-extracted lysates) between cells treated with DIOA (KCC inhibitor) or bumetanide (NKCC inhibitor) compared with vehicle-treated cells at the indicated time points. Cells were treated for 15 min before sampling (n = 4). Statistical test used was two-way ANOVA with Sidak’s MCT. Mean ± SEM shown throughout. Cell type used was lung fibroblasts (ce).
Fig. 4
Fig. 4. Ion fluxes facilitate circadian modulation of cardiomyocyte electrophysiology.
a Abundance of selected ions and PER2::LUC reporter activity in primary cardiomyocytes (n = 4) under constant conditions. Values were normalized to maximal values in each timeseries. p values indicate comparison of damped cosine wave with straight-line fit (null hypothesis = no rhythm). b Cellular ion content of adult mouse heart tissue under diurnal conditions (n = 3, normalized to total protein). c Representative field potential traces of cardiomyocytes at peak or trough of ion rhythms and action potential frequency (representative biological replicate, mean signal from active electrodes is shown, n = 5, 11, 4, and 11, respectively). d Action potential frequency in primary cardiomyocytes at peak and trough of ion rhythms in the presence of the mTOR inhibitor torin1 (50 nM), and wash off from a representative biological replicate (mean values from active electrodes are presented, n = 12, 8, 13, and 9 for torin1 and 10, 3, 3, and 5 for wash off). e Heart rate (HR) measured ex vivo in Langendorff-perfused hearts from control and rapamycin-treated mice collected at ZT0 and ZT12 (n = 6 control ZT0, n = 8 control ZT12, n = 6 mTORC inhibition ZT0, n = 8 mTORC inhibition ZT12). f HR measured in vivo by telemetry in control (n = 6) or rapamycin-treated mice (n = 5) treated with metoprolol and atropine. Time-of-day variation in heart rate persists under complete autonomic blockade. Mean ± SEM shown throughout. Statistical tests are one-way ANOVA with Tukey’s MCT (b) and (c), Two-way ANOVA with Dunnett’s MCT (d), one-way ANOVA, and Sidak MCT (e), and mixed-effect analysis and Sidak MCT (f).

References

    1. Reddy AB, et al. Circadian orchestration of the hepatic proteome. Curr. Biol. 2006;16:1107–1115. - PubMed
    1. Hoyle NP, et al. Circadian actin dynamics drive rhythmic fibroblast mobilization during wound healing. Sci. Transl. Med. 2017;9:eaal2774. - PMC - PubMed
    1. Robles MS, Cox J, Mann M. In-vivo quantitative proteomics reveals a key contribution of post-transcriptional mechanisms to the circadian regulation of liver metabolism. PLoS Genet. 2014;10:e1004047. - PMC - PubMed
    1. Jang C, Lahens NF, Hogenesch JB, Sehgal A. Ribosome profiling reveals an important role for translational control in circadian gene expression. Genome Res. 2015;25:1836–1847. - PMC - PubMed
    1. Atger F, et al. Circadian and feeding rhythms differentially affect rhythmic mRNA transcription and translation in mouse liver. Proc. Natl Acad. Sci. 2015;112:E6579–E6588. - PMC - PubMed

Publication types

LinkOut - more resources