. 2021 Oct 15;12(1):6040.
doi: 10.1038/s41467-021-26247-2.

Ketamine increases activity of a fronto-striatal projection that regulates compulsive behavior in SAPAP3 knockout mice

Affiliations

Ketamine increases activity of a fronto-striatal projection that regulates compulsive behavior in SAPAP3 knockout mice

Gwynne L Davis et al. Nat Commun. .

Abstract

Obsessive-Compulsive Disorder (OCD), characterized by intrusive thoughts (obsessions) and repetitive behaviors (compulsions), is associated with dysfunction in fronto-striatal circuits. There are currently no fast-acting pharmacological treatments for OCD. However, recent clinical studies demonstrated that an intravenous infusion of ketamine rapidly reduces OCD symptoms. To probe mechanisms underlying ketamine's therapeutic effect on OCD-like behaviors, we used the SAPAP3 knockout (KO) mouse model of compulsive grooming. Here we recapitulate the fast-acting therapeutic effect of ketamine on compulsive behavior, and show that ketamine increases activity of dorsomedial prefrontal neurons projecting to the dorsomedial striatum in KO mice. Optogenetically mimicking this increase in fronto-striatal activity reduced compulsive grooming behavior in KO mice. Conversely, inhibiting this circuit in wild-type mice increased grooming. Finally, we demonstrate that ketamine blocks the exacerbation of grooming in KO mice caused by optogenetically inhibiting fronto-striatal activity. These studies demonstrate that ketamine increases activity in a fronto-striatal circuit that causally controls compulsive grooming behavior, suggesting this circuit may be important for ketamine's therapeutic effects in OCD.


Conflict of interest statement

In the last 3 years, Dr. Rodriguez has served as a consultant for Epiodyne and received research grant support from Biohaven Pharmaceuticals and a stipend from APA Publishing for her role as Deputy Editor at The American Journal of Psychiatry. All other authors report no financial or other relationships relevant to the subject of this manuscript.

Figures

Fig. 1
Fig. 1. Grooming-associated changes in fronto-striatal activity.
a KO mice groom more than WT littermates (unpaired two-tailed t-test P = 0.0083; WT = 15, KO = 15). b Mice are injected with CAV2-Cre in the DMS and Cre-dependent GCaMP6m in the dmPFC, with optical fibers implanted in the dmPFC. c Peak amplitude of calcium transients (unpaired two-tailed t test, P = 0.2709, WT = 130 grooming epochs from 11 mice, KO = 118 grooming epochs from 10 mince). d Frequency of calcium transients during grooming (unpaired two-tailed t-test P = 0.0090; WT = 130 grooming epochs from 11 animals, KO = 118 grooming epochs from 10 animals). e PETH of averaged z-score calcium signals aligned to the start of grooming in WT mice (green line, N = 113 groom epochs from 11 WTs, green bar above represents average length of WT grooming epochs). f KO PETH of averaged z-score calcium signals during grooming (purple line, purple bar above represents average length of grooming epochs for KO, N = 73 groom epochs from 10 KOs). g Normalized area under the curve (AUC) analysis of calcium signal during grooming shown as truncated violin plot (left) and bar graph (right) (unpaired two-tailed t-test P = 0.0342; WT = 113 groom epochs from 11 animals, KO = 73 groom epochs from 10 animals). h PETH of averaged z-score signals aligned to the end of grooming in WT mice (N = 113 groom epochs from 11 WTs). i KO PETH of averaged z-score signals aligned to the end of grooming (N = 73 groom epochs from 10 KOs). j AUC analysis of calcium signal post-grooming shown as truncated violin plot (left) and bar graph (right) (unpaired two-tailed t-test P = 0.3961, WT = 113 groom epochs from 11 WTs, KO = 73 groom epochs from 10 KOs). Bar graphs and peri-event time histograms (PETH) show data means +/− SEM. Truncated violin plots end at distribution minimum and maximum, dotted lines mark 25% and 75% quartiles, cross denotes mean. Source data are provided as a Source data file. *P < 0.05, **P < 0.01.
Fig. 2
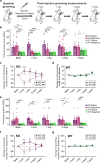
Fig. 2. Ketamine reduces compulsive grooming in SAPAP3 KO mice.
a Schematic of experiment. b KO mice have higher baseline grooming frequency compared to WT controls. Ketamine reduces grooming frequency in KO animals 1-h and 1-day post-injection (two-way RM ANOVA: interaction P = 0.0002, time P = 0.0250, experimental group P < 0.0001, subject P < 0.001; significance derived from Tukey’s multiple comparisons are marked with asterisk(s); see Supplementary Fig. 4 for exact P values). c KO mice given ketamine have reduced grooming frequency compared to KO mice given saline (two-way RM ANOVA: interaction P = 0.0015, time P > 0.05, experimental group P = 0.0115, subject P < 0.0001; Sidak’s multiple comparisons: 1-h timepoint P = 0.0002, 1-day timepoint P = 0.0138). d WT mice show no change in grooming frequency between treatment groups (two-way RM ANOVA: interaction P = 0.7892, time P < 0.0001, experimental group P = 0.7173, subject P < 0.0001). e Ketamine attenuates grooming duration in KO animals 1-h post-injection. Saline injection increases KO grooming compared to WT controls 1 h, 1 day, and 3 days post-injection (two-way RM ANOVA: interaction P = 0.0081, time P = 0.5614, experimental group P < 0.0001, subject P < 0.0001; significance derived from Tukey’s multiple comparisons are marked with asterisk(s); see Supplementary Fig. 4 for exact P values). f KO-ketamine mice have decreased grooming duration compared to the KO saline group (two-way RM ANOVA: interaction P = 0.0208, time P = 0.7935, experimental group P = 0.0040, subject P = 0.0864; Sidak’s multiple comparisons: 1-h timepoint P = 0.0026, 1-day timepoint P = 0.0120). g WT mice displayed no difference in grooming between treatment groups (two-way RM ANOVA: interaction P = 0.4333, time P = 0.0069, experimental group P = 0.7587, subject P < 0.0001). Bar and line graphs show data means +/− SEM. WT saline = 14, WT ketamine = 13, KO saline = 11, KO ketamine = 12. Source data are provided as a Source data file. *P < 0.05, **P < 0.01, ***P < 0.001, ****P < 0.0001.
Fig. 3
Fig. 3. Effect of ketamine on fronto-striatal circuit activity.
a Schematic showing fiber photometry recording of dmPFC-DMS projection neurons 24 h after mice are injected with saline or ketamine. b KO mice show a significant decrease in grooming duration compared to WT mice after ketamine injection (unpaired two-tailed t test P < 0.0001, WT = 16 animals, KO = 15 animals). c No change in the frequency of calcium transients between saline and ketamine groups (two-way ANOVA; interaction P > 0.05, genotype P > 0.05, drug P > 0.05; WT = 66 saline groom epochs and 70 ketamine groom epochs from 11 animals, KO saline = 69 groom epochs from 10 animals, KO ketamine = 25 groom epochs from 9 animals). d Ketamine significantly increases the amplitude of calcium transients during grooming epochs in KO animals but not WT animals 24 h post-injection (two-way ANOVA: interaction P < 0.0001, drug P < 0.0001, genotype P > 0.05; Tukey’s multiple comparisons: WT saline vs KO ketamine P = 0.0047, WT ketamine vs KO ketamine P = 0.0020, KO saline vs KO ketamine P < 0.0001; WT = 66 saline groom epochs and 70 ketamine groom epochs from 11 animals, KO saline = 69 groom epochs from 10 animals, KO ketamine = 25 groom epochs from 9 animals). e Ketamine does not significantly increase amplitude of calcium transients during grooming epochs in KO mice that do not have a reduction in grooming behavior post-ketamine (two-way ANOVA; interaction P > 0.05, treatment P = 0.0160, responder-type P > 0.05; Tukey’s multiple comparisons: responders, KO saline vs KO ketamine P < 0.0001; responders, KO saline = 69 groom epochs from 10 animals, KO ketamine = 25 groom epochs from 9 animals; non-responders, KO saline = 6 groom epochs from 2 animals, KO ketamine = 10 groom epochs from 2 animals). Bar graphs and PETHs show data means +/− SEM. Truncated violin plots end at distribution minimum and maximum, dotted lines mark 25% and 75% quartiles, cross denotes data means. Source data are provided as a Source data file. **P < 0.01, ****P < 0.0001.
Fig. 4
Fig. 4. Additional effects of ketamine on fronto-striatal circuit activity.
a PETHs of averaged z-score signals aligned to grooming onset (green bar represents average length of grooming epoch) after saline (left, N = 51 groom epochs from 11 WTs) and ketamine injections (right, N = 55 groom epochs from 11 WTs) in WT animals. b PETHs of averaged z-score signals aligned to grooming onset in KO animals after saline (left, N = 46 groom epochs from 10 KOs) and ketamine injections (right, N = 17 groom epochs from 9 KOs). c Area under the curve (AUC) quantification for each grooming epoch shown as truncated violin plot (left) and bar graph (right). Two-way ANOVA; interaction P = 0.0592, genotype P = 0.0129, drug effect P = 0.0110; Tukey’s multiple comparison test: WT saline vs KO ketamine P = 0.0113, WT ketamine vs KO ketamine P = 0.0313, KO saline vs KO ketamine P = 0.0407; WT = 51 grooming epochs with saline and 55 grooming epochs with ketamine from 11 animals, KO saline = 46 grooming epochs from 10 animals, KO ketamine = 17 grooming epochs from 9 animals). d PETHs of averaged z-score signals aligned to the end of grooming in WT mice after saline (left, N = 51 groom epochs from 11 WTs) and ketamine (right, N = 55 groom epochs from 11 WTs). e PETHs of averaged z-score signals aligned to the end of grooming in KO mice after saline (left, N = 46 groom epochs from 10 KOs) and ketamine (right, N = 17 groom epochs from 9 KOs). f AUC analysis of neural signal after groom end shown as truncated violin plot (left) and bar graph (right). Two-way ANOVA: interaction P = 0.0243, genotype P > 0.05, treatment P = 0.0096; Tukey’s multiple comparisons: KO saline vs KO ketamine P = 0.0180). Bar graphs and Peri-event time histograms (PETHs) show means +/− SEM. Truncated violin plots end at distribution minimum and maximum, dotted lines mark 25%–75% quartiles, cross denotes means. Source data are provided as a Source data file. *P < 0.05.
Fig. 5
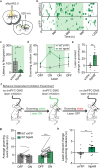
Fig. 5. Optogenetic inhibition of dmPFC-DMS projections increases grooming in WT mice.
a WT mice are bilaterally injected with CaMKIIα-eNpHR3.0 virus in the dmPFC and implanted bilaterally with optical fibers in the DMS. b Raster-like plot of grooming behavior for individual animals across experimental timeline (top: eNpHR3.0; bottom: eYFP control). Each row represents one animal. Dark green dashes indicate grooming timestamps and light green shading indicates when laser was on (8 mice per group). c eNpHR3.0 mice began grooming significantly sooner than eYFP mice after laser onset (unpaired two-tailed t-test P = 0.0150). d eNpHR3.0 mice (N = 8) show increased grooming during laser on epochs that is significantly higher than eYFP controls (N = 8) (two-way RM ANOVA: interaction P = 0.0395, laser P = 0.0841, virus group P = 0.0010, subject P = 0.1264; Sidak’s multiple comparisons: eNpHR3.0 vs eYFP first laser on epoch P < 0.0001). e Bar graph quantifying data from (d) showing that eNpHR3.0 mice have a significant laser-evoked increase in grooming compared to eYFP mice (unpaired two-tailed t test P = 0.0083). f graphical representation of behavior-dependent inhibition experiment. g Mice expressing eNpHR3.0 (N = 18) show an average increase in the duration of grooming epochs when the laser is turned on during grooming that is not seen in eYFP-WT mice (N = 10) (two-way RM ANOVA: interaction P = 0.0043, laser P = 0.0526, virus P > 0.5, subject P = 0.0010; Sidak’s multiple comparisons: eNpHR3.0 Off vs eNpHR3.0 On P = 0.0004). Black lines represent individual animals. Lines start and stop at individual animal’s average grooming event duration during laser off and on conditions. h Laser inhibition of dmPFC-DMS projections significantly extends the average duration of grooming epochs in NpHR-WT mice (N = 18) compared to eYFP-WT mice (N = 10) (unpaired two-tailed t-test P = 0.0043). Bar and line graphs show data means +/− SEM. Source data are provided as a Source data file. *P < 0.05, **P < 0.01, ***P < 0.001, ****P < 0.0001.
Fig. 6
Fig. 6. Optogenetic stimulation of dmPFC-DMS projections reduces compulsive grooming in SAPAP3 KO mice.
Bar and line graphs show data means +/− SEM. Source data are provided as a Source data file. *P < 0.05, **P < 0.01, ***P < 0.001. Black lines on bar graph’s represent individual animals. Lines start and stop at individual animal’s average for that graph’s conditions. a Cartoon of viral injection and implant. b Graphical representation of behavior-dependent stimulation experiment (ChR2-KO mice = 7, eYFP-KO mice = 6). c Duration of grooming epochs during behavior-dependent stimulation (two-way RM ANOVA: interaction P = 0.0252, laser P = 0.0241, virus P > 0.05, subject P = 0.0043; Sidak’s multiple comparisons: ChR2-KO on vs off P = 0.0056). d Laser-evoked change in average duration of grooming epochs (unpaired two-tailed t-test P = 0.0252). e Graphical representation of time-dependent stimulation experiment (ChR2-KO = 15, ChR2-WT = 18, eYFP-KO = 10, eYFP-WT = 11). f Grooming duration across 5-min blocks (two-way RM ANOVA: interaction P = 0.0430, laser P < 0.0001, genotype P = 0.0018, subject P < 0.0001; Sidak’s multiple comparisons: baseline ChR2-WT vs ChR2-KO P = 0.0043, laser off ChR2-WT vs ChR2-KO P = 0.0007). g Laser-evoked reduction in grooming behavior relative to baseline (one-way ANOVA P = 0.0104; Tukey’s multiple comparisons: eYFP-KO vs ChR2-KO P = 0.0120). h Following 2 weeks of repeated stimulation, KO-ChR2 mice have a significant and sustained reduction in grooming behavior 4 days after the last laser stimulation session (two-way RM ANOVA: interaction P = 0.0354, time P = 0.0070, experimental group P < 0.0001, subject P = 0.0190; Sidak’s multiple comparisons: ChR2-KO baseline vs 4 days post-stimulation P = 0.0015). i Four days after the final stimulation, KO-ChR2 mice show a significantly greater decrease from baseline grooming behavior than WT ChR2 mice (unpaired two-tailed t test P = 0.0230).
Fig. 7
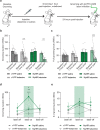
Fig. 7. Ketamine blocks grooming increase caused by inhibition of dmPFC-DMS projections in SAPAP3 KO mice.
Bar and line graphs show data means +/− SEM. Black lines on bar graphs represent individual animals. Lines start and stop at individual animal’s average for that graph’s conditions. Source data are provided as a Source data file. *P < 0.05, **P < 0.01, ***P < 0.001. a SAPAP3 KO with bilateral implants in the DMS expressing either eYFP or eNpHR3.0 in the dmPFC are injected with either saline or ketamine followed by grooming measurements. b Ketamine reduces grooming duration 1-h post-injection (two-way RM ANOVA: interaction P = 0.0181, treatment P > 0.05, time P = 0.0003, subject P = 0.0027; Sidak’s multiple comparisons: ketamine KO-eYFP baseline vs 1-h P = 0.0061, ketamine KO-NpHR baseline vs 1-h P = 0.0033; saline KO-eYFP = 5, ketamine KO-eYFP = 6, saline KO-NpHR = 6, ketamine KO-NpHR = 7). c Only SAPAP3 KO-NpHR that receive ketamine show a significant reduction in grooming frequency 1-h post-injection (two-way RM ANOVA: interaction P = 0.0278, treatment P > 0.05, time P = 0.0045, subject P = 0.0260; Sidak’s multiple comparisons: ketamine KO-NpHR baseline vs 1-h P = 0.0009; saline KO-eYFP = 5, ketamine KO-eYFP = 6, saline KO-NpHR = 6, ketamine KO-NpHR = 7). d Inhibition of dmPFC-DMS projections significantly increases grooming in SAPAP3 KO-NpHR mice injected with saline (two-way RM ANOVA: interaction P = 0.0221, laser P = 0.0167, treatment P = 0.0612, subject P = 0.0037; Tukey’s multiple comparisons: saline KO-eYFP vs saline KO-NpHR P = 0.0147, ketamine KO-eYFP vs saline KO-NpHR P = 0.0003, ketamine KO-NpHR vs saline KO-NpHR P = 0.0086; saline KO-eYFP = 5, ketamine KO-eYFP = 6, saline KO-NpHR = 6, ketamine KO-NpHR  = 7). e Neither inhibition of dmPFC-DMS projections nor drug treatment affectgrooming frequency (two-way RM ANOVA: interaction P > 0.05, laser P > 0.05, treatment P > 0.05, subject P = 0.0004; saline KO-eYFP = 5, ketamine KO-eYFP = 6, saline KO-NpHR = 6, ketamine KO-NpHR = 7).
Fig. 8
Fig. 8. Increasing dmPFC-DMS projection neuron activity via ketamine or optogenetic stimulation rescues compulsive grooming behavior.
Graphical summary of the paper showing: a Ketamine produces a decrease in grooming behavior that is correlated with an increase in dmPFC-DMS projection neuron activity in SAPAP3 KO mice. This rescue of compulsive grooming behavior is causally reproduced by selectively stimulating dmPFC-DMS projection neurons. b Ketamine has no effect on grooming behavior or dmPFC-DMS circuit activity in WT mice, though optogenetic inhibition of dmPFC-DMS projections in WT mice was sufficient to induce increased grooming. c Ketamine blocks the increase in grooming behavior induced by optogenetic inhibition of dmPFC-DMS projection in KO mice.

Similar articles

Cited by

References

    1. Richter PMA, Ramos RT. Obsessive-compulsive disorder. Contin. (Minneap. Minn.) 2018;24:828–844. - PubMed
    1. Ruscio AM, Stein DJ, Chiu WT, Kessler RC. The epidemiology of obsessive-compulsive disorder in the National Comorbidity Survey Replication. Mol. Psychiatry. 2010;15:53–63. doi: 10.1038/mp.2008.94. - DOI - PMC - PubMed
    1. Koran LM, Hanna GL, Hollander E, Nestadt G, Simpson HB. Practice guideline for the treatment of patients with obsessive-compulsive disorder. Am. J. Psychiatry. 2007;164:5–53. - PubMed
    1. Pittenger C, Bloch MH. Pharmacological treatment of obsessive-compulsive disorder. Psychiatr. Clin. North Am. 2014;37:375–391. doi: 10.1016/j.psc.2014.05.006. - DOI - PMC - PubMed
    1. Dougherty DD, Rauch SL, Jenike MA. Pharmacotherapy for obsessive-compulsive disorder. J. Clin. Psychol. 2004;60:1195–1202. doi: 10.1002/jclp.20083. - DOI - PubMed

Publication types