Meta-Analysis
. 2021 Oct 15;12(1):6031.
doi: 10.1038/s41467-021-26174-2.

Genetic investigation of fibromuscular dysplasia identifies risk loci and shared genetics with common cardiovascular diseases

Collaborators, Affiliations
Meta-Analysis

Genetic investigation of fibromuscular dysplasia identifies risk loci and shared genetics with common cardiovascular diseases

Adrien Georges et al. Nat Commun. .

Erratum in

  • Author Correction: Genetic investigation of fibromuscular dysplasia identifies risk loci and shared genetics with common cardiovascular diseases.
    Georges A, Yang ML, Berrandou TE, Bakker MK, Dikilitas O, Kiando SR, Ma L, Satterfield BA, Sengupta S, Yu M, Deleuze JF, Dupré D, Hunker KL, Kyryachenko S, Liu L, Sayoud-Sadeg I, Amar L, Brummett CM, Coleman DM, d'Escamard V, de Leeuw P, Fendrikova-Mahlay N, Kadian-Dodov D, Li JZ, Lorthioir A, Pappaccogli M, Prejbisz A, Smigielski W, Stanley JC, Zawistowski M, Zhou X, Zöllner S; FEIRI investigators; International Stroke Genetics Consortium (ISGC) Intracranial Aneurysm Working Group; MEGASTROKE; Amouyel P, De Buyzere ML, Debette S, Dobrowolski P, Drygas W, Gornik HL, Olin JW, Piwonski J, Rietzschel ER, Ruigrok YM, Vikkula M, Warchol Celinska E, Januszewicz A, Kullo IJ, Azizi M; ARCADIA Investigators; Jeunemaitre X, Persu A, Kovacic JC, Ganesh SK, Bouatia-Naji N. Georges A, et al. Nat Commun. 2022 Apr 20;13(1):2251. doi: 10.1038/s41467-022-29921-1. Nat Commun. 2022. PMID: 35443759 Free PMC article. No abstract available.

Abstract

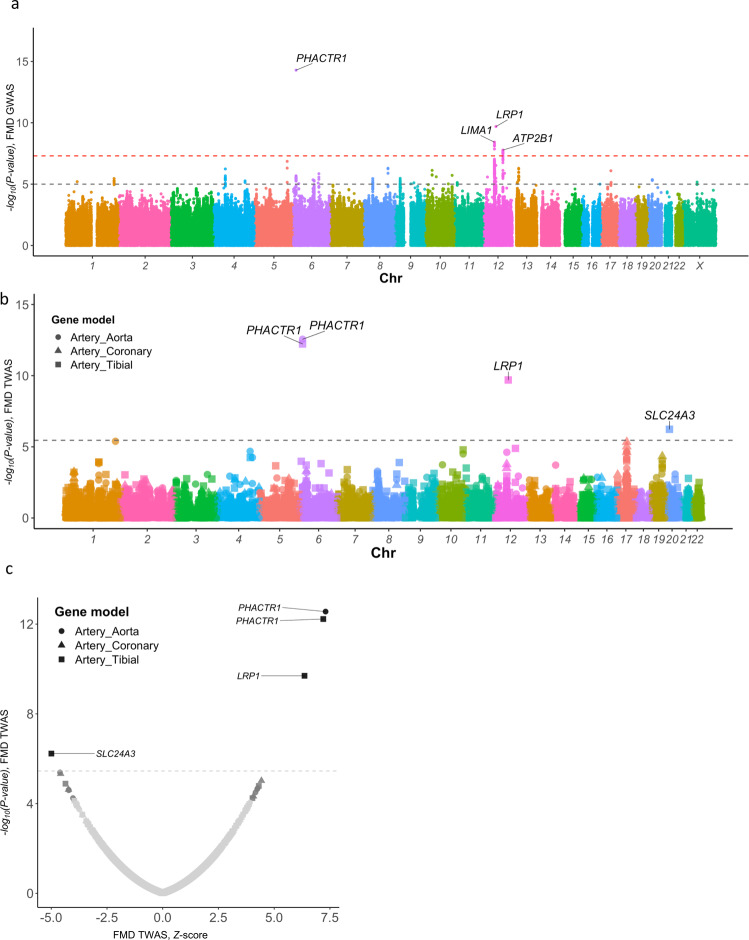
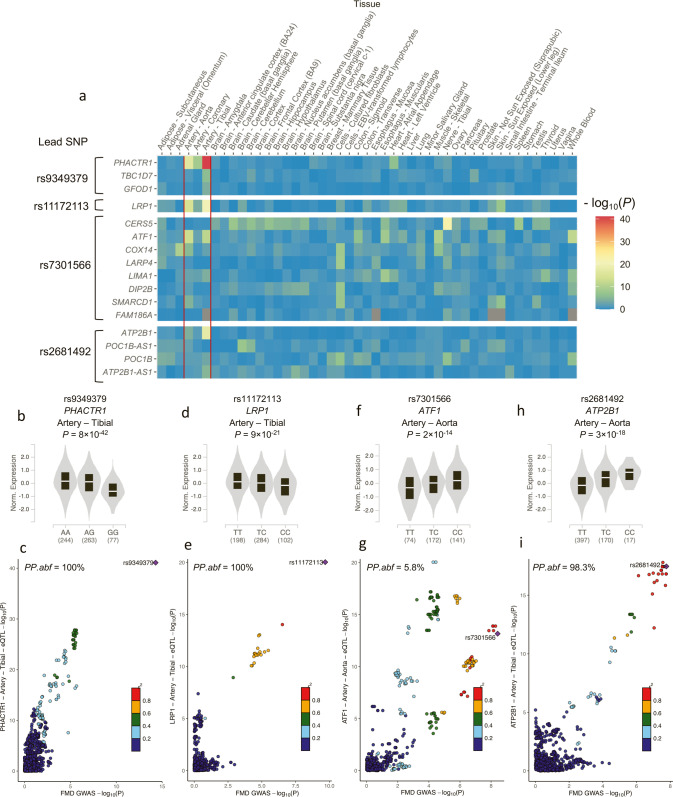
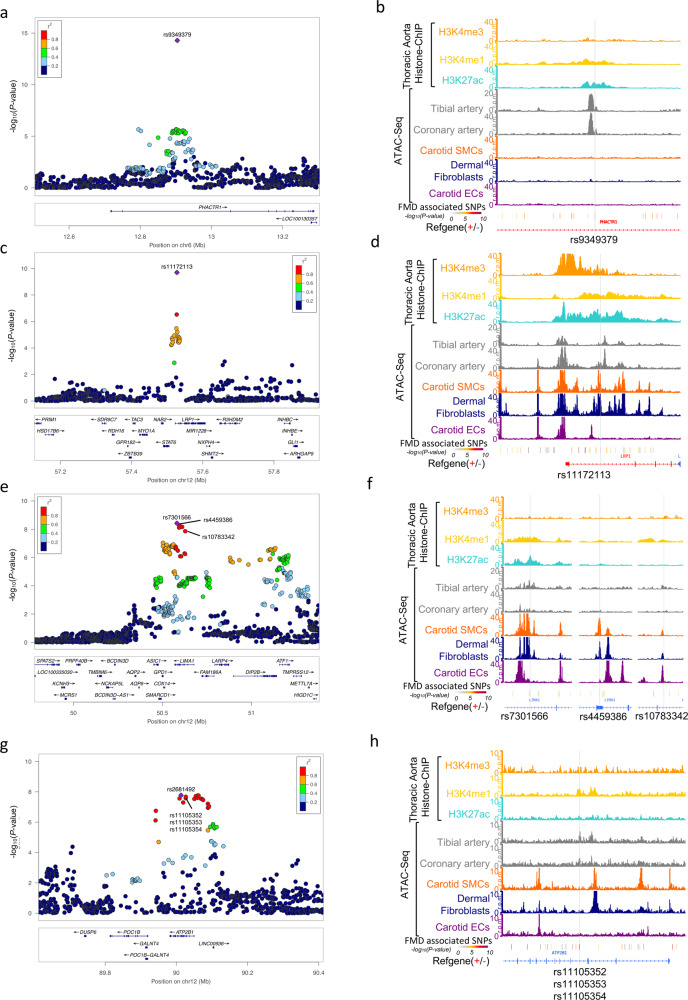
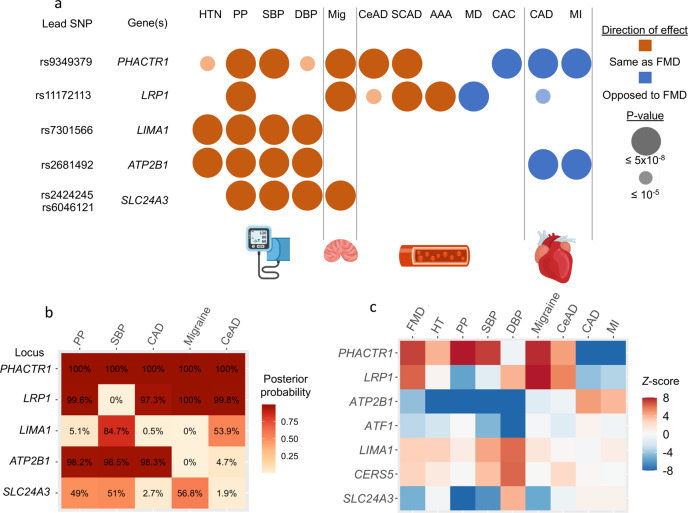
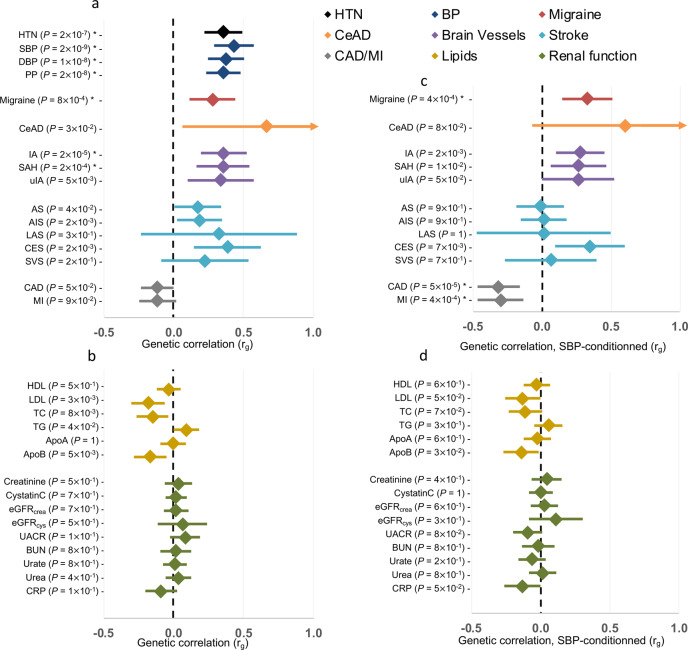
Fibromuscular dysplasia (FMD) is an arteriopathy associated with hypertension, stroke and myocardial infarction, affecting mostly women. We report results from the first genome-wide association meta-analysis of six studies including 1556 FMD cases and 7100 controls. We find an estimate of SNP-based heritability compatible with FMD having a polygenic basis, and report four robustly associated loci (PHACTR1, LRP1, ATP2B1, and LIMA1). Transcriptome-wide association analysis in arteries identifies one additional locus (SLC24A3). We characterize open chromatin in arterial primary cells and find that FMD associated variants are located in arterial-specific regulatory elements. Target genes are broadly involved in mechanisms related to actin cytoskeleton and intracellular calcium homeostasis, central to vascular contraction. We find significant genetic overlap between FMD and more common cardiovascular diseases and traits including blood pressure, migraine, intracranial aneurysm, and coronary artery disease.


Conflict of interest statement

H.L.G., S.K.G., J.O., and J.C.S. are non-compensated members of the Medical Advisory Board of the FMD Society of America (FMDSA). S.K.G. is a non-compensated member of the Scientific Advisory Board of SCAD Alliance. Both are non-profit organizations.

Figures

Fig. 1
Fig. 1. SNP-based and transcriptome-wide association analyses.
a Manhattan plot representation of SNP-based association analysis in FMD. −log10 of association P value (from a two-sided Wald test) is represented on the y-axis, genomic coordinates on the x-axis. Name of lead SNPs with P value ≤ 5  ×  10−8 are indicated. b Manhattan plot representation of Transcriptome-wide association analysis (TWAS) in FMD with tibial artery (square dots), aorta (round dots) and coronary artery (triangle dots) gene expression models. −log10 of association P value is represented on the y-axis, genomic coordinates on the x-axis. Name of genes with Bonferroni corrected P value ≤ 0.05 are indicated. c Volcano plot representation of FMD TWAS. TWAS Z-score is represented on the x-axis, −log10 of TWAS P value on the y-axis. The dashed line represents the threshold for significance adjusted for multiple testing. Name of genes with Bonferroni adjusted P value < 0.05 are indicated.
Fig. 2
Fig. 2. Tissue-wide eQTL signals near FMD loci.
a Heatmap representation of eQTL signals at FMD loci. GTEx v8 database was queried for significant eQTLs using the lead variant rsID number. All genes identified as positive eQTL in at least one tissue were selected to calculate eQTL associations in all tissues available in this database. The negative logarithms (−log10) of the eQTL association P values are represented in a blue–red colour scale. b, d, f, h Violin plots representing normalized expression of PHACTR1 (b), LRP1 (d), ATF1 (f) and ATP2B1 (h) by genotype of lead SNPs in tibial artery (b, d, h) and aortic tissue (f). Plots illustrate the best eQTL association in arterial tissue for the lead SNP at each locus. eQTL unadjusted P values were obtained from testing that the slope of linear regression model between genotype and expression deviates from 0 using a two-sided Wald test. FMD risk allele is on the left. c, e, g, i Colocalization plot of FMD association (x-axis, log scale of genetic association P value) with tibial artery (c, e, i) and aortic tissue (g) eQTL association (y-axis, log scale of P value) at each locus. Dot colour represents the LD r2 with the lead variant in 1000G European samples. FMD lead variant is highlighted (Diamond shape, purple). Approximate Bayes Factor Posterior Probability (PP.abf) for the two traits to share a common causal variant (H4 coefficient) is indicated.
Fig. 3
Fig. 3. Visualization of potential causal variants genes at FMD-associated loci.
a, c, e, g LocusZoom representation of FMD-associated loci (a PHACTR1 locus, c LRP1 locus, e LIMA1 locus, g ATP2B1 locus). Dot colour indicates LD of each variant with the highlighted lead variant (purple diamond). Position and rsID of putative causal variants are indicated. P value of genetic association is represented on the y-axis (negative log scale) (b, d, f, h) Genome browser visualization of ATAC-Seq/Histone-ChIP read densities (in reads/million, r.p.m.) in the regions surrounding putative causal variants. b PHACTR1 locus. d LRP1 locus. f LIMA1 locus. h ATP2B1 locus. Grey line highlights variant position.
Fig. 4
Fig. 4. Pairwise trait colocalization of FMD associations.
a Associations of FMD loci with other vascular diseases. Variants in LD (r2 > 0.5) with the lead SNP were used to query GWAS catalogue database (accessed on August 5th 2020), UK BioBank GWAS traits and specific meta-analysis of GWAS for CAD/MI, stroke, blood pressure and intracranial aneurysms. Two independent lead SNPs were retained for SLC24A3 locus. Overlaps are reported for the following traits/diseases: hypertension (HTN), pulse pressure (PP), systolic blood pressure (SBP), diastolic blood pressure (DBP), migraine (Mig), cervical artery dissection (CeAD), spontaneous coronary artery dissection (SCAD), abdominal aortic aneurysm (AAA), MoyaMoya disease (MD), coronary artery calcification (CAC), coronary artery disease (CAD) and myocardial infarction (MI). Large bubbles indicate association below genome-wide significance for the corresponding trait (P value of genetic association < 5  ×  10−8), smaller bubbles correspond to suggestive signals (P < 1  ×  10−5). Red colour indicates same direction effects of risk alleles compared to the association with FMD, blue colour opposite direction associations. b Heatmap representation of the approximate Bayes factor posterior probability of FMD and related traits to share a common causal variant at the indicated loci (coefficient H4 of the colocalization analysis, represented on a white-red colour scale). c Heatmap representation of TWAS Z-Score for FMD-associated genes. TWAS was performed with tibial artery gene expression models for the indicated traits or diseases (x-axis). Z-scores, represented on a blue-red colour scale, are shown for all FMD-associated genes in the gene-based and TWAS analyses (y-axis). Illustrations were designed by macrovector/Freepik.
Fig. 5
Fig. 5. Genetic correlations between FMD and other traits and diseases.
a Genetic correlation obtained using LD Score analyses between FMD and vascular diseases and traits. HTN hypertension, BP blood pressure, SBP systolic BP (dark blue), DBP diastolic BP, PP pulse pressure, CeAD cervical artery dissection, IA intracranial aneurysm, all forms, SAH aneurysmal subarachnoid haemorrhage, i.e., ruptured intracranial aneurysm, uIA unruptured intracranial aneurysm, AS any stroke, AIS any ischaemic stroke, LAS large artery stroke, CES cardioembolic stroke, SVS small vessel stroke, CAD coronary artery disease, MI myocardial infarction. b Genetic correlation obtained using LD Score analyses between FMD and vascular diseases and metabolic traits. HDL high-density lipoprotein, LDL low-density lipoprotein, TC total cholesterol, TG triglycerides, ApoA apolipoprotein A, ApoB apolipoprotein B, eGFR estimated glomerular filtration rate (calculated with creatinine or cystatin), UACR urine albumin to creatinine ratio, BUN blood urea nitrogen, CRP C-reactive protein. c, d Genetic correlation results after FMD genetic association statistics were conditioned on systolic blood pressure. *Unadjusted P value of genetic correlation estimated from linkage disequilibrium score regression using a two-sided Wald test is below the multiple testing threshold for significance (1.6  ×  10−3 for 31 tests).

Similar articles

Cited by

References

    1. World Health, O. World Health Statistics 2020: Monitoring Health for the SDGs, Sustainable Development Goals (World Health Organization, Geneva, 2020).
    1. Plouin PF, et al. Fibromuscular dysplasia. Orphanet J. Rare Dis. 2007;2:28. doi: 10.1186/1750-1172-2-28. - DOI - PMC - PubMed
    1. Kiando SR, et al. PHACTR1 is a genetic susceptibility locus for fibromuscular dysplasia supporting its complex genetic pattern of inheritance. PLoS Genet. 2016;12:e1006367. doi: 10.1371/journal.pgen.1006367. - DOI - PMC - PubMed
    1. Gornik HL, et al. First International Consensus on the diagnosis and management of fibromuscular dysplasia. Vasc. Med. 2019;24:164–189. doi: 10.1177/1358863X18821816. - DOI - PubMed
    1. Cordonnier C, et al. Stroke in women - from evidence to inequalities. Nat. Rev. Neurol. 2017;13:521–532. doi: 10.1038/nrneurol.2017.95. - DOI - PubMed

Publication types

MeSH terms

Substances