. 2021 Oct 15;12(1):6030.
doi: 10.1038/s41467-021-26330-8.

Three chromosome-scale Papaver genomes reveal punctuated patchwork evolution of the morphinan and noscapine biosynthesis pathway

Affiliations

Three chromosome-scale Papaver genomes reveal punctuated patchwork evolution of the morphinan and noscapine biosynthesis pathway

Xiaofei Yang et al. Nat Commun. .

Abstract

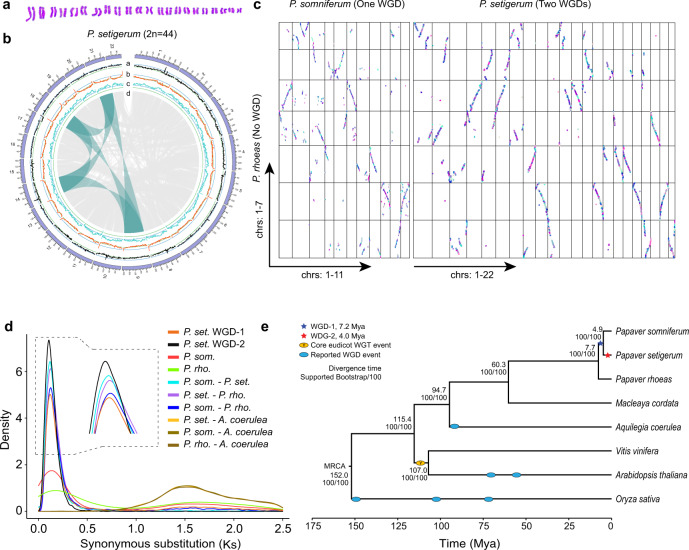
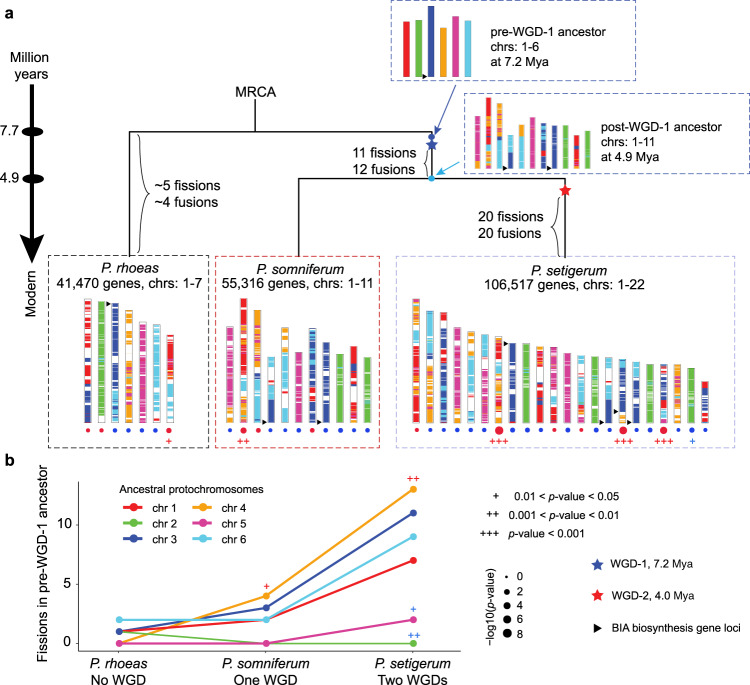
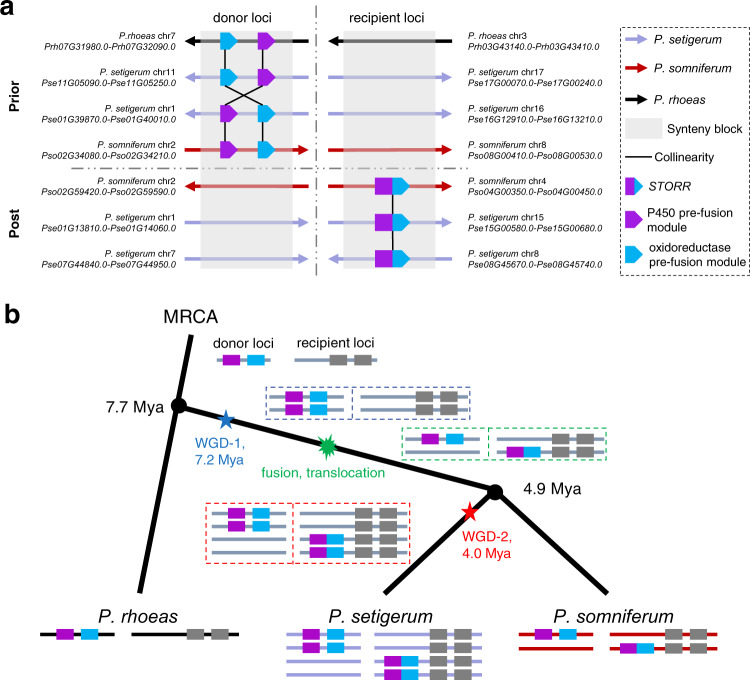
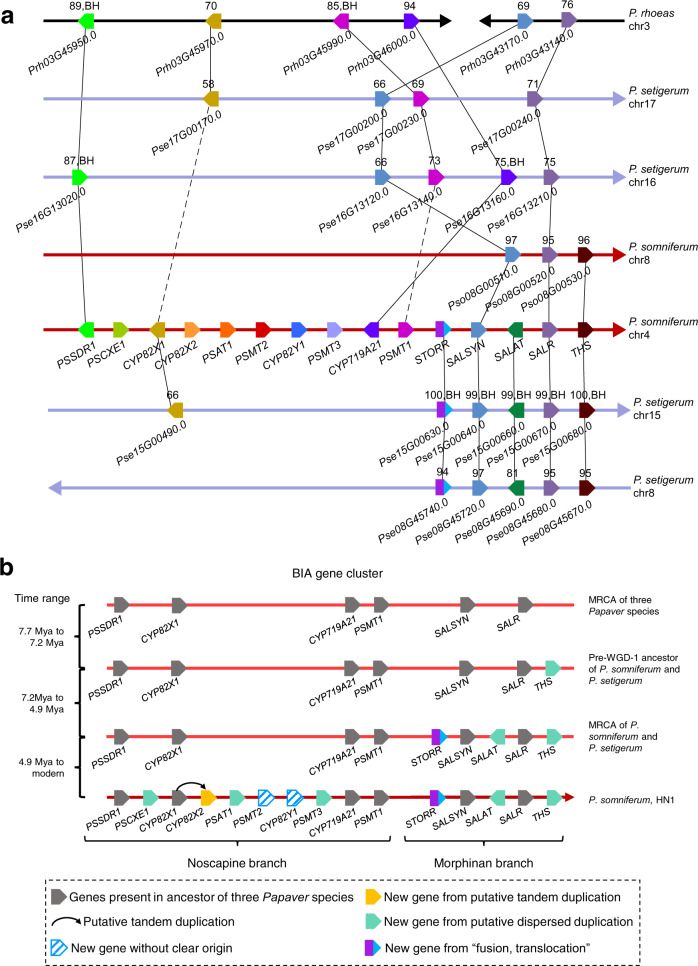
For millions of years, plants evolve plenty of structurally diverse secondary metabolites (SM) to support their sessile lifestyles through continuous biochemical pathway innovation. While new genes commonly drive the evolution of plant SM pathway, how a full biosynthetic pathway evolves remains poorly understood. The evolution of pathway involves recruiting new genes along the reaction cascade forwardly, backwardly, or in a patchwork manner. With three chromosome-scale Papaver genome assemblies, we here reveal whole-genome duplications (WGDs) apparently accelerate chromosomal rearrangements with a nonrandom distribution towards SM optimization. A burst of structural variants involving fusions, translocations and duplications within 7.7 million years have assembled nine genes into the benzylisoquinoline alkaloids gene cluster, following a punctuated patchwork model. Biosynthetic gene copies and their total expression matter to morphinan production. Our results demonstrate how new genes have been recruited from a WGD-induced repertoire of unregulated enzymes with promiscuous reactivities to innovate efficient metabolic pathways with spatiotemporal constraint.


Conflict of interest statement

The authors declare no competing interests.

Figures

Fig. 1
Fig. 1. Genome features of three Papaver species.
a Karyotyping shows P. setigerum is diploid (2n = 44). b Intraspecies synteny analysis reveals two rounds of whole-genome duplications (WGD) in P. setigerum genome. The tracks a, b, and c of the circos plot represent the distribution of gene density, repeat density, and GC density, respectively (calculated in 2 Mb windows). Track d shows genome-wide syntenic blocks detected by MCScanX where an example of duplications involving four chromosomes as a result of two WGDs was highlighted. Bandwidth is proportional to syntenic block size. c Dotplots of interspecies syntenic blocks reveal the 1:2:4 syntenic block ratio of P. rhoeas, P. somniferum, and P. setigerum. Each dot indicates a syntenic gene pair detected by MCScanX. Synteny blocks were colored by MCScanX. d Synonymous substitution rate (Ks) density distributions of syntenic paralogs and orthologs, with colored lines representing comparisons among four plant species: P. set. (P. setigerum), P. rho. (P. rhoeas), P. som. (P. somniferum) and A. coerulea (Aquilegia coerulea). For P. setigerum, only the reciprocal best matches among the syntenic gene pairs were considered as the pairs from WGD-2 while other syntenic gene pairs were grouped as the pairs from WGD-1. e Inferred maximum likelihood phylogenetic tree by RAxML. Divergence timings and the supported bootstrap values were labeled on the tree. Estimated WGD-1 and WGD-2 timings and the reported whole-genome triplication (WGT)/WGD timings were superimposed on the phylogenetic tree. MRCA most recent common ancestor, Mya million years ago. Source data underlying be are provided as a Source Data file.
Fig. 2
Fig. 2. Ancestral genomes and accelerated non-random post-WGD rearrangements.
a Both ancestral and modern genomes were illustrated with a six-color code corresponding to protochromosomes of pre-WGD-1 ancestor. Under each modern chromosome, red circles indicate enriched fusions, while blue circles indicate depletion of fusions. MRCA most recent common ancestor, WGD whole-genome duplication, Mya million years ago. b Number of fissions on each pre-WGD-1 ancestor protochromosomes to shape three modern genomes. The p-value of enrichment and depletion were marked as red and blue “+”, respectively, p-value is calculated by z-test. The p-values for protochromosome 4 are 0.034 and 0.005 in P. somniferum and in P. setigerum, respectively; the p-value for protochromosome 2 is 0.004 in P. setigerum; the p-value for protochromosome 5 is 0.02 in P. setigerum. Source data are provided as a Source Data file.
Fig. 3
Fig. 3. Evolutionary history of STORR.
a The collinearity of genes in the donor loci and the recipient loci showing both prior and post states of FT event in three Papaver species supporting the “fusion, translocation” (FT) event leading to STORR formation at BIA gene cluster. The directions of arrows indicated the chromosome from 5′ to 3′. The dash lines indicate the boundary between donor loci and recipient loci, and the boundary between prior states and post states. The detailed diagram with the genomic context was shown in Supplementary Fig. 25. b A proposed evolutionary model for the birth of STORR at BIA gene cluster raised from a series of whole-genome duplications (WGD), “fusion, translocation” events. Purple and blue colors denote the cytochrome P450 and oxidoreductase modules. MRCA most recent common ancestor, WGD whole-genome duplication, Mya million years ago. Source data underlying a are provided as a Source Data file.
Fig. 4
Fig. 4. Evolutionary history of benzylisoquinoline alkaloid (BIA) gene cluster.
a The syntenic relations at BIA gene cluster in three Papaver species. Solid lines denote the syntenic relations detected by MCScanX, and the dash lines denote the top BlastP hits. Different colors denote different genes. The gene name or ID is labeled for each gene. The numbers above the genes represent sequence identity levels from BlastP. The directions of arrows indicate the chromosome from 5′ to 3′. BH best hit. b Summary of BIA gene cluster evolution. Putative tandem duplication as a structural variation event producing identical adjacent segments while the other non-locally duplicated ones are “putative dispersed duplication”. MRCA most recent common ancestor, WGD whole-genome duplication, Mya million years ago. Source data underlying a are provided as a Source Data file.
Fig. 5
Fig. 5. Clustered BIA genes are co-regulated and evolved in a coordinated manner.
a The heatmap of the average normalized expression level of genes at the donor and the recipient loci related with STORR in six tissues of three Papaver species. Details of the gene expressions related to BIA genes were shown in Supplementary Fig. 38. b Hi-C interaction heatmap of regions including two copies of morphinan gene cluster on chr15 (top) and chr8 (down) of P. setigerum, shown at a resolution of 10 kb. The morphinan branch gene regions are marked with colored boxes. c The comparison of the interactions between two morphinan gene copies in P. setigerum. The p-value is calculated by a two-sided Wilcoxon rank-sum test. For the boxplot, the centerline, median; box limits, upper and lower quartiles; whiskers, data range. n is the number of bins. d Dotplots of STORR, SALSYN, SALAT, SALR, and THS promoter sequences between P. somniferum (one copy) and P. setigerum (two copies). Promoter is defined as 2 kb upstream region of the transcription start site. Source data are provided as a Source Data file.
Fig. 6
Fig. 6. Copy number and expression of genes on morphinan biosynthetic pathway.
Correlation of morphinan production with copy number and expression of morphinan biosynthesis genes in three Papaver species. Copy numbers of morphinan biosynthesis pathway genes were shown in a line plot on left. Production levels of thebaine, codeine, and morphine were shown in bubble plots, and the detail numbers were shown in Supplementary Fig. 2. The total expression of all gene copies in the stem was shown in a line plot on right. N_exp normalized expression. Source data are provided as a Source Data file.

Comment in

Similar articles

Cited by

References

    1. Field B, Osbourn AE. Metabolic diversification-independent assembly of operon-like gene clusters in different plants. Science. 2008;320:543–547. doi: 10.1126/science.1154990. - DOI - PubMed
    1. Winzer T, et al. A Papaver somniferum 10-gene cluster for synthesis of the anticancer alkaloid noscapine. Science. 2012;336:1704–1708. doi: 10.1126/science.1220757. - DOI - PubMed
    1. Itkin M, et al. Biosynthesis of antinutritional alkaloids in solanaceous crops is mediated by clustered genes. Science. 2013;341:175–179. doi: 10.1126/science.1240230. - DOI - PubMed
    1. Wilderman PR, Xu M, Jin Y, Coates RM, Peters RJ. Identification of syn-pimara-7,15-diene synthase reveals functional clustering of terpene synthases involved in rice phytoalexin/allelochemical biosynthesis. Plant Physiol. 2004;135:2098–2105. doi: 10.1104/pp.104.045971. - DOI - PMC - PubMed
    1. Jonczyk R, et al. Elucidation of the final reactions of DIMBOA-glucoside biosynthesis in maize: characterization of Bx6 and Bx7. Plant Physiol. 2008;146:1053–1063. doi: 10.1104/pp.107.111237. - DOI - PMC - PubMed

Publication types