. 2021 Oct 15;12(1):6021.
doi: 10.1038/s41467-021-26310-y.

A metabolome atlas of the aging mouse brain

Affiliations

A metabolome atlas of the aging mouse brain

Jun Ding et al. Nat Commun. .

Abstract

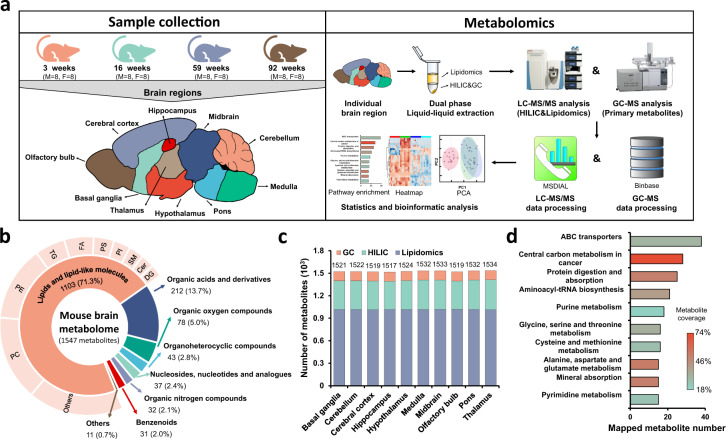
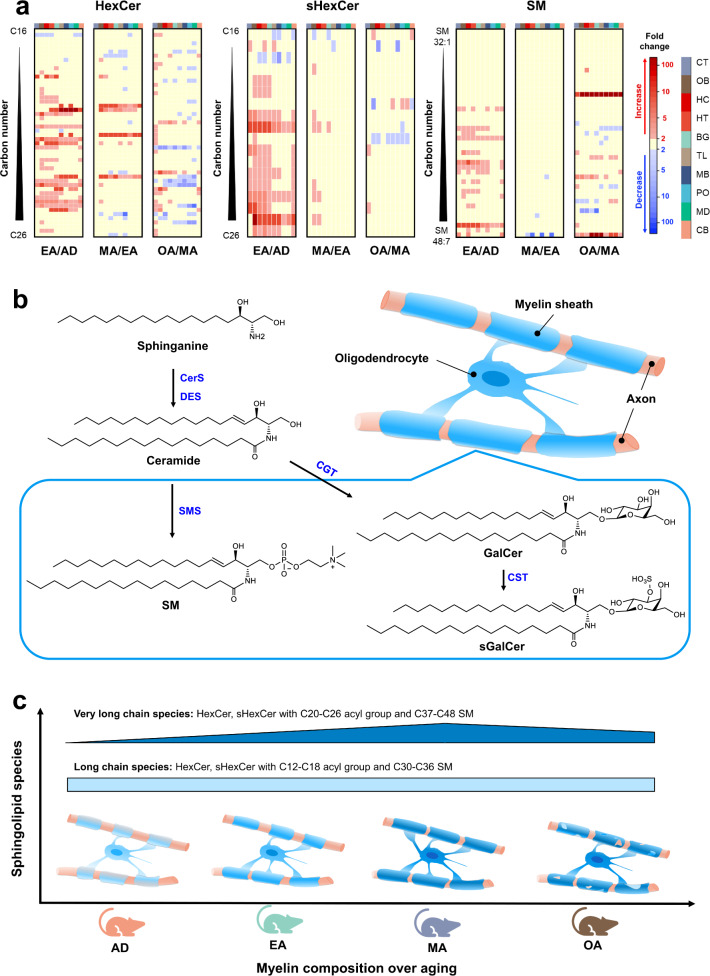
The mammalian brain relies on neurochemistry to fulfill its functions. Yet, the complexity of the brain metabolome and its changes during diseases or aging remain poorly understood. Here, we generate a metabolome atlas of the aging wildtype mouse brain from 10 anatomical regions spanning from adolescence to old age. We combine data from three assays and structurally annotate 1,547 metabolites. Almost all metabolites significantly differ between brain regions or age groups, but not by sex. A shift in sphingolipid patterns during aging related to myelin remodeling is accompanied by large changes in other metabolic pathways. Functionally related brain regions (brain stem, cerebrum and cerebellum) are also metabolically similar. In cerebrum, metabolic correlations markedly weaken between adolescence and adulthood, whereas at old age, cross-region correlation patterns reflect decreased brain segregation. We show that metabolic changes can be mapped to existing gene and protein brain atlases. The brain metabolome atlas is publicly available ( https://mouse.atlas.metabolomics.us/ ) and serves as a foundation dataset for future metabolomic studies.


Conflict of interest statement

The authors declare no competing interests.

Figures

Fig. 1
Fig. 1. Overview of the mouse brain atlas dataset.
a Graphic illustration of the workflow to acquire aging mouse brain metabolome data. b Chemical composition of the mouse brain metabolome using ClassyFire categories to classify the metabolite diversity of all annotated metabolites across assays. c Number of annotated metabolites by metabolome assay and brain regions. d Mapping polar metabolites assayed by HILIC- and GC–MS to pathways. Top-10 mapped pathway-based sets shown from a total of 118 pathways covered by Consensus PathDB.
Fig. 2
Fig. 2. Data quality assessment of the mouse brain metabolome.
a Principal component analysis (PCA) of 640 mouse brain metabolome samples and corresponding Quality Control samples (QC, labeled red). QC samples are highly clustered, demonstrating low technical variance and high reliability of metabolomic analyses. b Quality control analysis by Spearman rank analysis testing the hypothesis that metabolic correlations within brain regions should be larger than correlations across brain regions. 276 scatter plots from biological replicates of three brain regions confirm this biological quality trait. Each scatter plot correlates peak intensities of all annotated metabolites in one sample against those in another sample. Output Spearman rank correlation coefficients are given in the top-right heat map.
Fig. 3
Fig. 3. Regional biochemical differences of the mouse brain.
a Principal component analysis (PCA) of all mouse brain metabolome samples. PCA vector 1 separates samples into different brain regions. Samples are colored by brain regions. b Principal component analysis (PCA) focused on early adult mice for all 10 brain regions. PCA vector 1 scparates cerebrum and brainstem, vector 2 distinguishes the cerebellum from cerebrum and brainstem samples. Samples are colored by brain regions. c Heatmap matrix of pairwise Spearman correlations between brain regions in early adults. Strong correlations are given in red, strong negative correlations in blue. Overall correlation structures distinguish the three main brain divisions cerebrum, brainstem, and cerebellum. d Heatmap of metabolites differentially expressed across the different brain regions, constrained to metabolites with >2-fold changes. Metabolites are categorized by ClassyFire. From left to right: Benzenoids: red, Lipids: orange, Nucleosides: light green, Acids: dark blue, Nitrogen organics: purple, Oxygen organics: dark green, Heterocyclics: light blue, Others: dark gray. e Co-localization maps of dopamine metabolites and in situ hybridization of dopamine receptors. Drd1 and Drd2 in situ hybridization images are taken from the 2004 Allen Institute for Brain Science (http://mouse.brain-map.org). Image credit: Allen Institute. f Co-localization maps of adenosine metabolites and in situ hybridization of adenosine receptors Adora2a and cAMP hydrolase PED10. The Adora2a and PED10 in situ hybridization images are taken from the 2004 Allen Institute for Brain Science (http://mouse.brain-map.org). Image credit: Allen Institute. g Co-localization maps of guanine and in situ hybridization of the guanine nucleotide dissociation inhibitor Pcp2. The Pcp2 in situ hybridization image is taken from the 2004 Allen Institute for Brain Science (http://mouse.brain-map.org). Image credit: Allen Institute.
Fig. 4
Fig. 4. Impact of aging on the mouse brain metabolome.
a Correlation matrices for brain regions of 16 mice from adolescent (AD), early adult (EA), middle-age (MA) to old age (OA) groups across brain divisions (brainstem, cerebrum, cerebellum) and 10 brain regions. Positive correlations, red, negative correlations, blue. b Multivariate analysis of mouse brain metabolomes by principal component analysis. PCA vector 2 separates samples into different ages. Samples are colored by age groups. c Correlation heatmaps for individual brain regions reveal different developmental patterns during aging. d Heatmap of metabolites with >2-fold changes between age groups. Metabolites are categorized by ClassyFire. From left to right: Benzenoids: red, Lipids: orange, Nucleosides: light green, Acids: dark blue, Nitrogen organics: purple, Oxygen organics: dark green, Heterocyclics: light blue, Others: dark gray. e Visualization of brain maps and bar plots across age groups when querying three selected metabolites at mouse.atlas.metabolomics.us. n = 16 biologically independent samples. Data are presented as mean values ± SEM.
Fig. 5
Fig. 5. Dynamics of sphingolipids in the aging mouse brain.
a Heatmaps with fold-changes for HexCer, sHexCer, and SM sphingolipids in brain regions between early adult versus adolescent, middle-age versus early adult, and old age versus middle age. b Pathways of HexCer, sHexCer, and SM biosynthesis. HexCer, sHexCer, and SM are highly enriched in oligodendrocyte or myelin. c Simplified scheme summarizing myelin sphingolipid changes during brain aging. Very-long-chain sphingolipids increasing from adolescent to middle-aged brains with a subsequent decrease from towards old age. Long-chain sphingolipids almost keep constant levels across all age groups.

References

    1. Oh SW, et al. A mesoscale connectome of the mouse brain. Nature. 2014;508:207–214. doi: 10.1038/nature13186. - DOI - PMC - PubMed
    1. Rubinov M, Ypma RJF, Watson C, Bullmore ET. Wiring cost and topological participation of the mouse brain connectome. Proc. Natl Acad. Sci. USA. 2015;112:10032–10037. doi: 10.1073/pnas.1420315112. - DOI - PMC - PubMed
    1. Fürth D, et al. An interactive framework for whole-brain maps at cellular resolution. Nat. Neurosci. 2018;21:139–149. doi: 10.1038/s41593-017-0027-7. - DOI - PMC - PubMed
    1. Cizeron, M. et al. A brain-wide atlas of synapses across the mouse lifespan. Science369, 270–275 (2020). - PMC - PubMed
    1. Lein ES, et al. Genome-wide atlas of gene expression in the adult mouse brain. Nature. 2007;445:168–176. doi: 10.1038/nature05453. - DOI - PubMed

Publication types