. 2021 Oct 15;8(1):270.
doi: 10.1038/s41597-021-01054-y.

Systematic phenotyping and characterization of the 5xFAD mouse model of Alzheimer's disease

Affiliations

Systematic phenotyping and characterization of the 5xFAD mouse model of Alzheimer's disease

Stefania Forner et al. Sci Data. .

Abstract

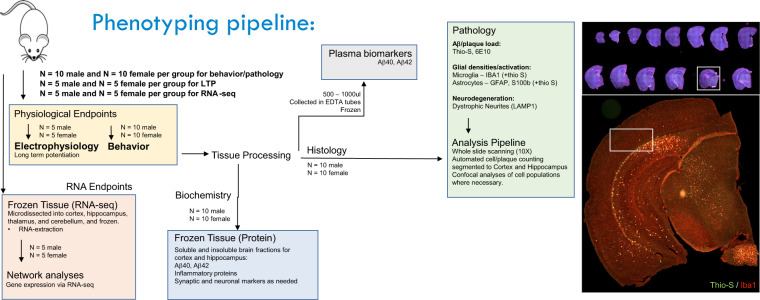
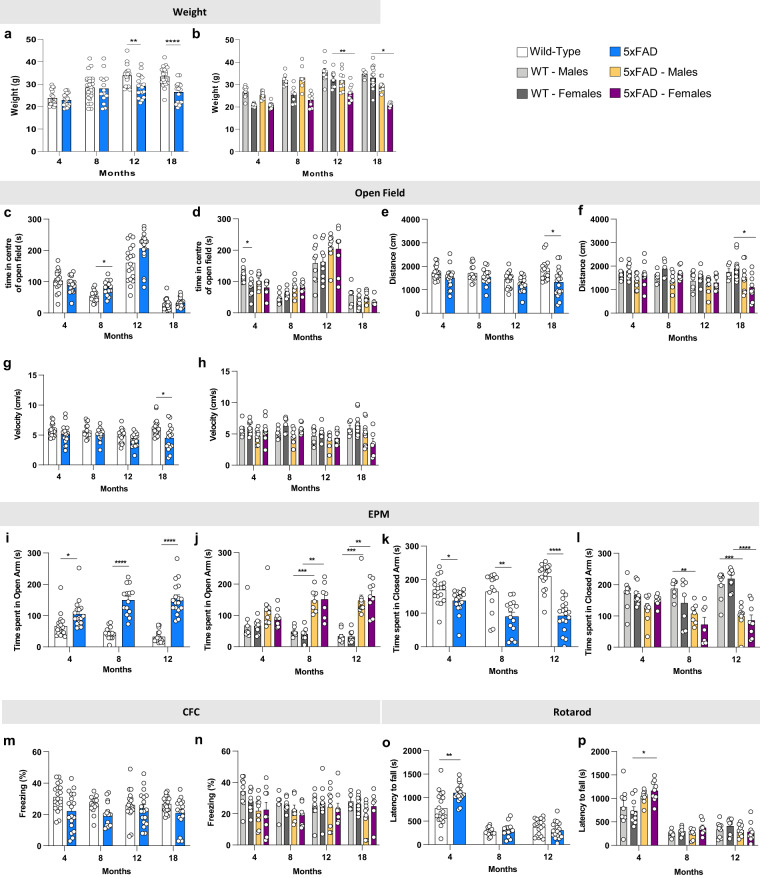
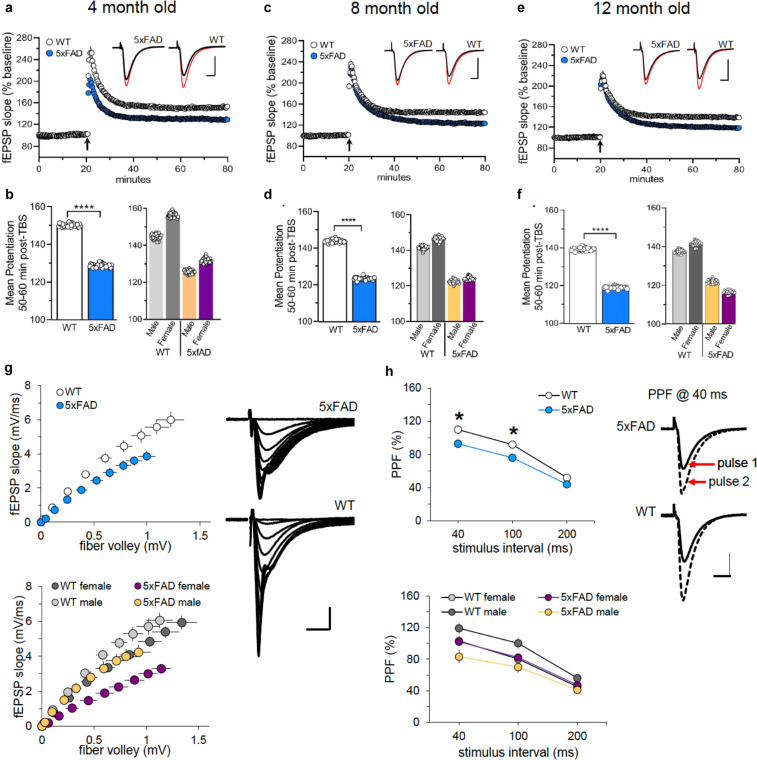
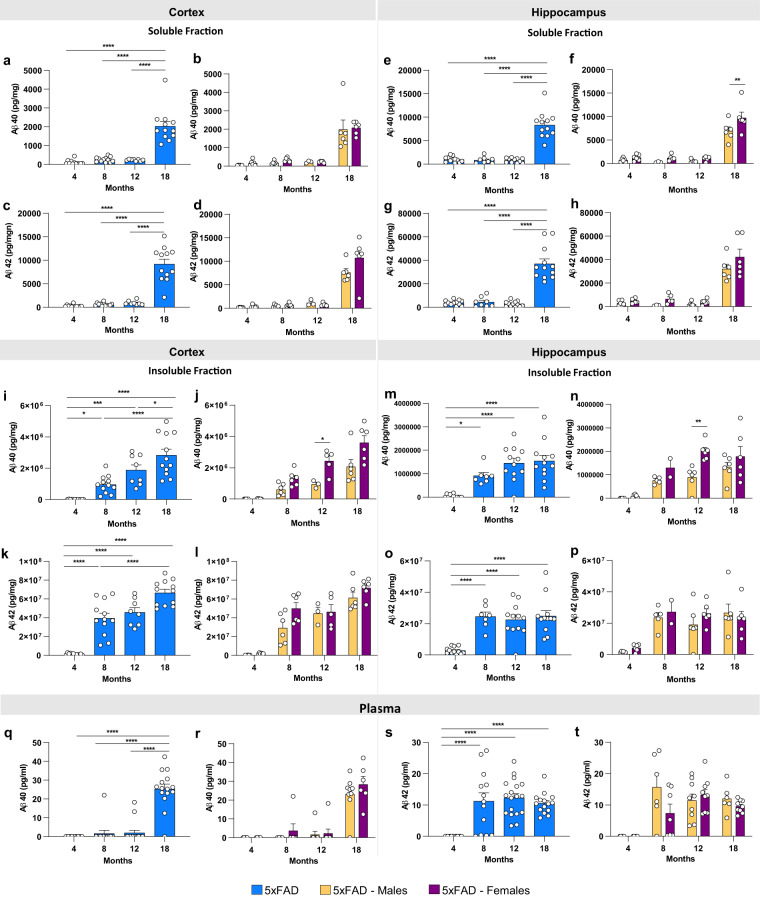
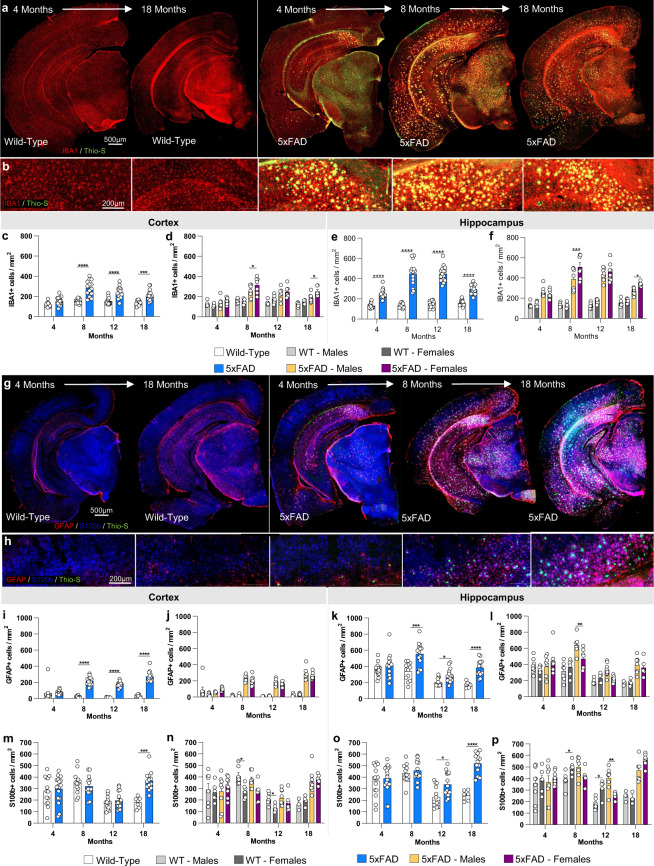
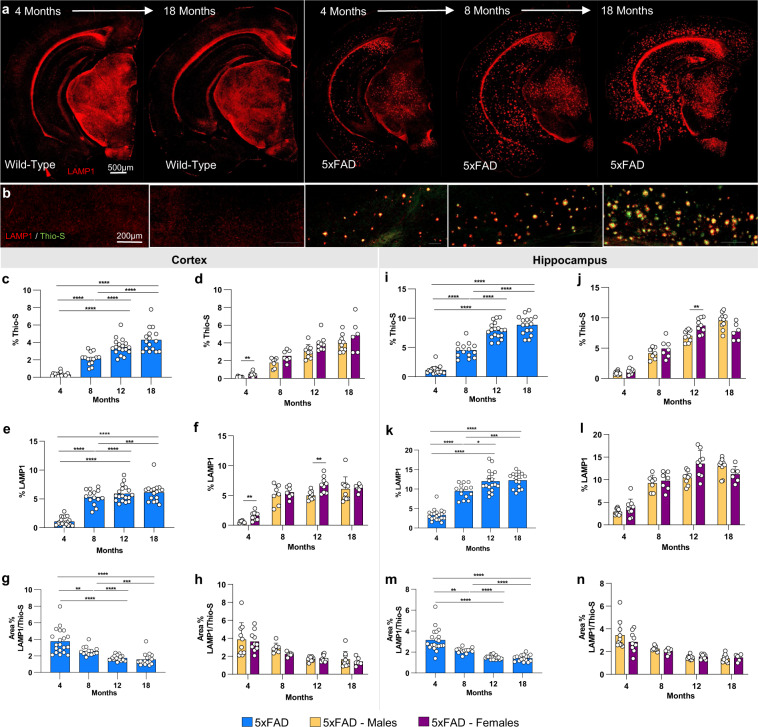
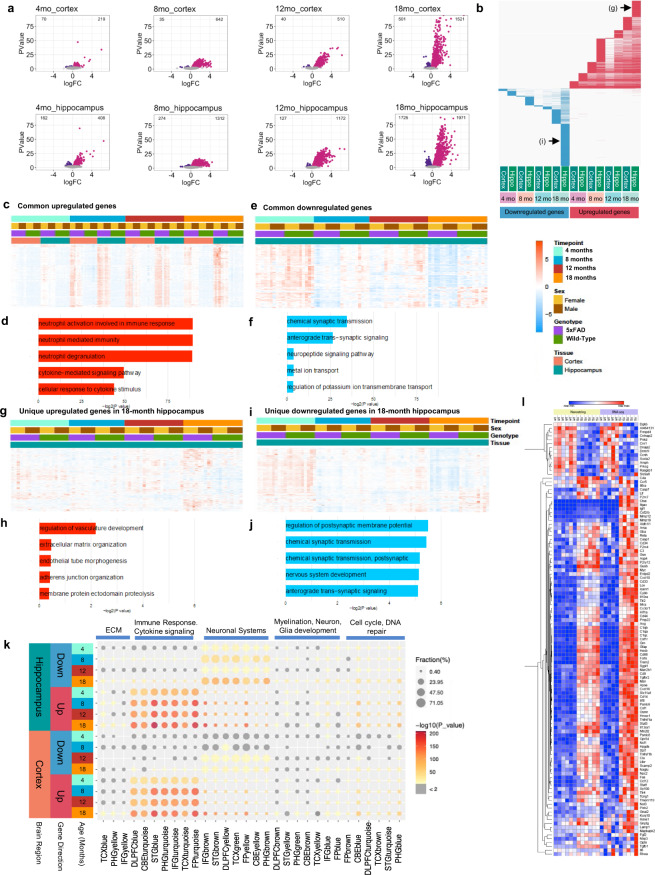
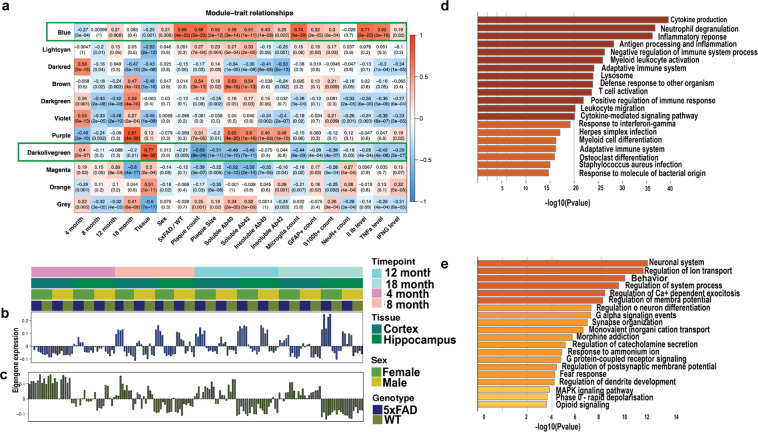
Mouse models of human diseases are invaluable tools for studying pathogenic mechanisms and testing interventions and therapeutics. For disorders such as Alzheimer's disease in which numerous models are being generated, a challenging first step is to identify the most appropriate model and age to effectively evaluate new therapeutic approaches. Here we conducted a detailed phenotypic characterization of the 5xFAD model on a congenic C57BL/6 J strain background, across its lifespan - including a seldomly analyzed 18-month old time point to provide temporally correlated phenotyping of this model and a template for characterization of new models of LOAD as they are generated. This comprehensive analysis included quantification of plaque burden, Aβ biochemical levels, and neuropathology, neurophysiological measurements and behavioral and cognitive assessments, and evaluation of microglia, astrocytes, and neurons. Analysis of transcriptional changes was conducted using bulk-tissue generated RNA-seq data from microdissected cortices and hippocampi as a function of aging, which can be explored at the MODEL-AD Explorer and AD Knowledge Portal. This deep-phenotyping pipeline identified novel aspects of age-related pathology in the 5xFAD model.


Conflict of interest statement

The authors declare no competing interests.

Figures

Fig. 1
Fig. 1
Phenotyping pipeline of the 5xFAD mouse model. The process order by which the animals and sample tissue go through within the MODEL-AD phenotyping pipeline at UCI, including behavior, LTP, RNA-seq, histology and biochemical assays.
Fig. 2
Fig. 2
Behavioral tasks reveal age-related changes in both WT and 5xFAD mice. (a,b) 5xFAD at 12- and 18- month of age show less weight gain than their littermate WT; this effect is higher on females. (ch) The open field test reveals deficits in distance traveled and velocity at 18 months 5xFAD (e and g, respectively). (i–l) 4, 8 and 12-month old 5xFAD mice spend more time in the open arms and less time in the closed arms of the elevated plus maze. (m,n) There is no effect of either age nor genotype on the contextual fear conditioning. (o,p) On the rotarod, 4-month-old 5xFAD time of latency is higher than WT, the effect being more on females. Data are represented as mean ± SEM. *P ≤ 0.05, **P ≤ 0.01, ***P ≤ 0.001, ****P ≤ 0.0001, n = 9–10 per group.
Fig. 3
Fig. 3
5xFAD mice show LTP impairments. Theta burst-induced LTP is impaired in 5xFAD mouse model. Hippocampal slices were prepared from 4, 8, and 12-month-old male and female WT and 5xFAD mice. (a) Time course for theta-burst induced (black arrow) LTP shows that the level of potentiation is notably reduced in slices from 4-month-old 5xFAD mice relative to slices from WT controls. Insets show field synaptic responses collected during baseline (black line) and 1 hour after theta burst stimulation (red line). Scale: 1 mV/5 ms. (b) Left bar graph, Group summary of mean potentiation ( ± SEM) during the last 10 min of recording in slices from 4 months WT and 5xFAD mice (F1,35 = 35.8, p < 0.0001). Right bar graph, Mean potentiation in slices from 4 months male and female WT and 5xFAD (male, F1,17 = 19.9, p = 0.003; female, F1,16 = 23.0, p = 0.0002). (c) Time course for theta-burst induced LTP shows that the level of potentiation is reduced in slices from 8 months old 5xFAD mice relative to WT controls. Insets show field synaptic responses collected during baseline (black line) and 1 hour after theta burst stimulation (red line). Scale: 1 mV/ 5 ms. (d) Left bar graph, Group summary of mean potentiation collected during the last 10 min of recording in slices from 8 months WT and 5xFAD mice (F1,38 = 64.2, p < 0.0001). Right bar graph, Mean potentiation in slices from 8 months male and female WT and 5xFAD (males, F1,19 = 31.6, p < 0.0001; females, F1,17 = 32.8, p < 0.0001). (e) Time course for theta-burst induced LTP again shows that the level of potentiation is markedly lower in slices from 12 month old 5xFAD mice relative to WT controls. Insets show field synaptic responses collected during baseline (black line) and 1 hour after theta burst stimulation (red line). Scale: 1 mV/ 5 ms. (f) Left bar graph, Group summary of mean potentiation during the last 10 min of recording in slices from 12 months WT and 5xFAD mice (F1,36 = 64.4, p < 0.0001). Right bar graph, Mean potentiation in slices from 12 months male and female WT and 5xFAD (male, F1,17 = 16.7, p = 0.0008; female, F1,17 = 59.3, p < 0.0001). (g) The input/output curve measuring the amplitude of the fiber volley relative to the fEPSP slope at 12 months was significantly different between WT and 5xFAD group (top panel, F 1,36 = 22.8, p < 0.0001), and gender (bottom panel, male, F 1,17 = 4.5, p = 0.049; female, F 1,17 = 34.4, p < 0.0001). Field traces on the right show representative synaptic responses collected during generation of an input/output curve in a slice from a 12-month-old WT and 5xFAD mouse. Scale: 1 mV/ 5 ms. (h) Paired-pulse facilitation was measured at 40, 100, and 200 ms intervals. Top panel, At 12 months of age, PPF is significantly reduced in slices from 5xFAD mice with respect to age-matched WT controls (F 1,36 = 5.8, p = 0.02). Bottom panel. This effect is due to the notable separation in PPF at 40 and 100 ms stimulus intervals between male 5xFAD and WT controls (males, F 1,17 = 9.6, p = 0.006; females, F 1,17 = 0.03, p = 0.86). Field traces on the right represent a pair of evoked responses at 40 ms collected in a slice from a 12 months male 5xFAD and WT mouse. Scale: 1 mV/ 5 ms.
Fig. 4
Fig. 4. Fibrillar amyloid plaques increase in size and number in 5xFAD aged mice.
5xFAD plaque burden was assessed with Thio-S staining at each time point. (a,b) Representative stitched brain hemispheres of 5xFAD shown with Thio-S staining at the 4- and 18-month and 4, 8, and 18 mo timepoints respectively, counter stained for NeuN. (b) Representative stitched whole brain hemispheres of 5xFAD (rostral to caudal) shown with Thio-S staining at the 4 month timepoint. (c) Representative images of plaques in 5xFAD mice across timepoints displaying a “halo” effect at 12 and 18 months. (dg) Quantification for number of Thio-S positive plaques in the cortex and hippocampus by genotype and sex. (hk) Quantification of average plaque area in the cortex and hippocampus by genotype and sex. Data are represented as mean ± SEM. *P ≤ 0.05, **P ≤ 0.01, ***P ≤ 0.001, ****P ≤ 0.0001, n = 6 per sex per age.
Fig. 5
Fig. 5
Protein differences observed with age and in 5xFAD mice. Levels of Aβ were quantified in microdissected hippocampi and cortices via Mesoscale Multiplex technology. (ah) Levels of Aβ40 and Aβ42 were measured in the soluble fraction of cortex and hippocampus, respectively, with age-related increases in the level of Aβ40 and Aβ42 shown in cortex and hippocampus of 5xFAD mice. (ip) Increases in levels of insoluble Aβ40 and Aβ42 were seen in cortex and hippocampus with age. (qt) Increases of plasma levels of Aβ40 at 18 months of age 5xFAD and Aβ42 at 8-, 12- and 18- month old 5xFAD. Data are represented as mean ± SEM. *P ≤ 0.05, **P ≤ 0.01, ***P ≤ 0.001, ****P ≤ 0.0001, n = 6 per group.
Fig. 6
Fig. 6
Immunostaining of microglia and astrocytes. Brains of mice at each timepoint were sliced and immunostained for IBA1, GFAP and S100ß to reveal any changes in microglial, astrocytic. (a,b) Representative stitched brain hemispheres of WT and 5xFAD shown with IBA1/Thio-S staining at the 4- and 18-month and 4, 8, and 18 months timepoints, respectively. (cf) IBA1 immunostaining for microglia reveals both age-related changes in WT and 5xFAD microglial number, and differences between genotypes in cortex and hippocampus. (g,h) Representative stitched brain hemispheres of WT and 5xFAD shown with GFAP/ S100ß/Thio-S staining at the 4- and 18-month and 4, 8, and 18 months timepoints, respectively. (ip) Astrocyte number is assessed via GFAP (i-l)) and S100ß staining (mp) in the cortex and hippocampus. Data are represented as mean ± SEM. *P ≤ 0.05, **P ≤ 0.01, ***P ≤ 0.001, ****P ≤ 0.0001, n = 6 per group.
Fig. 7
Fig. 7
Immunostaining of lysosomes. (a,b) Representative stitched brain hemispheres of WT and 5xFAD shown with LAMP1/Thio-S staining at 4 and 18 months, and 4-, 8- and 18-months timepoints, respectively. (c,d,i,j) Quantification of Thio-S in cortex and hippocampus. (e,f,k,l) LAMP1 immunostaining for lysosomes reveals age-related changes of 5xFAD mice in percent area of the cortex and hippocampus covered by LAMP1. (g,h). In quantifying the ratio of LAMP1/Thio-S coverage, there was an age-related decrease, but no sex-related changes in the cortex. (m,n) A ratio of the percent area coverages of LAMP1 and Thio-S reveals age-related changes in the hippocampus of 5xFAD mice and no sex-related changes.
Fig. 8
Fig. 8
Differential gene expression analysis of the 5xFAD time course. (a) Comparisons of 5xFAD and WT were done across different timepoints and tissues. Upregulated genes are labeled in pink and down regulated genes are labeled in purple. Number of differential expressed genes is displayed in the upper corners of the volcano plot. Parameters FDR <0.05. (b) Comparison of differential expressed genes across timepoint and tissue. Upregulated genes in red, downregulated genes in blue. Each column represents a set of genes for a different time point, each row represents each one of the differentially expressed genes. Unique upregulated and downregulated gene sets representing in Fig. 7g,i are also indicated as (g) and (i) in this panel. (c,d) Heatmap and GO Term analysis for common genes upregulated. (e,f) Common downregulated genes, (g,h) Unique genes upregulated at 18 months in hippocampus, (i,j) Unique genes downregulated at 18 months in hippocampus. (k) Comparison of differentially expressed genes against AMP-AD modules. Size of the dot represents the fraction and color represents how much this fraction is significant. (l) NanoString nCounter Neuropathology Mouse Panel and RNA-seq heatmap comparison between 12-month-old female 5xFAD and WT hippocampus. Blue indicates down regulation and red indicates upregulation. Parameters FDR < 0.1.
Fig. 9
Fig. 9
Gene expression during progression of the 5xFAD phenotype. (a) Matrix with the Module-Trait Relationships (MTRs) and corresponding p-values between the detected modules on the y-axis and selected AD traits on the x-axis. The MTRs are colored based on their correlation: red is a strong positive correlation, while blue is a strong negative correlation. (b) Bar plots for the eigengene expression and heatmap of the genes in the blue module. (c) Bar plots for the eigen expression of the genes in the dark olive-green module. (d) and (e) Gene ontology analysis for genes of the blue and dark olive-green module respectively.

References

    1. King A. The search for better animal models of Alzheimer’s disease. Nature. 2018;559:S13–S15. doi: 10.1038/d41586-018-05722-9. - DOI - PubMed
    1. Drummond E, Wisniewski T. Alzheimer’s disease: experimental models and reality. Acta Neuropathol. 2017;133:155–175. doi: 10.1007/s00401-016-1662-x. - DOI - PMC - PubMed
    1. LaFerla, F. M. & Green, K. N. Animal models of Alzheimer disease. Cold Spring Harb Perspect Med210.1101/cshperspect.a006320 (2012). - PMC - PubMed
    1. Oakley H, et al. Intraneuronal beta-amyloid aggregates, neurodegeneration, and neuron loss in transgenic mice with five familial Alzheimer’s disease mutations: potential factors in amyloid plaque formation. J Neurosci. 2006;26:10129–10140. doi: 10.1523/JNEUROSCI.1202-06.2006. - DOI - PMC - PubMed
    1. Moechars D, Lorent K, De Strooper B, Dewachter I, Van Leuven F. Expression in brain of amyloid precursor protein mutated in the alpha-secretase site causes disturbed behavior, neuronal degeneration and premature death in transgenic mice. EMBO J. 1996;15:1265–1274. doi: 10.1002/j.1460-2075.1996.tb00468.x. - DOI - PMC - PubMed

Publication types