. 2022 Mar;16(3):856-867.
doi: 10.1038/s41396-021-01134-2. Epub 2021 Oct 15.

Adaptation to an amoeba host drives selection of virulence-associated traits in Vibrio cholerae

Affiliations

Adaptation to an amoeba host drives selection of virulence-associated traits in Vibrio cholerae

M Mozammel Hoque et al. ISME J. 2022 Mar.

Abstract

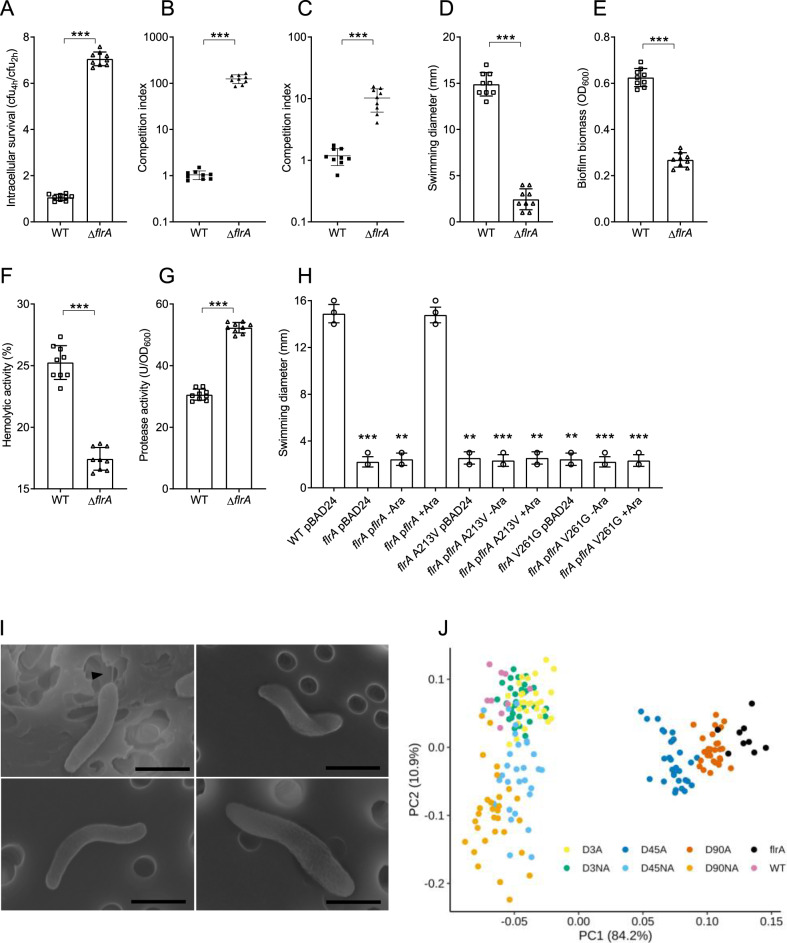
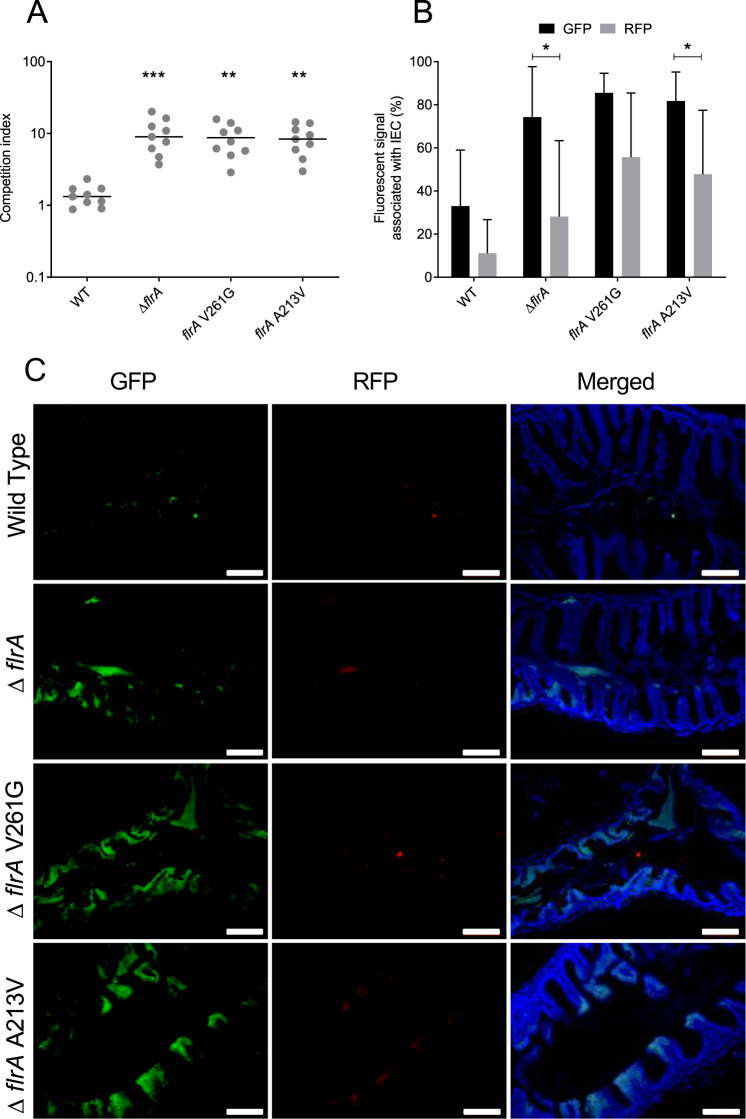
Predation by heterotrophic protists drives the emergence of adaptive traits in bacteria, and often these traits lead to altered interactions with hosts and persistence in the environment. Here we studied adaptation of the cholera pathogen, Vibrio cholerae during long-term co-incubation with the protist host, Acanthamoeba castellanii. We determined phenotypic and genotypic changes associated with long-term intra-amoebal host adaptation and how this impacts pathogen survival and fitness. We showed that adaptation to the amoeba host leads to temporal changes in multiple phenotypic traits in V. cholerae that facilitate increased survival and competitive fitness in amoeba. Genome sequencing and mutational analysis revealed that these altered lifestyles were linked to non-synonymous mutations in conserved regions of the flagellar transcriptional regulator, flrA. Additionally, the mutations resulted in enhanced colonisation in zebrafish, establishing a link between adaptation of V. cholerae to amoeba predation and enhanced environmental persistence. Our results show that pressure imposed by amoeba on V. cholerae selects for flrA mutations that serves as a key driver for adaptation. Importantly, this study provides evidence that adaptive traits that evolve in pathogens in response to environmental predatory pressure impact the colonisation of eukaryotic organisms by these pathogens.


Conflict of interest statement

The authors declare no competing interests.

Figures

Fig. 1
Fig. 1. Intracellular survival, competitive fitness and virulence phenotypes of adapted and non-adapted isolates.
A Intracellular survival in A. castellanii of adapted (black) and non-adapted (grey) isolates calculated by dividing the CFU at 4 h by the CFU at 2 h of the assay. B Intracellular competitive fitness of adapted isolates in A. castellanii. C In vitro competition assay of adapted isolates grown in LB for 24 h. Competition index (CI) in amoeba (B) and in LB medium (C) was calculated by dividing the output ratio (adapted/∆lacZ) after incubation, corrected by the input ratio. Statistical analysis was performed to determine the significance of the CI of days 45 and 90 isolates compared to day 3 isolates. D Swimming motility of the adapted (black) and non-adapted (grey) isolates expressed as diameter (mm) of the zone travelled from point of inoculation by bacteria grown overnight on semi-solid LB agar plates. E Biofilm biomass of adapted (black) and non-adapted (grey) isolates as quantified by crystal violet staining. F Haemolytic activity of adapted (black) and non-adapted (grey) isolates expressed as percent haemolysis of 1% sheep erythrocyte suspension. G Protease activity of cell-free supernatants of adapted (black) and non-adapted (grey) isolates measured by azocasein hydrolysis. Data are obtained from 30 individual adapted and non-adapted isolates from 3 time points (days 3, 45 and 90). Data are shown as the median. Statistical analyses for (A, D, E, F, G) were performed using two-way ANOVA and Sidak’s multiple comparisons test. For (B, C) statistical analyses were performed using one-way ANOVA and Kruskal–Wallis test. Statistical significance is indicated by ∗∗∗p < 0.001.
Fig. 2
Fig. 2. Unique mutations in coding regions of adapted populations.
The locus tag and name of the affected gene are indicated in the first and second columns, respectively. The third column shows the amino acid change and its position in the protein with the affected nucleotide responsible for the amino acid change underscored in the parentheses. The black horizontal bars of the heatmap represent the frequency of respective mutations found in each population (P1, P2, P3) with value ranges from 10 to 100%. The symbols represent as follows *non-synonymous mutation, synonymous mutation, # same mutation also found in single clone at 100% frequencies.
Fig. 3
Fig. 3. Schematic representation of the non-synonymous mutations affecting conserved regions of the FlrA protein.
A The FlrA protein has three domains as indicated, an N-terminal signal receiver (REC) domain, a central ATPase-Associated domain with diverse cellular Activities (AAA+) and a C-terminal DNA binding helix turn helix (HTH) domain. Positions of the mutations in the central domain are indicated with respective amino acid and nucleotide base substitution in the codon. Affected amino acids in the sequence alignment of FlrA protein are indicated by black arrows. Protein sequences were retrieved from the NCBI protein database—V. cholerae A1552 (AUR70352), V. cholerae N16961 (NP_231768), V. fischeri (WP_011262363), V. parahaemolyticus (WP_025525752), V. vulnificus (WP_039545791), P. aeruginosa (NP_249788), L. pneumophila (WP_027221215), E. coli (MHO05571), S. enterica (WP_064013385), A. baumannii (SCY06189). B Structural model of FlrA generated from the crystal structure of the P. aeruginosa FleQ AAA+ domain is shown (5EXP). The monomers of the hexametric assemblies of the AAA+ domains of FleQ are shown in different colours (left). One monomer is shown with amino acid residues affected by nsSNPs highlighted in magenta (top right) and close-up view of the denoted residues is shown (bottom right).
Fig. 4
Fig. 4. Altered phenotypes in adapted isolates are due to the mutation in flrA.
A Intracellular survival of the wild type and ∆flrA in A. castellanii calculated by dividing the number of bacteria that were detected at 4 h by the 2 h samples. B CI of the wild type and ∆flrA in A. castellanii and LB (C) calculated by dividing the output ratio (WT/∆lacZ) after incubation corrected by the input ratio. D Swimming motility of the wild type and ∆flrA expressed as diameter (mm) of the zone travelled from point of inoculation by bacteria grown overnight on semi-solid LB agar plates. E Biofilm biomass of the wild type and ∆flrA quantified by CV staining. F Haemolytic activity of the wild type and ∆flrA expressed as percent haemolysis of 1% sheep erythrocyte suspension. G Protease activity in culture supernatants of the wild type and ∆flrA measured by azocasein hydrolysis assay. H Swimming motility of the wild type and ∆flrA complemented with either pBAD24 or pBAD24 containing wild type flrA and/or mutated copies of the flrA (A213V and V261G). Values are expressed as diameter (mm) of the zone travelled from point of inoculation by bacteria grown overnight on semi-solid LB agar plates containing ampicillin and with or without arabinose. All of the data are from nine independent biological replicates and are shown as the mean ± standard deviation. Statistical significance was determined by two-tailed, non-parametric Mann–Whitney test (AG), one-way ANOVA and Kruskal–Wallis test (H) and is indicated by ∗∗∗p < 0.001. I Scanning electron micrograph showing presence or absence of flagellum on V. cholerae. Wild type A1552 (top left), A1552 ΔflrA (top right), A1552 flrA A213V (Bottom left), A1552 flrA V261G (Bottom right). Presence of flagella in wild type image indicated with black arrow. Scale bars: 1 µm. J Principal component analysis (PCA) on the changes in the four virulence phenotypes (motility, biofilm, hemolysin and protease) across adapted isolates, non-adapted isolates, wild type and ∆flrA mutant.
Fig. 5
Fig. 5. Enhanced colonisation of adapted isolates in a zebrafish infection model.
A CI of adapted isolates with mutations in flrA in zebrafish infection model was calculated by dividing the output ratio of test strain (e.g. flrA mutants) to ∆lacZ after infection corrected by the input ratio. Data are from nine independent biological replicates and are shown as the median. Statistical significance was determined by one-way ANOVA and Kruskal–Wallis test and is indicated by ∗∗∗p < 0.001 and ∗∗p < 0.01. B Quantification of bacterial fluorescence associated with intestinal epithelial cells of zebrafish after infection. Data are presented as percentages of GFP (test strain) and RFP (∆lacZ mutant) signal quantified by fluorescent pixel count of tissue sections in ImageJ. Statistical significance was determined by one-way ANOVA and Tukey’s multiple comparison test and is indicated by p < 0.05. C Colonisation of adapted isolates in adult zebrafish intestine. The four panels show representative fluorescence microscopy images of intestinal epithelial cell of adult zebrafish colonised with the indicated bacteria tagged with GFP and ∆lacZ strain tagged with RFP. Scale bars: 100 µm.

References

    1. Jürgens K, Matz C. Predation as a shaping force for the phenotypic and genotypic composition of planktonic bacteria. Anton Van Leeuwen. 2002;81:413–34. - PubMed
    1. Brüssow H. Bacteria between protists and phages: from antipredation strategies to the evolution of pathogenicity. Mol Microbiol. 2007;65:583–9. - PubMed
    1. Pernthaler J. Predation on prokaryotes in the water column and its ecological implications. Nat Rev Microbiol. 2005;3:537–46. - PubMed
    1. Matz C, Kjelleberg S. Off the hook–how bacteria survive protozoan grazing. Trends Microbiol. 2005;13:302–7. - PubMed
    1. Espinoza-Vergara G, Noorian P, Silva-Valenzuela CA, Raymond BBA, Allen C, Hoque MM, et al. Vibrio cholerae residing in food vacuoles expelled by protozoa are more infectious in vivo. Nat Microbiol. 2019;4:2466–74. - PMC - PubMed

Publication types